Open Access
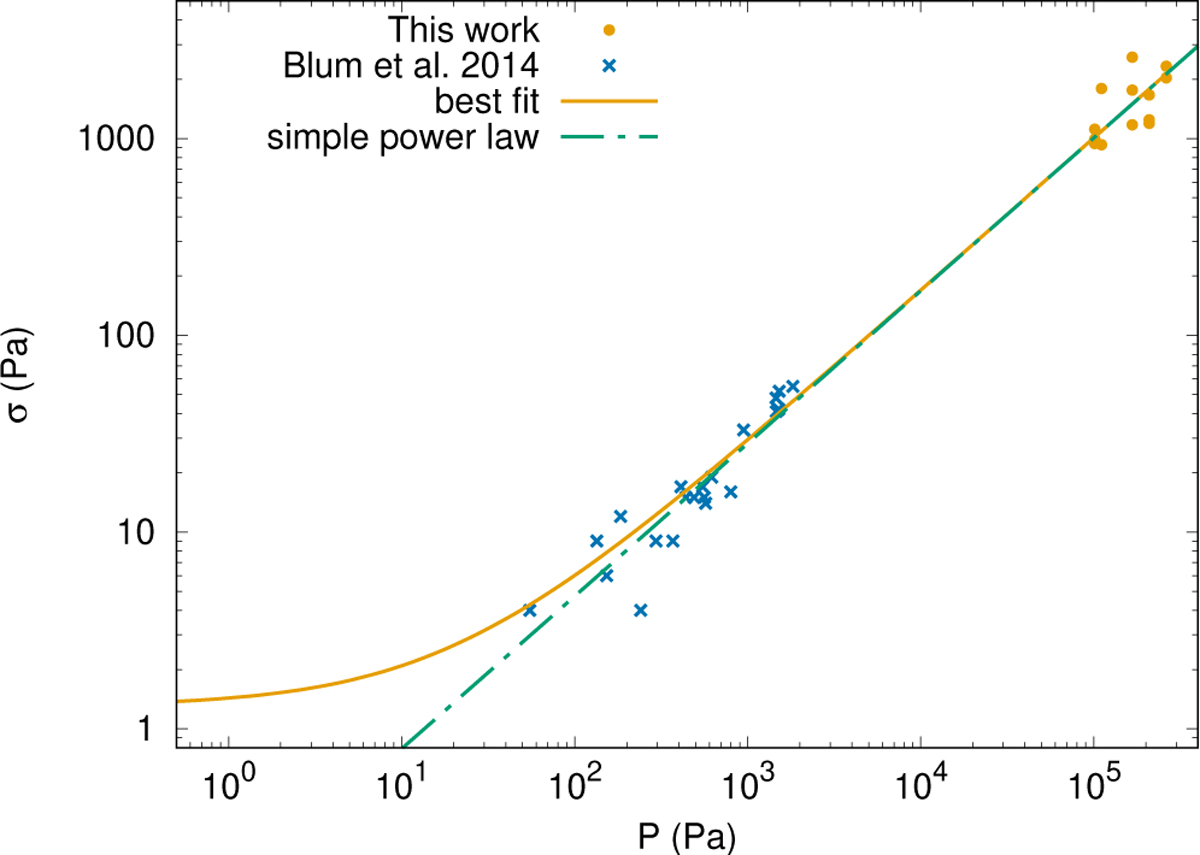
Fig. 7
Download original image
Tensile strength of the samples as a function of the compression. The solid orange line represents the best-fitting Eq. (7) to the data from Blum et al. (2014) (light-blue crosses) and our data (orange dots). The dash-dotted yellow line represents the simple power law according to Eq. (8).
Current usage metrics show cumulative count of Article Views (full-text article views including HTML views, PDF and ePub downloads, according to the available data) and Abstracts Views on Vision4Press platform.
Data correspond to usage on the plateform after 2015. The current usage metrics is available 48-96 hours after online publication and is updated daily on week days.
Initial download of the metrics may take a while.