| Issue |
A&A
Volume 704, December 2025
|
|
|---|---|---|
| Article Number | A136 | |
| Number of page(s) | 9 | |
| Section | Celestial mechanics and astrometry | |
| DOI | https://doi.org/10.1051/0004-6361/202556271 | |
| Published online | 11 December 2025 | |
An infrared celestial reference frame realized by the CatWISE2020 catalog
1
School of Astronomy and Space Science, Key Laboratory of Modern Astronomy and Astrophysics (Ministry of Education), Nanjing University,
163 Xianlin Avenue,
210023
Nanjing,
PR
China
2
University of Chinese Academy of Sciences,
Nanjing
211135,
PR
China
3
Research Center for Computing, National Research and Innovation Agency,
Bogor,
Indonesia
★ Corresponding author: This email address is being protected from spambots. You need JavaScript enabled to view it.
Received:
5
July
2025
Accepted:
20
October
2025
Abstract
Context. The International Celestial Reference System (ICRS) is currently realized by radio (ICRF3) and optical (Gaia-CRF3) reference frames, while an infrared reference frame is still missing.
Aims. We aim to establish an infrared celestial reference frame using the CatWISE2020 catalog and investigate its alignment with Gaia DR3 data.
Methods. We cross-matched 1.89 billion CatWISE2020 sources with Gaia DR3 and Gaia-CRF3 sources from five- or six-parameter astrometric solutions. We performed a vector-spherical-harmonics (VSH) analysis on positional and proper-motion differences for common sources.
Results. The global rotation and glide between CatWISE2020 and Gaia DR3 are found to be 6.6 and 6.9 mas for position system, and 1.9 and 2.7 mas yr−1 for proper motion system. Internal differences between stellar frame and extragalactic frame in CatWISE2020 are found to be ~6 mas for position and ~1 mas yr−1 for proper motion. Magnitude-dependent systematic differences on positions and proper motions are also presented.
Conclusions. So far, the CatWISE2020 catalog is the best available comprehensive infrared all-sky survey with the highest astrometric accuracy. After correcting for systematic errors with respect to the Gaia celestial reference frame, it can serve as an infrared realization of the ICRS.
Key words: astrometry / reference systems
© The Authors 2025
 Open Access article, published by EDP Sciences, under the terms of the Creative Commons Attribution License (https://creativecommons.org/licenses/by/4.0), which permits unrestricted use, distribution, and reproduction in any medium, provided the original work is properly cited.
This article is published in open access under the Subscribe to Open model. This email address is being protected from spambots. You need JavaScript enabled to view it. to support open access publication.
1 Introduction
The fundamental celestial reference system adopted by the International Astronomical Union (IAU), the International Celestial Reference System (ICRS; Arias et al. 1995), is mainly realized by two reference frames, namely, the third realization of the International Celestial Reference Frame (ICRF3; Charlot et al. 2020) in the radio band, and the Gaia Celestial Reference Frame 3 (Gaia-CRF3; Gaia Collaboration 2022) in the optical band.
Based on nearly 40 years of data acquired by very-long-baseline interferometry and analyzed by state-of-the-art astronomical and geophysical modeling, the ICRF3 consists of positions of extragalactic sources in three radio bands (S/X, K, and X/Ka). Three hundred and three uniformly distributed defining sources are selected to fix the axes of the reference frame. The effect of the Galactic aberration caused by galactocentric acceleration of the Solar System barycenter (SSB) is modeled and estimated in the data analysis.
In the optical band, the third data release of the Gaia mission (Gaia Collaboration 2016) of the European Space Agency (ESA), Gaia Data Release 3 (DR3) (Gaia Collaboration 2023), has provided astrometry for more than 1.8 billion sources with accuracy ranging from a few tens of microarcseconds to about 1 milliarcsecond, depending on magnitude. The Gaia-CRF3, containing over 1.6 million compact extragalactic sources in Gaia DR3, are constructed by positional cross-matching with 17 external catalogs of quasars (QSOs) and active galactic nuclei (AGNs), followed by astrometric filtering to remove stellar contaminants. The observational principles of Gaia cannot fully fix the reference frame; thus, the orientation of the axes of Gaia-CRF3 is fixed by 2269 ICRF3 S/X sources with optical counterparts identified in Gaia EDR3 (Lindegren et al. 2021).
In practice, the full Gaia catalog, rather than Gaia-CRF, is typically used as a standard reference frame, because of the limited sky density and magnitude coverage of Gaia-CRF sources (Hobbs et al. 2021). Although the Gaia catalog has revolutionized astrometry through its unprecedented precision, it provides significantly fewer stars in the dusted regions such as the Galactic bulge and Galactic bar, due to the interstellar extinction. An infrared celestial reference frame linked to Gaia, built from all-sky infrared survey, could help solve this problem. Since the infrared emission penetrate dusted areas easier than optical light, the observable infrared sources are expected to be much denser in high-extinction areas. An infrared reference frame would extend the Gaia reference frame into a wider band and enable deeper studies toward the Galactic bar and bulge, or inner Galactic disk.
Liu et al. (2024) presented a study to construct an infrared reference frame using observations from the AllWISE catalog (Cutri et al. 2013). They analyzed the systematic differences in positions and proper motions for common sources between the AllWISE and Gaia DR3 catalogs. They find the discrepancy between quasars and all sources in the AllWISE catalog when compared to Gaia separately. However, we note that the infrared all-sky CatWISE2020 catalog is more complete, deeper, and much more accurate in terms of proper-motion measurements compared to AllWISE. Following their previous efforts, this work aimed to investigate the astrometric performance of the CatWISE2020 catalog (with respect to the Gaia observations), with the purpose of using it as a better representation of the infrared reference frame in the framework of Gaia.
An introduction to the CatWISE2020 catalog and the cross-match with Gaia DR3 catalog are given in Section 2. An analysis of astrometric properties of CatWISE2020 sources is described in Section 3. In Section 4, we present comparison of positions and proper motions between CatWISE2020 and Gaia DR3. Section 6 gives the concluding remarks.
2 CatWISE2020 catalog and cross-match with Gaia DR3
2.1 Features of the CatWISE2020 catalog
An all-sky, deep, high-quality infrared catalog is required to construct a celestial reference frame in the infrared band. The CatWISE2020 catalog (Marocco et al. 2021) consists of 1 890 715 640 sources across the entire sky. Its data were selected from the Wide-field Infrared Survey Explorer (WISE; Wright et al. 2010) and NEOWISE survey (Mainzer et al. 2014) data at 3.4 and 4.6 μm (W1 and W2) collected from 2010 January 7 to 2018 December 13. Compared to the AllWISE catalog (Cutri et al. 2013), which was constructed from the observation of WISE during January 2010 to February 2011, CatWISE2020 has six times as many exposures spanning over 16 times as long a time baseline. As a result, the accuracy of source proper motion is ~20 mas yr−1 for W1 ~ 15 mag and ~100 mas yr−1 for W1 ~ 17 mag. This is a 12-fold improvement over AllWISE. Moreover, CatWISE2020 adopted the source-detection software “crowdsource” used by the unWISE catalog (Schlafly et al. 2019), which detects roughly 0.7 magnitudes deeper and much more sources in crowded regions than that used by AllWISE, and it more accurately models faint sources. Owing to its enhanced detection software and more exposures, CatWISE2020 contains more than twice as many sources as AllWISE and achieves higher astrometric accuracy, especially for source proper motions.
Marocco et al. (2021) analyzed the astrometric properties of the CatWISE2020 catalog by cross-matching the brightest sources in each CatWISE2020 tile with Gaia DR2 observations (Gaia Collaboration 2018). The authors note that the original CatWISE2020 catalog available on the IRSA uses unWISE coadds without adjustments to the AllWISE epochs. This results in small tile-dependent astrometric offsets for sources in the CatWISE2020 catalog. A table of corrections for each tile is provided by the authors. In this paper, however, we made use of the CatWISE2020 catalog from the VizieR database (Ochsenbein et al. 2000), with the corrections already applied.
2.2 Cross-match algorithm
In order to assess the astrometric performance of CatWISE2020 by comparing to Gaia DR3 observations, a cross-match is required to find common sources between these two catalogs. Our cross-match algorithm was revised from that used by Marrese et al. (2017) to generate pre-computed cross-matching of the Gaia catalog with several external catalogs (see Gaia archive1), and by Pineau et al. (2011) to cross-match 2XMMi and SDSS7 catalogs. It is fully based on astrometric parameters of sources; that is, all the other information such as photometry was not used.
Before the cross-match, the positions and corresponding errors and correlations were propagated for every Gaia source with proper motion information from the Gaia DR3 reference epoch (J2016.0), to the CatWISE2020 reference epoch (MJD = 57 170). The function “epochPropErr(tYr, astrom22)” in the STILTS package (Taylor 2006) was used for the propagation. STILTS is a tool for manipulating tabular data, especially for astronomical catalogs. The additional error introduced by the epoch propagation is negligible in this work because of Gaia DR3’s high proper-motion precision level and the short epoch difference between Gaia DR3 and CatWISE2020 (about half a year). All the following data reduction is based on propagated Gaia astrometric parameters. Detailed steps of the cross-match algorithm are introduced below.
2.2.1 First filter
For each propagated Gaia source, we simply found all sources in the CatWISE2020 catalog that lie within a 5 arcsecond radius of it. This radius is adequately large considering the positional uncertainties of Gaia DR3 and CatWISE and assuming systematic errors are much smaller than 5 arcseconds. The function “tmatch2” in the STILTS package (Taylor 2006) was used in this step.
2.2.2 Good neighbor selection
We revised the methods described in Pineau et al. (2011) and Marrese et al. (2017) to select good neighbors from first filter results. This step filters out matches that is very likely to be wrong, while maintaining the completeness of possible cross-match. Two assumptions are made: (a) for each source, the positional differences between its counterparts (if any) in the catalogs mostly come from random errors rather than systematic errors between catalogs; (b) the source positions in both catalogs follow a 2D Gaussian distribution centered at the nominate coordinate, whose correlation coefficient and formal errors are accurately given in the catalogs.
For a matched pair in Sect. 2.2.1, we denote (αG, δG) and (αC, δC) the equatorial coordinates in Gaia and CatWISE, respectively. On the tangent plane of the celestial sphere with the tangent point at the Gaia position, we built a Cartesian coordinate system with its x-axis pointing in the eα direction and its y-axis pointing in the eδ direction. We now have the coordinates (x, y) the projected CatWISE2020 positions onto this local tangent frame. If the match is correct, the probability density function of the CatWISE2020 position on this frame should be a 2D Gaussian function:
![Mathematical equation: $\[\begin{aligned}f(x, y)= & \frac{1}{2 \pi \sigma_x \sigma_y \sqrt{1-\rho^2}} \\& \exp \left[-\frac{1}{2\left(1-\rho^2\right)}\left(\frac{x^2}{\sigma_x^2}-\frac{2 \rho x y}{\sigma_x \sigma_y}+\frac{y^2}{\sigma_y^2}\right)\right],\end{aligned}\]$](/articles/aa/full_html/2025/12/aa56271-25/aa56271-25-eq1.png) (1)
(1)
where the combined error and correlation coefficients of x and y are
![Mathematical equation: $\[\begin{aligned}& \sigma_x^2=\sigma_{\alpha_G}^2+\sigma_{\alpha_C}^2, \quad \sigma_y^2=\sigma_{\delta_G}^2+\sigma_{\delta_C}^2, \\& \rho \sigma_x \sigma_y=\rho_G \sigma_{\alpha_G} \sigma_{\delta_G}+\rho_C \sigma_{\alpha_C} \sigma_{\delta_C} .\end{aligned}\]$](/articles/aa/full_html/2025/12/aa56271-25/aa56271-25-eq2.png) (2)
(2)
In the above expressions, σxG, σyG, ρG, σxC, σyC, ρC are errors and correlation coefficients of Gaia and CatWISE2020 source coordinates, and the distribution function f(x, y) depends on (x, y) only through
![Mathematical equation: $\[D_M^2=\frac{1}{1-\rho^2}\left(\frac{x^2}{\sigma_x^2}-\frac{2 \rho x y}{\sigma_x \sigma_y}+\frac{y^2}{\sigma_y^2}\right)=\binom{x}{y}^T C^{-1}\binom{x}{y},\]$](/articles/aa/full_html/2025/12/aa56271-25/aa56271-25-eq3.png) (3)
(3)
where the matrix
![Mathematical equation: $\[C=\left(\begin{array}{cc}\sigma_x^2 & \rho \sigma_x \sigma_y \\\rho \sigma_x \sigma_y & \sigma_y^2\end{array}\right)\]$](/articles/aa/full_html/2025/12/aa56271-25/aa56271-25-eq4.png) (4)
(4)
is the variance-covariance matrix of the coordinates. The DM here is known as the Mahalanobis distance between the two positions, which follows a χ2 distribution with two degrees of freedom (Marrese et al. 2017). Then the probability that (x, y) falls within a certain ellipse is
![Mathematical equation: $\[P\left(D_M^2 \leq \chi_{2, \alpha}^2\right)=1-\alpha=\gamma,\]$](/articles/aa/full_html/2025/12/aa56271-25/aa56271-25-eq5.png) (5)
(5)
where γ is the confidence level and α is the probability that (x, y) will fall outside the ellipse. We adopted γ as 0.9999994267 (![Mathematical equation: $\[\chi_{2, \alpha}^{2}=28.7437\]$](/articles/aa/full_html/2025/12/aa56271-25/aa56271-25-eq6.png) ), which is equivalent to a 5σ confidence level of a 1D Gaussian distribution.
), which is equivalent to a 5σ confidence level of a 1D Gaussian distribution.
The choice of 5σ as the confidence limit is unusually large. This is due to the underestimation of the coordinate uncertainties of CatWISE2020 sources by a factor of about 1.5–2.5 (see Sect. 3), which caused the overestimation of ![Mathematical equation: $\[D_{M}^{2}\]$](/articles/aa/full_html/2025/12/aa56271-25/aa56271-25-eq7.png) . When taking the underestimation factor of 1.5 as an example, the “actual” γ would be 0.99831752, which in 1D is equivalent to about 2.93σ.
. When taking the underestimation factor of 1.5 as an example, the “actual” γ would be 0.99831752, which in 1D is equivalent to about 2.93σ.
The condition ![Mathematical equation: $\[D_{M}^{2} \leq \chi_{2, \alpha}^{2}\]$](/articles/aa/full_html/2025/12/aa56271-25/aa56271-25-eq8.png) in Eq. (5) gives the following selection criterion:
in Eq. (5) gives the following selection criterion:
![Mathematical equation: $\[D_M^2 \leq 28.7437 .\]$](/articles/aa/full_html/2025/12/aa56271-25/aa56271-25-eq9.png) (6)
(6)
Any matched CatWISE2020 source satisfying this equation is classified as a good neighbor.
2.2.3 Best neighbors selection
The matched samples were cleaner after the good-neighbor selection procedure, but one Gaia source may still have several CatWISE2020 counterparts, especially in crowded regions. Therefore, a best-neighbor selection step needs to be applied to find out the best counterpart for each Gaia source. We note that one CatWISE2020 source may still be matched to several Gaia sources after this step; it only happens to less than 0.1% of remaining matches, and such matches were not removed.
The approach for selecting the optimal neighbor is relatively straightforward: for each Gaia source with multiple counterparts, we calculate the probability density using coordinates of each CatWISE2020 counterpart with Eq. (1) and choose the one with the highest probability density as the best neighbor; for those Gaia sources with single counterpart, we simply choose the counterpart as the best neighbor. The probability density function is a function of the positions and corresponding errors of Gaia and CatWISE2020 sources, so the best neighbor is not always the closet counterpart.
Although in a different form, this algorithm is equivalent to choosing the match with highest figure of merit (FoM) defined in Sect. 3.5 of Marrese et al. (2017) to find best neighbor for a single Gaia source. The advantage of the FoM is that it can be used to compare the goodness of any match between any Gaia source and any CatWISE2020 source, but it takes more time to calculate since it depends on the source density around a given Gaia source. Our revised algorithm does not need to calculate the source density so that it is more efficient.
2.3 Cross-match with Gaia-CRF3 sources
The characteristics of reference frames established by extragalactic sources and stellar objects may differ (see the analysis of the AllWISE internal systematic differences in Liu et al. 2024). Extragalactic objects are more important because they are used to define the fundamental reference systems. Therefore, we carried out independent analysis for extragalactic sources and stellar sources in the CatWISE2020 catalog. To that end, we also cross-matched the CatWISE2020 catalog with the Gaia-CRF3 catalog. The results were then filtered so that the proper motions given in CatWISE2020 are insignificant compared to their uncertainties (Gaia Collaboration 2022):
![Mathematical equation: $\[X_\mu^2 \equiv\left[\begin{array}{ll}\mu_{\alpha *} & \mu_\delta\end{array}\right] \operatorname{Cov}(\mu)^{-1}\left[\begin{array}{c}\mu_{\alpha *} \\\mu_\delta\end{array}\right]<25 .\]$](/articles/aa/full_html/2025/12/aa56271-25/aa56271-25-eq10.png) (7)
(7)
The remaining sources are identified as common sources of the Gaia-CRF3 and the CatWISE2020 catalogs.
2.4 Cross-match results
In this work, 1 467 744 818 Gaia DR3 sources (with five-parameter and six-parameter solutions) and 1 890 715 640 CatWISE2020 sources are matched, and we found 1 229 083 520 common sources in the first filter step, from which 405 691 631 remained after the good neighbor selection. The best neighbor selection returned 404 033 670 pairs, which are used in later analysis. Only 21.4% of CatWISE2020 sources are found with a counterpart. Cross-match with the Gaia-CRF3 catalog returns 1 380 437 pairs (85.5% of Gaia-CRF3).
3 Astrometric properties of common sources
The sky density distribution of common stars and QSOs between CatWISE2020 and Gaia DR3 are shown in Fig. 1. The low density near the Galactic plane in the common QSOs distribution (left panel) is due to the lack of Gaia-CRF3 sources in this region, whereas the density of QSO high-Galactic-latitude regions is relatively uniform (~32 deg−2). As expected, most of the Gaia-CatWISE2020 stars are located around the Galactic plane, although there still exists a gap around the Galactic center and the Galactic plane, which is caused by the scarcity of Gaia DR3 sources due to high extinction and crowding in these areas.
Table 1 lists the total number of matches and median values of the uncertainties of astrometric parameters for matched sources. The median errors of position and proper motion of Gaia DR3 are much lower than that of CatWISE2020. Therefore, the positional differences between Gaia and CatWISE2020 counterparts are dominated by CatWISE2020 uncertainties, if there are no systematic errors between the two catalogs. Compared to QSOs, the stars have larger median uncertainties in CatWISE2020, but smaller ones in Gaia DR3. The histograms of positional and proper motion errors given in CatWISE2020 of common sources are given in Fig. 2.
Figure 3 demonstrates the histogram of CatWISE2020 W1 magnitude. Figure 4 is the plot of positional uncertainty σpos versus W1, where σpos is defined as the length of major axis of the error ellipse:
![Mathematical equation: $\[\sigma_{\mathrm{pos}}^2=\frac{\sigma_\alpha^2+\sigma_\delta^2+\sqrt{\left(\sigma_\alpha^2-\sigma_\delta^2\right)^2+4 \rho_{\alpha \delta}^2 \sigma_\alpha^2 \sigma_\delta^2}}{2} .\]$](/articles/aa/full_html/2025/12/aa56271-25/aa56271-25-eq11.png) (8)
(8)
Figure 4 shows that the accuracy levels of QSOs are generally higher than those of stars. Both curves in Fig. 4 show an upward trend at the faint end, and the uncertainty of stars (the red curve) also increases at the bright end.
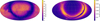 |
Fig. 1 Sky density distribution of common QSOs and stars in the Gaia DR3 and the CatWISE2020 survey. The figure uses Mollweide projection in the equatorial coordinates, with α = δ = 0 at the left of the map, north up, and α increasing from left to right. The color shows the number of sources in each pixel. Pixels are divided using HEALPixel on the order of 6 (pixel size ≈0.84 deg2). |
Median values of position and proper-motion uncertainties for common stars and quasars.
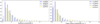 |
Fig. 2 Histograms of positional and proper-motion uncertainties given in CatWISE2020 for common sources. The vertical axes show the relative frequency of each bin. |
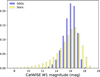 |
Fig. 3 Histogram of CatWISE2020 W1 magnitude for common sources. The vertical axis shows relative frequency of each bin. |
4 Coordinates and proper-motion differences between Gaia and CatWISE2020 sources
To ensure that the infrared reference frame is compatible with the concept of the ICRS, the systematic errors of the CatWISE2020 catalog must be removed. This was done by comparing the CatWISE2020 and the Gaia DR3 catalog. Since the angular separation between Gaia and CatWISE2020 counterparts is smaller than 5 arcseconds, the differences in right ascension and declination can be written as
![Mathematical equation: $\[\begin{aligned}\Delta \alpha^* & =\left(\alpha_{\text {CatWISE}}-\alpha_{{Gaia }}\right) ~\cos~ \delta_{{Gaia}} \\\Delta \delta & =\delta_{\text {CatWISE}}-\delta_{{Gaia}} .\end{aligned}\]$](/articles/aa/full_html/2025/12/aa56271-25/aa56271-25-eq13.png) (9)
(9)
As mentioned in Sect. 2.2, the coordinates of Gaia sources were propagated to the CatWISE2020 reference epoch in advance. Considering the short epoch difference of about half a year and the high precision of Gaia proper motions, the additional errors introduced by epoch propagation are negligible. The differences in proper motion components are similar:
![Mathematical equation: $\[\begin{aligned}\Delta \mu_\alpha^* & =\mu_{\alpha, \text {CatWISE}}^*-\mu_{\alpha, {Gaia}}^* \\\Delta \mu_\delta & =\mu_{\delta, \text {CatWISE}}-\mu_{\delta, {Gaia}} .\end{aligned}\]$](/articles/aa/full_html/2025/12/aa56271-25/aa56271-25-eq14.png) (10)
(10)
Figures 5 and 6 show the scatter plots of Δα*, Δδ, Δμα* and Δμδ, as well as corresponding histograms. The plots roughly show 2D normal distributions as expected. Asymmetry around zero is slightly visible in the histograms. This implies systematic errors of the CatWISE2020 catalog with respect to Gaia observations.
The normalized differences represent another important indicator for the astrometric systematic errors. They are defined as the value of differences divided by corresponding errors (Lindegren et al. 2021):
![Mathematical equation: $\[X_{\Delta \alpha}=\frac{\Delta \alpha^*}{\sqrt{\sigma_{\alpha^*, \text {Gaia}}^2+\sigma_{\alpha^*, \text {CatWISE}}^2}}, X_{\Delta \delta}=\frac{\Delta \delta}{\sqrt{\sigma_{\delta, \text {Gaia}}^2+\sigma_{\delta, \text {CatWISE}}^2}} .\]$](/articles/aa/full_html/2025/12/aa56271-25/aa56271-25-eq15.png) (11)
(11)
Similarly, the normalized proper-motion differences are
![Mathematical equation: $\[X_{\Delta \mu_\alpha}=\frac{\Delta \mu_{\alpha^*}}{\sqrt{\sigma_{\mu_\alpha^*, \text {Gaia}}^2+\sigma_{\mu_\alpha^*, \text {CatWISE}}^2}}, X_{\Delta \mu_\delta}=\frac{\Delta \mu_\delta}{\sqrt{\sigma_{\mu_\delta, \text {Gaia}}^2+\sigma_{\mu_\delta, \text {CatWISE}}^2}} .\]$](/articles/aa/full_html/2025/12/aa56271-25/aa56271-25-eq16.png) (12)
(12)
The above definitions treat coordinate differences in right ascension and declination separately. When considering the angular separation for each pair of common sources, the normalized parameter can be derived (Mignard et al. 2016):
![Mathematical equation: $\[X_{\Delta \rho}^2=\left[\begin{array}{ll}X_{\Delta \alpha} & X_{\Delta \delta}\end{array}\right]\left[\begin{array}{cc}1 & C \\C & 1\end{array}\right]^{-1}\left[\begin{array}{l}X_{\Delta \alpha} \\X_{\Delta \delta}\end{array}\right],\]$](/articles/aa/full_html/2025/12/aa56271-25/aa56271-25-eq17.png) (13)
(13)
where C is the correlation coefficient between Δα* and Δδ, and
![Mathematical equation: $\[C=\frac{\operatorname{Cov}\left(\alpha_{{Gaia}}, \delta_{{Gaia}}\right)+\operatorname{Cov}\left(\alpha_{\text {CatWISE}}, \delta_{\text {CatWISE}}\right)}{\sigma_{\Delta \alpha^*} \sigma_{\Delta \delta}},\]$](/articles/aa/full_html/2025/12/aa56271-25/aa56271-25-eq18.png) (14)
(14)
considering the covariance between Δα* and Δδ.
The normalized proper-motion differences, XΔμ, can also be defined by replacing the XΔα and XΔδ in Eq. (11) with XΔμα and XΔμδ. However, the correlation coefficients between μα* and μδ are not provided in the CatWISE2020 catalog. Thus, they are set to be zero when computing normalized proper-motion differences.
We plotted the normalized differences in positions and proper motions in Fig. 7. The differences should be dominated by uncertainties of CatWISE2020 sources because of Gaia’s much better astrometric measurements. The deviation from standard normal distribution and Rayleigh distribution in the left panels of Fig. 7 indicates that the random errors of CatWISE2020 coordinates are underestimated by a factor of 1.5–2.5. Larger deviation from expected distribution is shown for stars compared to quasars. On the other hand, the proper-motion uncertainties of the CatWISE2020 catalog are also more reliable for quasars.
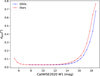 |
Fig. 4 CatWISE2020 positional uncertainty σpos versus CatWISE2020 W1 magnitude. The dots show the median values of σpos within each bin. |
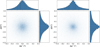 |
Fig. 5 Scatter plots for coordinate differences and corresponding histograms for matched pairs. Left and right show plots for quasars and stars, respectively. |
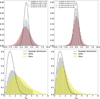 |
Fig. 7 Distribution of normalized astrometric parameters between Gaia DR3 and CatWISE2020 common quasars and stars. The upper panels show the distribution of normalized coordinate differences XΔα and XΔδ, as well as normalized the proper motion differences XΔμα and XΔμδ. The bottom panels show the normalized angular separation, XΔρ, and general proper-motion differences, XΔμ. |
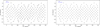 |
Fig. 8 Coordinate (left) and proper-motion (right) offsets between CatWISE2020 and Gaia DR3. The sky is divided into 192 equal area pixels (HEAlPixel on the order of 2). Each vector represents averaged offsets in the pixel. |
5 Large-scale systematic differences
In order to visualize the large-scale, sky-dependent systematic offsets, we used HEALPixel on the order of two to divide the sky into 192 equal-area pixels and calculate the average positions and proper-motion offsets in each pixel. The result is shown in Fig. 8. The figure shows clear systematic offsets that can reach about 17 mas for positions and 6 mas yr−1 for proper motions. The offsets form a rather continuous vector field, which can be described and analyzed with the vector spherical harmonics.
5.1 Vector-spherical-harmonics fit
The differences in positions and proper motions for common sources can be described mathematically as a discrete vector field on a sphere. This vector field can be decomposed with the vector spherical harmonics (VSHs). The VSHs are an extension of the scalar spherical harmonics and are also orthogonal real basis functions on the unit sphere; these are widely used in astrometry for modeling both large-scale and small-scale systematic differences between catalogs. One of the benefits of using VSHs rather than scalar spherical harmonics or other methods to fit the systematic differences is that the terms in VSHs expressions have a more explicit geometrical meaning. For example, the first-order terms in the expression could be interpreted as global rotation and glide terms, while terms of higher orders describe regional systematic errors.
Following the method and Eq. (30) in Mignard & Klioner (2012), we fit the position and proper motion differences between CatWISE2020 and Gaia with VSHs. The practical model function for the fitting can be written as
![Mathematical equation: $\[\begin{aligned}\boldsymbol{V}(\alpha, \delta) & =\sum_{l=1}^{l_{\max }}\left(t_{l 0} \boldsymbol{T}_{l 0}+s_{l 0} \boldsymbol{S}_{l 0}\right) \\& +2 \sum_{m=1}^l\left(t_{l m}^{\mathfrak{R}} \boldsymbol{T}_{l m}^{\mathfrak{R}}-t_{l m}^{\mathfrak{I}} \boldsymbol{T}_{l m}^{\mathfrak{I}}+s_{l m}^{\mathfrak{R}} \boldsymbol{S}_{l m}^{\mathfrak{R}}-s_{l m}^{\mathfrak{I}} \boldsymbol{S}_{l m}^{\mathfrak{I}}\right)\end{aligned},\]$](/articles/aa/full_html/2025/12/aa56271-25/aa56271-25-eq19.png) (15)
(15)
where Tlm and Slm are toroidal and spheroidal terms of VSHs. This model is linear to those terms and also well conditioned due to the orthogonality of VSHs. We used a weighted least-squares method to fit the model to the systematic differences. The target function to minimize is (Mignard & Klioner 2012)
![Mathematical equation: $\[\sum_{k=1}^N\left(\frac{\left(\Delta \alpha_k^*-V_\alpha\left(\alpha_k, \delta_k\right)\right)^2}{\sigma_{\Delta \alpha_k^*}^2}+\frac{\left(\Delta \delta_k-V_\delta\left(\alpha_k, \delta_k\right)\right)^2}{\sigma_{\Delta \delta_k}^2}\right),\]$](/articles/aa/full_html/2025/12/aa56271-25/aa56271-25-eq20.png) (16)
(16)
where ![Mathematical equation: $\[\Delta \alpha_{k}^{*}\]$](/articles/aa/full_html/2025/12/aa56271-25/aa56271-25-eq21.png) and Δδk are coordinate differences for the k-th match defined in Eq. (9). For fitting proper motion differences, one only needs to replace Δα and Δδ in Eqs. (15) and (16) with Δμα* and Δμδ.
and Δδk are coordinate differences for the k-th match defined in Eq. (9). For fitting proper motion differences, one only needs to replace Δα and Δδ in Eqs. (15) and (16) with Δμα* and Δμδ.
We used Eq. (15) and lmax = 2 to fit the position and proper motion systematic differences for quasars and stars, independently. Thanks to the orthogonality of VSHs, increasing the lmax would not change the fitting results significantly for lower degrees of VSHs. We do not include higher degrees of VSHs, because they represent more regional offsets.
The number of common stars is over 400 million, so there would be over 800 million rows in the design matrix. To reduce computational cost, we used HealPixel on the order of nine (Nside = 512) to divide the entire sky into 3 145 728 equal-area pixels. The mean value of the position and proper-motion differences are calculated in each pixel and are used in the following analysis. The corresponding errors were also calculated with error propagation:
![Mathematical equation: $\[\sigma_{\bar{\alpha}}=\frac{1}{N} \sqrt{\sum_{i=1}^N \sigma_{\alpha, i}^2}, \quad \sigma_{\bar{\delta}}=\frac{1}{N} \sqrt{\sum_{i=1}^N \sigma_{\delta, i}^2} .\]$](/articles/aa/full_html/2025/12/aa56271-25/aa56271-25-eq22.png) (17)
(17)
The average is not applied for quasar matches as the number of quasar matches are only 1.38 million and could be easily fit within several seconds.
The least-squares fitting is very sensitive to outliers, which in this case are pairs whose offsets cannot be described by the model (Eq. (15)). To make the VSHs-fit results more robust, we applied iterative outlier elimination (Gaia Collaboration 2022) along with the VSHs fitting, even though most wrong matches should already be eliminated by the good-neighbor-selection procedure (see Sect. 2.2.2). The steps for iterative outlier elimination are listed below.
We use Eq. (15) to obtain the VSHs-fit results with least-squares fitting using the remaining pairs (all pairs in the first iteration).
We calculate normalized post-fit residuals, X, for each match (including those already excluded in previous iterations) using
![Mathematical equation: $\[\begin{aligned}X^2= & \frac{1}{1-\rho^2}\left[\left(\frac{\Delta \alpha^*-\hat{\Delta \alpha}}{\sigma_{\Delta \alpha^*}}\right)^2\right. \\& \left.-\frac{2 \rho(\Delta \alpha^*-\hat{\Delta \alpha})(\Delta \delta-\hat{\Delta \delta})}{\sigma_{\Delta \alpha^*} \sigma_{\Delta \delta}}+\left(\frac{\Delta \delta-\hat{\Delta \delta}}{\sigma_{\Delta \delta}}\right)^2\right]^,\end{aligned}\]$](/articles/aa/full_html/2025/12/aa56271-25/aa56271-25-eq31.png) (18)
where
(18)
where ![Mathematical equation: $\[\Delta \hat{\alpha}^{*}\]$](/articles/aa/full_html/2025/12/aa56271-25/aa56271-25-eq32.png) and
and ![Mathematical equation: $\[\hat{\Delta} \delta\]$](/articles/aa/full_html/2025/12/aa56271-25/aa56271-25-eq33.png) are model-predicted values.
are model-predicted values.We accept matches satisfying X < κX0.5, where
κ is an adjustable clip limit (set to 2.5 based on empirical testing).
X0.5 is the median value of X for remaining pairs.
If the remaining pairs are exactly the same as in any previous iterations, we end the iteration; otherwise, we return to step one.
The idea for this pipeline is that the wrong matches would generally have a higher X value since they do not fit the model well. Several tests on a simulated dataset where some random wrong matches were inserted show that this algorithm is highly efficient in removing outliers, and the VSHs-fit results are much more reliable after the elimination.
Tables 2 and 3 list the fitting results for position and proper motion differences, respectively. The first-degree VSHs coefficients in Eq. (15) are transformed into more explicit rotation and glide terms with
![Mathematical equation: $\[\begin{aligned}R_1-{ }_{\imath}^{\circ} R_2 & =-\sqrt{\frac{3}{4 \pi}} t_{11}, \quad R_3=\sqrt{\frac{3}{8 \pi}} t_{10} \\G_1-{ }_{\imath}^{\circ} G_2 & =-\sqrt{\frac{3}{4 \pi}} s_{11}, \quad G_3=\sqrt{\frac{3}{8 \pi}} s_{10} .\end{aligned}\]$](/articles/aa/full_html/2025/12/aa56271-25/aa56271-25-eq34.png) (19)
(19)
Quasar and star matches were fitted separately. The VSHs-fit results could be used to correct the CatWISE astrometry to align with Gaia. The offsets between CatWISE2020 quasars and Gaia-CRF3 quasars are 0.93 mas for rotation and 1.83 mas for glide. For stars, the offsets are, however, 6.56 mas for rotation and 6.89 mas for glide. The proper-motion offsets are are 1.35 (rotation) and 1.57 (glide) mas yr−1 for quasars, as well as 1.90 (rotation) and 2.7 mas yr−1 (glide) for stars.
The VSHs-fit results for extragalactic objects and stellar objects are not consistent within the 3-σ range. Under the assumption that the astrometry for quasars and stars are consistent within Gaia DR3 itself, internal discrepancies between quasars and stars in the CatWISE2020 catalog are implied. Regarding positions, the differences of rotation and glide vectors between quasars and stars reach 5.8 mas and 5.3 mas, respectively. For proper-motion offsets, the differences are 0.8 mas for rotation and 1.2 mas for glide. Such internal discrepancies between quasars and stars are also found in the AllWISE catalog when compared to Gaia DR3 data (Liu et al. 2024).
Rotation and glide components for positional offsets (unit: mas).
Rotation and glide components for VSHs fit for proper-motion differences (unit: mas yr−1).
5.2 VSHs fitting for different magnitudes and colors
Catalogs may also suffer from magnitude-dependent and color-dependent systematic offsets (Shi et al. 2019; Liu et al. 2024). We investigated such effect by splitting the matched data into several bins according to CatWISE2020 magnitude or color index, and we used first-degree VSHs to fit and obtain glide and rotation terms for each bin. The magnitude here refers to W1, and the color is defined as W1 − W2, where W1 and W2 are CatWISE2020 instrumental profile-fit photometry magnitudes in band 1 (3.4 μm) and band 2 (4.6 μm).
The results for the magnitude dependence are shown in Fig. 9. If no systematic difference is present, the fitting results should be consistent in different magnitude bins. However, as shown in the figure, several VSHs components differ in different magnitude bins. This is most pronounced for the parameters R3, ![Mathematical equation: $\[G_{3}, \dot{R}_{2}, \dot{R}_{3}\]$](/articles/aa/full_html/2025/12/aa56271-25/aa56271-25-eq35.png) , and
, and ![Mathematical equation: $\[\dot{G}_{3}\]$](/articles/aa/full_html/2025/12/aa56271-25/aa56271-25-eq36.png) , as their fitting results in the brightest bin and the faintest bin deviate by more than 5σ, even after accounting for underestimated uncertainties. This suggests that the normal VSHs fitting using sources in all magnitude bins may not be appropriate to correct the large-scale, sky-dependent errors in the catalog. For example, as shown in Table 3, the
, as their fitting results in the brightest bin and the faintest bin deviate by more than 5σ, even after accounting for underestimated uncertainties. This suggests that the normal VSHs fitting using sources in all magnitude bins may not be appropriate to correct the large-scale, sky-dependent errors in the catalog. For example, as shown in Table 3, the ![Mathematical equation: $\[\dot{R}_{3}\]$](/articles/aa/full_html/2025/12/aa56271-25/aa56271-25-eq37.png) component for quasars is only 0.42 mas, whereas the
component for quasars is only 0.42 mas, whereas the ![Mathematical equation: $\[\dot{R}_{3}\]$](/articles/aa/full_html/2025/12/aa56271-25/aa56271-25-eq38.png) for quasars in the faintest bin (W1 > 16.6) reaches 7.8 mas yr−1, a nearly 20-fold increase.
for quasars in the faintest bin (W1 > 16.6) reaches 7.8 mas yr−1, a nearly 20-fold increase.
On the other hand, Fig. 10 shows the VSHs fitting results for different color bins. Unlike plots for magnitude, no significant color-dependence trend is found between CatWISE and Gaia astrometry. The VSH terms are basically consistent within 5σ in all color bins. The 5σ criterion is chosen because of the underestimated errors of positions and proper motions (and thus the fitting results). The errors for the terms are also underestimated considering the underestimated errors of positions and proper motions.
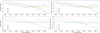 |
Fig. 9 First-degree VSHs-fit results with error bars for quasar matches in each magnitude bin. The left panel shows results for the coordinate and the right for proper motion. The brightest bin contains 20 000 sources, and each subsequent bin includes 20% more sources than the previous one to compensate for the increased coordinate and proper-motion errors at the faint end. |
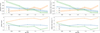 |
Fig. 10 Same as Fig. 9, but for color index (W1−W2). Each bin contains 50 000 sources, except for the last one, which has 30 437. |
6 Conclusions and discussion
6.1 Summary
Through cross-matching the CatWISE2020 catalog with Gaia DR3 and Gaia-CRF3, we analyzed the astrometric properties of common sources and evaluated the feasibility of establishing an infrared celestial reference frame. We found that the uncertainties of positions and proper motions of CatWISE2020 are underestimated by a factor of 1.5–2.5 for coordinates. The systematic errors on coordinates and proper motion are spatial- and magnitude-dependent. We used vector spherical harmonics to fit the differences for matched quasar and stars individually. Fitting for different magnitude bins exhibits strong magnitude dependence for the systematic errors, highlighting the need for magnitude-dependent systematic offset calibrations. On the contrary, no significant color dependence was found.
For the CatWISE2020 catalog, the typical uncertainties of about 100 mas in source positions and 20 mas yr−1 for proper motions are worse than that of the current celestial reference frames, the Gaia-CRF3 and ICRF3, and needs careful spatial- and magnitude-dependent systematic offset calibration. Nevertheless, it still represents the best infrared reference frame so far and shows a great improvement compared to AllWISE. It has more than twice as many sources as AllWISE and provides deeper and denser reference grids on the sky with more accurate astrometric parameters, especially for proper motions. After correcting for systematic errors with respect to the Gaia celestial reference frame, it can serve as an infrared realization of the International Celestial Reference System.
6.2 Discussion of the future infrared reference frame in the Gaia era
For the CatWISE2020 astrometry, the data were processed in the atlas tile footprint, which divides the inertial sky into 18 240 overlapping square tiles (Eisenhardt et al. 2020). The data reductions were carried out independently on each tile using the full-depth unWISE coaddition of exposures for astrometry and photometry (Schlafly et al. 2019). The astrometric parameters of sources on the exposures and tiles were derived using 2MASS point-source catalog as a reference (Skrutskie et al. 2006). To establish an infrared celestial reference frame compatible with the concept of the ICRS, systematic errors of CatWISE2020 positions with regard to Gaia catalog should be removed independently for each exposure. It means that all CatWISE2020 observations must be re-processed using the Gaia as a reference frame. This approach requires a huge amount of work and computational resources and will be considered in our future works.
In this study, we assumed that the CatWISE2020 catalog suffers a uniform global systematic errors with respect to Gaia; therefore, one can first estimate the global difference in the form of VSHs with common sources and then correct the positions and proper motions for all the CatWISE2020 sources. We thus have an infrared reference linked to Gaia astrometry, as done in the paper. This strategy cannot remove the tile-dependent systematics in the CatWISE2020 catalog, but it is more straightforward and computationally efficient. We note that relatively poor proper motions of CatWISE2020 will lead to a quick degradation of the frame; we suggest that Gaia proper motions should be applied to propagate positions to any epoch, but only for common sources. In the future, with improvement in the infrared astrometry, the positions and proper motions in the infrared band should be adopted directly in order to construct a self-consistent reference frame in corresponding wavelength and to conduct studies of the properties of multi-band positions and motions of sources, for example. This will also be helpful for our understanding of the internal global difference between the stellar reference frame and the reference frame of extragalactic sources discovered in this work. Finally, the construction of a high-precision infrared celestial reference frame with uncertainties comparable to Gaia-CRF3 and ICRF3 would require future space infrared sky-survey projects such as the GaiaNIR project proposed by ESA (Hobbs et al. 2021) and the Chinese CSST project (CSST Collaboration 2025; Yao et al. 2024).
Acknowledgements
This work is funded by the National Natural Science Foundation of China (NSFC) under grant no. 12373074. This publication makes use of data products from the Wide-field Infrared Survey Explorer, which is a joint project of the University of California, Los Angeles, and the Jet Propulsion Laboratory/California Institute of Technology, and NEOWISE, which is a project of the Jet Propulsion Laboratory/California Institute of Technology. WISE and NEOWISE are funded by the National Aeronautics and Space Administration. This work presents results from the European Space Agency (ESA) space mission Gaia. Gaia data are being processed by the Gaia Data Processing and Analysis Consortium (DPAC). Funding for the DPAC is provided by national institutions, in particular the institutions participating in the Gaia MultiLateral Agreement (MLA). The Gaia mission website is https://www.cosmos.esa.int/gaia. The Gaia archive website is https://archives.esac.esa.int/gaia. This research has made use of the VizieR catalog access tool, CDS, Strasbourg, France (DOI: 10.26093/cds/vizier). The original description of the VizieR service was published in Ochsenbein et al. (2000). Lastly, we are grateful to Prof. François Mignard for his insightful comments to improve the manuscript.
References
- Arias, E. F., Charlot, P., Feissel, M., & Lestrade, J. F. 1995, A&A, 303, 604 [NASA ADS] [Google Scholar]
- Charlot, P., Jacobs, C. S., Gordon, D., et al. 2020, A&A, 644, A159 [EDP Sciences] [Google Scholar]
- CSST Collaboration (Gong, Y., et al.) 2025, Introduction to the Chinese Space Station Survey Telescope (CSST) [Google Scholar]
- Cutri, R. M., Wright, E. L., Conrow, T., et al. 2013, Explanatory Supplement to the AllWISE Data Release Products [Google Scholar]
- Eisenhardt, P. R. M., Marocco, F., Fowler, J. W., et al. 2020, ApJS, 247, 69 [Google Scholar]
- Gaia Collaboration (Prusti, T., et al.) 2016, A&A, 595, A1 [NASA ADS] [CrossRef] [EDP Sciences] [Google Scholar]
- Gaia Collaboration (Brown, A. G. A., et al.) 2018, A&A, 616, A1 [NASA ADS] [CrossRef] [EDP Sciences] [Google Scholar]
- Gaia Collaboration (Klioner, S. A., et al.) 2022, A&A, 667, A148 [NASA ADS] [CrossRef] [EDP Sciences] [Google Scholar]
- Gaia Collaboration (Vallenari, A., et al.) 2023, A&A, 674, A1 [NASA ADS] [CrossRef] [EDP Sciences] [Google Scholar]
- Hobbs, D., Brown, A., Høg, E., et al. 2021, Exp. Astron., 51, 783 [NASA ADS] [CrossRef] [Google Scholar]
- Lindegren, L., Klioner, S. A., Hernández, J., et al. 2021, A&A, 649, A2 [EDP Sciences] [Google Scholar]
- Liu, J. C., Liu, N., Zhu, Z., et al. 2024, AJ, 168, 170 [Google Scholar]
- Mainzer, A., Bauer, J., Cutri, R. M., et al. 2014, ApJ, 792, 30 [Google Scholar]
- Marocco, F., Eisenhardt, P. R. M., Fowler, J. W., et al. 2021, ApJS, 253, 8 [Google Scholar]
- Marrese, P. M., Marinoni, S., Fabrizio, M., & Giuffrida, G. 2017, A&A, 607, A105 [NASA ADS] [CrossRef] [EDP Sciences] [Google Scholar]
- Mignard, F., & Klioner, S. 2012, A&A, 547, A59 [NASA ADS] [CrossRef] [EDP Sciences] [Google Scholar]
- Mignard, F., Klioner, S., Lindegren, L., et al. 2016, A&A, 595, A5 [NASA ADS] [CrossRef] [EDP Sciences] [Google Scholar]
- Ochsenbein, F., Bauer, P., & Marcout, J. 2000, A&AS, 143, 23 [NASA ADS] [CrossRef] [EDP Sciences] [Google Scholar]
- Pineau, F. X., Motch, C., Carrera, F., et al. 2011, A&A, 527, A126 [NASA ADS] [CrossRef] [EDP Sciences] [Google Scholar]
- Schlafly, E. F., Meisner, A. M., & Green, G. M. 2019, ApJS, 240, 30 [Google Scholar]
- Shi, Y. Y., Zhu, Z., Liu, N., et al. 2019, AJ, 157, 222 [NASA ADS] [CrossRef] [Google Scholar]
- Skrutskie, M. F., Cutri, R. M., Stiening, R., et al. 2006, AJ, 131, 1163 [NASA ADS] [CrossRef] [Google Scholar]
- Taylor, M. B. 2006, in Astronomical Society of the Pacific Conference Series, 351, Astronomical Data Analysis Software and Systems XV, eds. C. Gabriel, C. Arviset, D. Ponz, & S. Enrique, 666 [Google Scholar]
- Wright, E. L., Eisenhardt, P. R. M., Mainzer, A. K., et al. 2010, AJ, 140, 1868 [Google Scholar]
- Yao, J., Liu, J.-C., Liu, N., Zhu, Z., & Wang, Z.-W. 2024, Res. Astron. Astrophys., 24, 085011 [Google Scholar]
All Tables
Median values of position and proper-motion uncertainties for common stars and quasars.
Rotation and glide components for VSHs fit for proper-motion differences (unit: mas yr−1).
All Figures
|
Fig. 1 Sky density distribution of common QSOs and stars in the Gaia DR3 and the CatWISE2020 survey. The figure uses Mollweide projection in the equatorial coordinates, with α = δ = 0 at the left of the map, north up, and α increasing from left to right. The color shows the number of sources in each pixel. Pixels are divided using HEALPixel on the order of 6 (pixel size ≈0.84 deg2). |
| In the text | |
|
Fig. 2 Histograms of positional and proper-motion uncertainties given in CatWISE2020 for common sources. The vertical axes show the relative frequency of each bin. |
| In the text | |
|
Fig. 3 Histogram of CatWISE2020 W1 magnitude for common sources. The vertical axis shows relative frequency of each bin. |
| In the text | |
|
Fig. 4 CatWISE2020 positional uncertainty σpos versus CatWISE2020 W1 magnitude. The dots show the median values of σpos within each bin. |
| In the text | |
|
Fig. 5 Scatter plots for coordinate differences and corresponding histograms for matched pairs. Left and right show plots for quasars and stars, respectively. |
| In the text | |
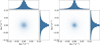 |
Fig. 6 Same as Fig. 5, but for proper-motion differences. |
| In the text | |
|
Fig. 7 Distribution of normalized astrometric parameters between Gaia DR3 and CatWISE2020 common quasars and stars. The upper panels show the distribution of normalized coordinate differences XΔα and XΔδ, as well as normalized the proper motion differences XΔμα and XΔμδ. The bottom panels show the normalized angular separation, XΔρ, and general proper-motion differences, XΔμ. |
| In the text | |
|
Fig. 8 Coordinate (left) and proper-motion (right) offsets between CatWISE2020 and Gaia DR3. The sky is divided into 192 equal area pixels (HEAlPixel on the order of 2). Each vector represents averaged offsets in the pixel. |
| In the text | |
|
Fig. 9 First-degree VSHs-fit results with error bars for quasar matches in each magnitude bin. The left panel shows results for the coordinate and the right for proper motion. The brightest bin contains 20 000 sources, and each subsequent bin includes 20% more sources than the previous one to compensate for the increased coordinate and proper-motion errors at the faint end. |
| In the text | |
|
Fig. 10 Same as Fig. 9, but for color index (W1−W2). Each bin contains 50 000 sources, except for the last one, which has 30 437. |
| In the text | |
Current usage metrics show cumulative count of Article Views (full-text article views including HTML views, PDF and ePub downloads, according to the available data) and Abstracts Views on Vision4Press platform.
Data correspond to usage on the plateform after 2015. The current usage metrics is available 48-96 hours after online publication and is updated daily on week days.
Initial download of the metrics may take a while.