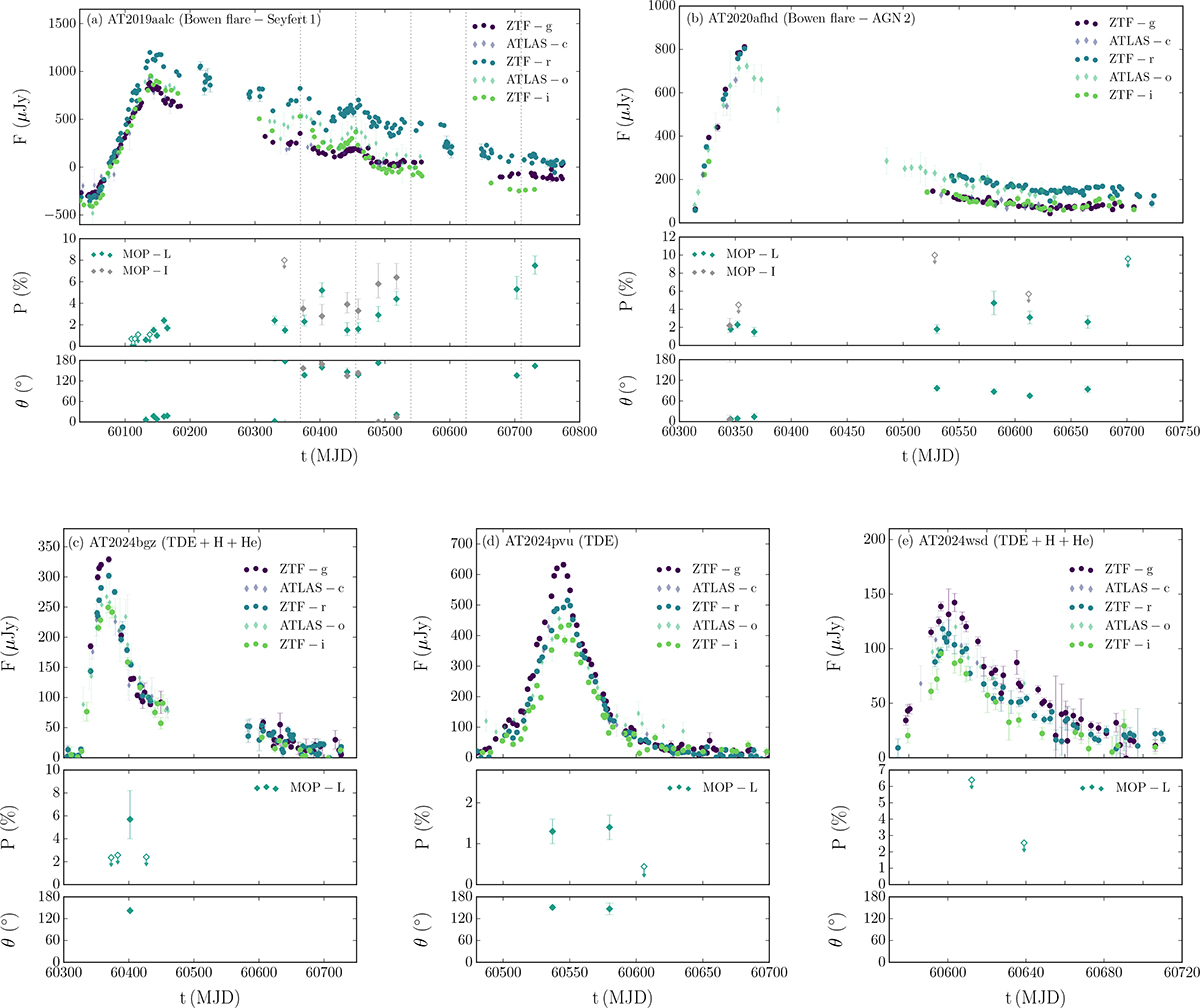
Fig. 1.
Download original image
ZTF and ATLAS (Tonry et al. 2018; Shingles et al. 2021) optical light curves of (a) AT2019aalc, (b) AT2020afhd, (c) AT2024bgz, (d) AT2024pvu, and (e) AT2024wsd, for filters ZTF g (420 − 540 nm), r (570 − 720 nm), and i (720 − 880 nm), and ATLAS c (420 − 650 nm) and o (560 − 820 nm). The ZTF data are binned into fixed time windows of 7 days in the observer rest frame. In the bottom panels, we show the MOPTOP polarisation in the MOP-L (400 − 700 nm) and MOP-I filters (700 − 1000 nm), corrected for Galactic ISM and the host galaxy. Note that the polarisation angle θ = 0° is equivalent to θ = 180° and that epochs with Pobs/σP < 3 are treated as 2σ upper limits (empty markers). For these the polarisation angles are not shown (see them in Table A.3). For AT2019aalc the vertical dotted black lines correspond to the flux maxima of the QPOs; see details in Section 5.1.3.
Current usage metrics show cumulative count of Article Views (full-text article views including HTML views, PDF and ePub downloads, according to the available data) and Abstracts Views on Vision4Press platform.
Data correspond to usage on the plateform after 2015. The current usage metrics is available 48-96 hours after online publication and is updated daily on week days.
Initial download of the metrics may take a while.