| Issue |
A&A
Volume 704, December 2025
|
|
|---|---|---|
| Article Number | A250 | |
| Number of page(s) | 19 | |
| Section | Astrophysical processes | |
| DOI | https://doi.org/10.1051/0004-6361/202556305 | |
| Published online | 12 December 2025 | |
Optical polarisation of stellar-fed active and quiescent supermassive black holes
1
Ruhr University Bochum, Faculty of Physics and Astronomy, Astronomical Institute (AIRUB), Universitätsstraße 150, 44801 Bochum, Germany
2
Department of Astronomy and Astrophysics, University of California, Santa Cruz, CA 95064, USA
3
DARK, Niels Bohr Institute, University of Copenhagen, Jagtvej 128, DK-2200 Copenhagen, Denmark
4
European Space Agency, European Space Astronomy Centre, E-28692 Villanueva de la Cañada, Madrid, Spain
5
Department of Astronomy, University of Maryland, College Park, MD 20742, USA
6
Joint Space-Science Institute, University of Maryland, College Park, MD 20742, USA
7
Astrophysics Science Division, NASA Goddard Space Flight Center, Mail Code 661, Greenbelt, MD 20771, USA
★ Corresponding author: This email address is being protected from spambots. You need JavaScript enabled to view it.
Received:
8
July
2025
Accepted:
1
October
2025
Abstract
Context. The advent of wide-field optical surveys with multi-wavelength capabilities has been a breakthrough in the detection and characterisation of bright, long-lasting optical flares from supermassive black holes, such as tidal disruption events (TDEs), Bowen flares in active galactic nuclei (AGNs), and changing-look AGNs. Yet, the physical mechanisms powering these diverse transient events remain highly debated.
Aims. We aim to provide novel model constraints by utilising broadband optical polarimetry to study five TDEs. Our goal is to enhance the understanding of the reprocessing material involved in TDEs and to compare our findings with similar flaring activity observed in AGNs.
Methods. Using the MOPTOP polarimeter on the 2 metre Liverpool Telescope, we conducted a monitoring campaign targeting three optically discovered TDEs (AT2024bgz, AT2024pvu, and AT2024wsd) and two Bowen flares in AGNs (AT2020afhd and AT2019aalc).
Results. The three thermal TDEs show low intrinsic polarisation levels (ΔP ≈ 0 − 6%) with stable polarisation angles. The Bowen flares also show variable polarisation degrees (ΔP ≈ 0 − 8%) but significant polarisation angle variability: AT2020afhd exhibited a Δθ = 83 ± 8° shift at 150 days post-optical peak, while the AT2019aalc displayed quasi-periodic swings of Δθ ≈ 40° amplitude starting 190 days after peak brightness.
Conclusions. The TDEs of this study are well described by models invoking rapid disk formation and reprocessed emission from optically thick outflows, whereas the Bowen flares reveal more complex reprocessing geometries, potentially consistent with TDEs occurring in AGN gas-rich environments. We find that moderate polarisation is observed at later times for TDEs with low-Eddington ratios and highly extended photospheres. This implies that, as the accretion level declines, we expect more asymmetric reprocessing layers along a given viewing angle. Since the outflow density and velocity depend sensitively on the inclination angle, we expect TDEs with low-Eddington ratios and highly extended photospheres to exhibit varying levels of polarisation. The polarisation of AT2019aalc (Seyfert 1) hints at a clumpy, asymmetric outflow and the presence of a tilted, precessing accretion disk, while the polarisation of AT2020afhd (AGN type 2) is consistent with the detection of a scattered light echo.
Key words: black hole physics / polarization / galaxies: active / galaxies: nuclei / galaxies: Seyfert
© The Authors 2025
 Open Access article, published by EDP Sciences, under the terms of the Creative Commons Attribution License (https://creativecommons.org/licenses/by/4.0), which permits unrestricted use, distribution, and reproduction in any medium, provided the original work is properly cited.
This article is published in open access under the Subscribe to Open model. This email address is being protected from spambots. You need JavaScript enabled to view it. to support open access publication.
1. Introduction
The continuous scan of the sky across wavelengths (e.g. ROSAT; Voges et al. 1999, eROSITA; Predehl et al. 2021, Catalina Real-Time Transient Survey; Drake et al. 2009, All-Sky Automated Survey for Supernovae; Kochanek et al. 2017, Zwicky Transient Facility (ZTF); Bellm et al. 2019, Wide-field Infrared Survey Explorer; Wright et al. 2010; Mainzer et al. 2011, and Very Large Array Sky Survey; Lacy et al. 2020) has enabled the detection of nuclear transients, lasting from months to years. The detection of these flares has highlighted the presence of accretion-powered events in a population of previously dormant supermassive black holes (SMBHs), adding to extreme flaring activity populations that are uncommonly seen in nearby active galactic nuclei (AGNs). Whilst the presence of an accretion disk in AGNs can in principle account for such activity (e.g. Moriya et al. 2017; Yan et al. 2019; Trakhtenbrot et al. 2019a,b; Dodd et al. 2025), flaring activity from quiescent SMBHs is thought to mainly arise from tidal disruption events (TDEs; e.g. Rees 1988; van Velzen et al. 2011; De Colle et al. 2012; Guillochon & Ramirez-Ruiz 2013; Komossa 2015; Stone & Metzger 2016; Dai et al. 2018; Gezari 2021).
In the dense stellar clusters of galactic nuclei, gravitational interactions among stars are common, placing stars into highly eccentric orbits and leading to possible stellar encounters with the SMBH (Alexander 2017). When the orbit of a (main-sequence) star crosses the tidal radius of an SMBH (≲108 M⊙), the star is ripped apart (e.g. Hills 1975; Frank 1978), producing streams of bound and unbound debris (Rees 1988). In a full disruption, about half of the stellar-debris mass remains bound to the SMBH and might circularise to form an accretion disk (e.g. Ramirez-Ruiz & Rosswog 2009; Guillochon et al. 2014; Shiokawa et al. 2015; Guillochon & Ramirez-Ruiz 2015; Hayasaki et al. 2016). This accretion disk was initially predicted to emit in the extreme ultraviolet (EUV) and soft X-rays (e.g. Rees 1988).
Whilst the first TDE candidates were discovered in the X-ray regime with ROSAT (e.g. Bade et al. 1996; Komossa & Bade 1999), they are now being detected in larger numbers by dedicated wide-field optical surveys, such as the ZTF – with advances in the classification algorithms contributing to a discovery rate1 of ≈30 TDEs year−1 (Stein et al. 2024a). However, the thermal properties observed during the first months of these events, coupled with numerous X-ray non-detections, overall X-ray faintness (LX/Lopt < 1), and delayed X-ray emission, challenge the conventional picture of a newly formed, compact accretion disk (e.g. Gezari et al. 2009; van Velzen et al. 2011, 2019; Jonker et al. 2020; Liu et al. 2022). One possibility is that, with efficient circularisation of the stellar debris, the UV and optical emission results from the reprocessing of the inner disk’s X-rays and EUV by optically thick stellar debris, disk outflows (Loeb & Ulmer 1997; Strubbe & Quataert 2009; Guillochon et al. 2014; Miller 2015; Roth et al. 2016; Metzger & Stone 2016; Dai et al. 2018), or wide-angle outflow expected from stream collisions (Lu & Bonnerot 2020; Bonnerot et al. 2021). Alternatively, the early UV and optical emission may be powered by shocks at the self-intersection of debris streams during their circularisation into an accretion disk (Piran et al. 2015; Jiang et al. 2016; Bonnerot et al. 2017).
Polarisation has proven to be a useful tool for constraining the geometry and emission mechanisms of nuclear accretion flares. Tidal disruption events have shown high degrees of polarisation from synchrotron radiation emitted in stellar stream shocks (ΔP ≈ 8 − 28%; Liodakis et al. 2023), as well as low-to-moderate polarisation levels in decelerating shocks of relativistic jetted outflows (ΔP ≈ 0 − 8%; Wiersema et al. 2012, 2020). Thermal emission from TDEs has also exhibited mild polarisation levels (ΔP ≈ 0 − 6%), attributed to electron scattering within the reprocessing layers of the accretion disk, winds, or outflows (Patra et al. 2022; Leloudas et al. 2022; Charalampopoulos et al. 2023; Koljonen et al. 2024). In these thermal cases, the polarisation degree is sensitive to the geometry and optical depth of the reprocessing layer, the clumpiness of the material, the accretion rate, and the viewing angle (Roth et al. 2016; Dai et al. 2018; Thomsen et al. 2022).
Here, we present the polarisation time series of five optically bright TDE candidates, including two Bowen flares (BFs) in AGNs. Such flares have long-lasting TDE-like UV and optical emission, with emission lines typical of unobscured AGNs. However, they also show broad Bowen fluorescence emission lines (O III λ3133, N III λ4640, and He II λ4686) that are very rare in AGNs (Schachter et al. 1990). These emission lines are thought to arise from fast, high-density gas that is rich in metals near the accreting SMBH; they have been proposed to be either due to bright-UV transient emission ionising the broad-line region or a newly launched outflow (Trakhtenbrot et al. 2019b). Comparing our polarimetric results with previous measurements, we aim to constrain the emitting mechanisms of these five nuclear accretion flares. Additionally, we seek to determine whether BFs are stellar-fed SMBHs (i.e. TDEs) or enhanced accretion in AGNs (e.g. an unknown form of AGN instability).
This paper is organised as follows. In Section 2 we describe the polarimetric sample, observations, and data reduction procedures (see Appendix A for more details). The results of our polarisation measurements are presented in Section 3. In Sections 4 and 5, we discuss the implications of the polarisation time series for the three thermal TDEs and two BFs, respectively. Finally, we summarise our main conclusions in Section 6. Throughout this work, we adopt a flat Lambda cold dark matter (ΛCDM) cosmology with Ωm = 0.32, ΩΛ = 0.68, and H0 = 67 km s−1 Mpc−1 (Planck Collaboration VI 2020).
2. Sample, observations, and data reduction
2.1. Sample selection
The TDE candidates were selected based on their estimated peak brightness (r < 18.5 mag) to enable precise polarisation measurements with the Multicolour OPTimised Optical Polarimeter (MOPTOP), and on their visibility from the Liverpool Telescope for a minimum duration of one month. The selected events are AT2024bgz (with redshift z = 0.0585; Godson et al. 2024b), AT2024pvu (z = 0.0488; Stein et al. 2024b), AT2024wsd (z = 0.063; Stein et al. 2024c), AT2020afhd (z = 0.027; Arcavi et al. 2024), and the second flaring episode of AT2019aalc (z = 0.0356; Veres et al. 2024). The AT2019aalc is hosted by a Seyfert type-1 AGN galaxy (Toba et al. 2014), AT2020afhd by an AGN type 2 (Chen et al. 2022). They are both classified as Bowen fluorescence flares (Veres et al. 2024; Arcavi et al. 2024).
2.2. Observations
The MOPTOP is the fourth generation polarimeter at the 2 metre fully autonomous Liverpool Telescope (Steele 2004; Shrestha et al. 2020), located at Roque de Los Muchachos Observatory (La Palma, Spain). In the MOPTOP instrumental configuration, the light beam goes through a continuously rotating half-wave plate and a wire-grid polarising beamsplitter, which splits the light beam into two orthogonal polarising states (e.g. 0° and 90°) that are simultaneously recorded by two identical complementary metal-oxide-semiconductor (CMOS) sensors. Each time that the half-wave plate is rotated by 22.5°, the light beam’s polarisation angle changes by 45°, and the modulated intensity is recorded by the CMOS. A complete rotation of the half-wave plate has 16 steps, which yields a total of 16 images per CMOS.
The MOPTOP allows filtered observations across optical and near-infrared bands. To maximise the signal-to-noise ratio of the TDEs, we used the broadband MOPTOP filter (MOP-L) covering 400 − 700 nm. Given the brightness of AT2019aalc and AT2020afhd, we also used the MOP-I filter to cover the near-infrared (695 − 950 nm) for these sources. The MOPTOP half-wave plate has two rotor speed options: an exposure time of 0.4 s or 4 s per frame. To minimise the readout noise, we used an exposure time of 4 s per image. In this way, the polarisation degree and angle of the target were measured every 8 seconds. Observations of the five TDE candidates were scheduled through the Liverpool Telescope user interface phase2UI2. They were automatically dispatched by the Liverpool Telescope autonomous scheduler under good observing conditions; that is, we placed observing constraints on the seeing (< 2″) as well as the Moon’s phase and distance (see Table A.1). The targets were observed for Nrot full rotations of the half-wave plate, with Nrot adjusted depending on the faintness of the TDE candidate (see Table A.1).
2.3. Data reduction
The data were automatically processed using the Liverpool Telescope reduction pipeline, which corrects for bias, darks, and flats, and subsequently retrieved from the Liverpool Telescope archive. With MOPTOP, polarisation is measured by extracting the counts of a source at each image. Then, from the relative intensities across the different positions of the half-wave plate, one derives the Stokes parameters (q, u). Instead of measuring the polarisation directly from the default 4 s frames, we improved the signal-to-noise ratio of the target by stacking frames. We aligned and then combined the frames to improve the target’s point-spread function profile (see Appendix A.1). We used the Astropy Photutils package to compute the source counts with aperture photometry (Bradley et al. 2016). From source counts, we followed the procedure of Shrestha et al. (2020) to normalise the two detector arrays, and we derived the Stokes q and u. We corrected the Stokes parameters for instrumental polarisation and depolarisation using standard stars (see Appendix A.2). The confidence levels of the Stokes parameters (q, u) and polarisation degree (P) and angle (θ) were derived from a Monte Carlo error propagation, starting from 106 simulated count values per half-wave plate position and CMOS (see e.g. Jordana-Mitjans et al. 2021). The polarisation degree  is biased to higher values in the low signal-to-noise ratio regime (Simmons & Stewart 1985). Consequently, the polarisation degree was corrected using the maximum probability estimator P = (Pobs − σP2/Pobs) from Wang et al. (1997), where
  is the 1σ uncertainty in Pobs.
3. Results
After correcting for instrumental effects (see Appendix A.2), we detail here the subsequent corrections applied to recover the intrinsic polarisation of the five transients. In particular we remove the contributions from the Galactic interstellar medium (ISM) and from the host galaxies, as detailed below.
3.1. ISM dust-induced polarisation
The long axes of dust grains align perpendicularly to the local magnetic field and absorb light more efficiently along their longer axes through dichroic extinction (e.g. Serkowski et al. 1975; Whittet 2004). As a result, when light passes through the ISM, the transmitted light becomes polarised, and the polarisation angle of the dichroic extinction traces the orientation of the local magnetic field. This effect is wavelength-dependent, determined by both the dust grain distribution and the efficiency of the alignment. For extragalactic targets, the Galactic dust can induce significant levels of polarisation in lines of sight affected by extinction.
To correct for that, we measured the polarisation of bright stars (< 14.4 mag) within the MOPTOP field of view (7′×7′) as a proxy for the polarisation contribution from Galactic dust birefringence in each target line of sight (see Table A.2). Following this, we checked whether our Galactic foreground estimates are compatible with those predicted by the Serkowski law (Serkowski et al. 1975; Whittet et al. 1992), in which the polarisation degree follows Pserk = P0, serkexp[ − Kln2(λmax/λ)]. Here, the λmax(μm) = RV/5.5 is the wavelength at which the polarisation is maximum, RV = 3.1 is the Galactic ratio of visual extinction to reddening, and K = (0.01 ± 0.05)+(1.66 ± 0.09)λmax is a constant. Given the low column densities of Galactic hydrogen in the targets’ lines of sight (NH < 5 × 1020 cm−2), the upper limit on the polarisation degree is P0, serk ≲ 13% E(B − V)MW (Planck Collaboration XII 2020), where E(B − V)MW is the Galactic reddening (Willingale et al. 2013). As shown in Table A.2, both the stellar measurements and the reddening-based upper limits are in good agreement. We then subtracted the Galactic dust-induced polarisation from the measured polarisation as (q, u)TDE + host = (q, u)−(q, u)MW. The corrected polarisation measurements are presented in Table A.3.
3.2. Host galaxy depolarisation
After correcting for Galactic ISM, the polarisation of the five nuclear transients still included a significant contribution of background photons from the host galaxy (i.e. 45 − 65% at peak time), which depolarises the overall measurement. Therefore, we further corrected the polarisation by flux-weighting the host and transient polarisation as (q, u)TDE = ((q, u)TDE + host − (1 − CF)(q, u)host)/CF, where CF = FTDE/(FTDE + Fhost) is the ratio between the TDE flux and the total measured flux, which includes the galaxy host. We extracted the MOPTOP photometry of the transients, using a fixed full width at half maximum (FWHM) for the photometric aperture, including the host galaxy’s flux; hence, Fhost is constant across observations. To measure the coefficient CF for each polarimetric data point, we used pre-flare photometric data from the ZTF survey (Bellm et al. 2019). To cover the spectral range of the MOPTOP filters, we used a weighted average of ZTF g and r filters for MOP-L observations and the ZTF i filter for MOP-I observations.
The polarisation degrees of AT2024bgz and AT2024wsd were consistent with zero in the final observing epoch; therefore, we computed the intrinsic polarisation of AT2024bgz and AT2024wsd, solely assuming starlight dilution in their host galaxies (Phost ≈ 0%), such that PTDE = PTDE + host/CF (e.g. Leloudas et al. 2022; Liodakis et al. 2023). We note that future polarimetric campaigns would benefit from direct measurements of the host q, u to ensure a more precise correction. For AT2024pvu we could not assume an unpolarised host, since in the latest polarimetric epoch (when the TDE contributed only 6% of the total flux) the measured polarisation was still non-zero, indicating that the host galaxy itself is polarised (Phost ≈ 0.6%). Non-negligible polarisation degrees in quiescent galaxies have been attributed to dichroic absorption of aligned dust grains (Brindle et al. 1991). Therefore, we subtracted the host baseline as a flux-weighted vector component from the total polarisation of AT2024pvu.
Initially, AT2019aalc showed a low polarisation degree (P < 0.2% at 2σ), which is consistent with a near-polar viewing angle of a Seyfert type-1 galaxy (Marin et al. 2012; Marin 2014; Toba et al. 2014). Consequently, we estimated the flare intrinsic polarisation by assuming that the host and AGN emission were unpolarised (Phost ≈ 0%; Marin 2018). Given that the AGN continuum decreased ≈0.2 mag after the first flare, we adopted 59500 − 60050 modified julian date (MJD) as the average reference epoch to calculate the baseline flux. In contrast, AT2020afhd is hosted by an AGN type 2 and meets the classification criteria for both a Seyfert 2 galaxy and a type-2 low-ionisation nuclear emission-line region (LINER; Chen et al. 2022). Initially, AT2020afhd exhibited a higher polarisation degree than AT2019aalc (P ≈ 1.5%), in line with what is expected from a type-2 AGN viewed by a mid-latitude observer (Marin 2014). To estimate the host and AGN polarisation correction, we used the epoch when the flare accounted for only 8% of the total MOP-I band flux as a reference, adopting a host polarisation of Phost ≈ 1.0%.
3.3. Intrinsic polarisation
In Figure 1 and Table A.3, we present the results corresponding to the intrinsic polarisation of the five nuclear transients, which includes some Pobs/σP < 3 detections of polarisation. The AT2024bgz, AT2024wsd, and AT2024pvu were intrinsically polarised at ΔP ≈ 0 − 6% level, with higher polarisation levels detected within the first 40 days after optical-peak brightness. After that, the polarisation degree is consistent with zero. The polarisation angle is constant within 1σ, consistent with an axisymmetric geometry. AT2019aalc and AT2020afhd show variable polarisation levels in the range of ΔP ≈ 0 − 8%. The polarisation degree of AT2019aalc initially increased from being consistent with P ≈ 0% at 30 days before the peak to P ≈ 2% at 25 days after the optical peak, with an average polarisation angle of the Pobs/σP > 3 detections of θ ≈ 12°. From 190 days post-peak, the polarisation degree and angle in both MOPTOP filters showed variability modulated by the optical rebrightenings, with amplitudes of ΔP ≈ 5% and Δθ ≈ 40°; see Sections 5.1.3 and 5.2.2. The time-series data of AT2020afhd exhibited a variable polarisation degree at the ΔP ≈ 0 − 8% level. Additionally, a striking rotation of the polarisation angle by Δθ = 83 ± 8° was observed at ≈150 days after optical peak brightness.
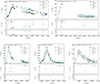 |
Fig. 1. ZTF and ATLAS (Tonry et al. 2018; Shingles et al. 2021) optical light curves of (a) AT2019aalc, (b) AT2020afhd, (c) AT2024bgz, (d) AT2024pvu, and (e) AT2024wsd, for filters ZTF g (420 − 540 nm), r (570 − 720 nm), and i (720 − 880 nm), and ATLAS c (420 − 650 nm) and o (560 − 820 nm). The ZTF data are binned into fixed time windows of 7 days in the observer rest frame. In the bottom panels, we show the MOPTOP polarisation in the MOP-L (400 − 700 nm) and MOP-I filters (700 − 1000 nm), corrected for Galactic ISM and the host galaxy. Note that the polarisation angle θ = 0° is equivalent to θ = 180° and that epochs with Pobs/σP < 3 are treated as 2σ upper limits (empty markers). For these the polarisation angles are not shown (see them in Table A.3). For AT2019aalc the vertical dotted black lines correspond to the flux maxima of the QPOs; see details in Section 5.1.3. |
4. Classical TDEs: AT2024bgz, AT2024pvu, and AT2024wsd
Here, we discuss the properties of the optical polarisation of AT2024bgz, AT2024pvu, and AT2024wsd in terms of thermal TDEs from quiescent SMBHs. Additionally, we compare them with the time-series polarisation data of other TDEs.
4.1. Spectral properties of thermal TDEs
Thermal TDEs show a fast increase in UV and optical flux, high luminosities and temperatures (Mockler & Ramirez-Ruiz 2021), and large blackbody radii, which distinguishes them from typical AGN variability and other transients (van Velzen et al. 2011, 2021a; Arcavi et al. 2014; Hung et al. 2018; Auchettl et al. 2018; Mockler et al. 2019). Using ZTF forced photometry3 (see Figure 2), we found that AT2024bgz, AT2024pvu, and AT2024wsd are consistent with TDE typical luminosities (Mr ≈ −19.5; Hammerstein et al. 2023), a blue continuum (g0 − r0 ≈ −0.2), little colour evolution over months (δ(g0 − r0) < 0.006 mag day−1; Yao et al. 2023), and typical spectral classes. That is, the optical spectra of most thermal TDEs show very broad emission lines that become narrower and fainter with time (FWHM ≈ 104 km s−1; Komossa 2015; Gezari 2021). Most TDEs show a very pronounced broad helium emission line (He II λ4686), a feature that sets them apart from other transients (e.g. Gezari et al. 2012). Tidal disruption events with only this characteristic spectral feature visible are usually classified into the TDE-He spectral class (e.g. van Velzen et al. 2020). Other TDE spectral classes include TDEs with only Hα and Hβ hydrogen emission lines (i.e. the TDE-H class), TDEs with both helium and hydrogen emission lines (TDE-H+He), and TDEs with featureless spectra. In this context, the spectra of AT2024wsd4 and AT2024bgz5 show broad Hα and He II emission, with AT2024wsd also displaying Hβ – features typical of the TDE-H+He spectral class (Godson et al. 2024a; Stein et al. 2024c). In contrast, AT2024pvu exhibits TDE-like continuum without detectable broad emission lines6 (Stein et al. 2024b).
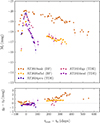 |
Fig. 2. ZTF r-band light curves of the TDE candidates analysed in this work, binned to 7 days in the rest frame and time-shifted to optical peak brightness (t0). The absolute magnitudes are calculated as Mr = mr − 5log10(d/10)−K(z)−Ar, where mr is the apparent magnitude, d is the luminosity distance in parsecs, Ar accounts for Galactic extinction. We assume a uniform K-correction: K = 2.5log10(1 + z). Bottom panel: Colour evolution corrected for Galactic extinction and host galaxy contribution. |
The TDEs-H+He class have lower rest-frame luminosities but higher intrinsic disruption rates compared to the rest (van Velzen et al. 2021b; Nicholl et al. 2022). To date, most thermal TDEs with available polarimetric observations belong to this H+He class (van Velzen et al. 2021b; Nicholl et al. 2022; Hammerstein et al. 2023), including AT2018dyb, AT2019dsg, AT2019azh, AT2019qiz, and AT2020mot (Lee et al. 2020; Leloudas et al. 2022; Patra et al. 2022; Liodakis et al. 2023). This class has shown clear signatures of Bowen fluorescence lines (i.e. O III and N III; Blagorodnova et al. 2019; van Velzen et al. 2021b; Hammerstein et al. 2023) indicating the presence of high-density, high-velocity gas outflows near the SMBH. The relatively small photospheric radii inferred for these events have been proposed to explain the high densities required for efficient Bowen fluorescence and suggested that TDEs-H+He could be due to the disruption of low-mass stars (van Velzen et al. 2021b). Alternatively, these high densities could be achieved by the rapid formation of an accretion disk, driven by stellar debris streams intersecting close to the SMBH in deep encounters (Nicholl et al. 2022). Using MOSFiT, we modelled the ZTF light curves of AT2024bgz and AT2024wsd (Guillochon et al. 2018; Mockler et al. 2019). We find that both TDEs are well explained by small photospheric radii and deep encounters of low-mass stars (≈0.3 M⊙) with ≈3 × 10⁶ M⊙ SMBHs (see Table A.4). We note that, so far, only AT2020mot has shown polarimetric evidence of shock-powered emission (Liodakis et al. 2023). Our MOSFiT modelling of AT2020mot returned a photospheric radius comparable to other TDEs-H+He and suggested a shallow encounter of a Sun-mass star with a ≈107 M⊙ SMBH (see Table A.4 and Fig. A.6). Finally, our modelling of the featureless TDE AT2024pvu indicates a photosphere at least an order of magnitude larger than that of TDEs-H-He at explosion time, consistent with a Sun-mass star tidally disrupted by a ≈2 × 10⁷ M⊙ SMBH.
4.2. TDE optical emission from reprocessing vs shocks
The polarisation time series of AT2024bgz, AT2024pvu, and AT2024wsd closely resemble those of AT2019dsg and AT2018dyb (Lee et al. 2020; Leloudas et al. 2022), exhibiting a constant polarisation angle and mild levels of polarisation degree, with an eventual decrease to negligible values at late times (see Figure 3). This behaviour is consistent with emission dominated by reprocessing in an optically thick medium (Roth et al. 2016), rather than shocks in colliding stellar streams, which have been proposed to explain the higher polarisation levels and variability in the polarisation angle observed in AT2020mot (ΔP ≈ 8 − 28%, Δθ ≈ 30°; Liodakis et al. 2023).
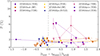 |
Fig. 3. Rest-frame polarisation measurements of thermal TDEs (Patra et al. 2022; Leloudas et al. 2022), BFs, and the extreme coronal line emitter AT2022fpx (Koljonen et al. 2024). Time is scaled by each event’s rise time to peak bolometric luminosity to remove the primary timing dependencies on SMBH and stellar mass (i.e. |
In a reprocessing scenario, Leloudas et al. (2022) proposed that the polarisation signatures of AT2019dsg7 and AT2018dyb were due to the rapid circularisation of an initially non-axisymmetric accretion disk. Using the super-Eddington accretion model of Dai et al. (2018), where an optically, geometrically thick disk and outflows reprocess the X-ray emission from the inner accretion disk, polarisation can reach up to P ≈ 6% for edge-on views of high-mass extended disks. In this model, the decline in polarisation degree with time is driven by a decreasing fallback rate, leading to a drop in the disk mass and, consequently, a reduction in the electron scattering opacity. Alternatively, Charalampopoulos et al. (2023) proposed that the diverse behaviour of polarisation in TDEs (including the increasing polarisation degree of AT2019qiz; Patra et al. 2022) could arise from the reprocessing of a wide-angle outflow generated by the collision at the self-intersection of the returning debris streams (Lu & Bonnerot 2020). Owing to its higher degree of asymmetry, this lower mass and more confined outflow can produce polarisation degrees up to P ≈ 11% for intermediate viewing angles. The early high-density outflow would result in multiple electron scatterings, leading to almost unpolarised emission, as directional information is likely to be lost. As the optical depth decreases, non-zero polarisation emerges, influenced primarily by the mass outflow rate, geometry, and viewing angle. Eventually, as the ejecta become very optically thin, photons escape without further scattering, causing the polarisation to disappear.
Figures 4 and 5 show that moderate polarisation occurs at later times for nuclear transients with low Eddington ratios and highly extended photospheres. This suggests, as we argue, that as the level of accretion decreases, we can expect to see more asymmetric reprocessing layers from different viewing angles (Thomsen et al. 2022). Since the density and velocity of the outflow are highly dependent on the inclination angle (Dai et al. 2018), TDEs with low Eddington ratios and highly extended photospheres are likely to show varying levels of polarisation (Figures 4 and 5).
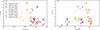 |
Fig. 4. Polarisation measurements of thermal TDEs, BFs and the extreme coronal line emitter AT2022fpx as a function of (a) the Eddington-scaled blackbody luminosity and (b) photospheric radius scaled by gravitational radius. Both were evaluated at the time of the polarimetric observations using MOSFiT blackbody fits to ZTF photometry. |
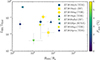 |
Fig. 5. Eddington-scaled blackbody luminosity of thermal TDEs, BFs, and the extreme coronal line emitter AT2022fpx as a function of photospheric radius normalised by gravitational radius. Both were evaluated at the time of the maximum polarisation (Pmax) of each event. The marker colour indicates the maximum polarisation degree measured for each event. |
In this context, the initial low polarisation degree of the AT2024pvu (P ≈ 1.3%) and its subsequent decline are consistent with several reprocessing scenarios: outflows from an extended low-mass (high-mass) disk viewed nearly edge-on (face-on; Leloudas et al. 2022), and a low-mass outflow produced by the self-intersection of stellar debris (Charalampopoulos et al. 2023). The polarisation measurements of the TDE-H+He AT2024wsd were acquired during an optically thin regime (see Figure 3) and are also consistent with reprocessing by outflows originating from either the accretion disk itself or the self-intersecting stellar streams. For the TDE-H+He AT2024bgz, a low polarisation level (P ≈ 0.9%) was measured near the peak of the optical light curve during the receding phase of the photosphere and in an already optically thin regime (see Figure 3). A 2σ increase to P ≈ 6% about 30 days later hints at an asymmetry in the inner photospheric layers, supporting the model proposed by Thomsen et al. (2022). Overall, the mild polarisation levels and stable polarisation angles of the three TDEs support reprocessing frameworks involving either disk-driven outflows (Leloudas et al. 2022) or collision-induced outflows (Charalampopoulos et al. 2023). Among the seven thermal-dominated TDEs with time-series polarisation data – AT2018dyb, AT2019qiz, AT2019dsg, AT2020mot, and the three TDEs presented here –, we note that only AT2020mot exhibits polarisation signatures attributed to a shock-powered, non-thermal component (Liodakis et al. 2023).
5. Bowen flares: AT2019aalc and AT2020afhd
In Section 5.1 we discuss the origin of the two BFs, AT2019aalc and AT2020afhd. In Section 5.2 we present their polarisation time series.
5.1. Bowen flares as stellar-fed SMBHs
Bowen flares, such as AT2019aalc (Veres et al. 2024; Śniegowska et al. 2025) and AT2020afhd (Arcavi et al. 2024), are TDE-like outbursts of intense UV and optical emission that have been detected in AGNs. Bowen flares share spectral properties with AGNs and TDEs (Trakhtenbrot et al. 2019b): they display emission lines that are typical of unobscured AGNs, as well as distinct Bowen emission lines that are persistent across flaring times (i.e. He II λ4686, N III λ4640, and O III λ3133). Bowen fluorescence emission lines are very rare in AGNs (Schachter et al. 1990) and, although generally broader, they have been detected in some TDEs of the TDE-H+He spectral class (e.g. Blagorodnova et al. 2019; Hammerstein et al. 2023). Bowen fluorescence requires strong EUV emission to initiate a resonance cascade with He II Ly-α that ionises the high-density metal-rich material (oxygen and nitrogen; Bowen 1934, 1935) in the vicinity of the SMBH. This suggests a similar mechanism driving TDEs and BFs, which does not get triggered during regular AGN activity.
5.1.1. Recurring outbursts from partial TDEs
Bowen flares have been proposed as a new form of AGN activity (Trakhtenbrot et al. 2019b). However, we argue that the recurrence of these flares strongly favours a repeating partial TDE scenario (MacLeod et al. 2013; Liu et al. 2023, 2025; Bandopadhyay et al. 2024) rather than stochastic (e.g. Kelly et al. 2009; MacLeod et al. 2010) or extreme AGN variability (Trakhtenbrot et al. 2019a). That is, AT2019aalc exhibited two flares, separated by 4.1 years, with a consistent spectral and temporal profile across cycles (see Figures 6 and 7a). Using Bayesian blocks on the ZTF r-band light curve (Scargle et al. 2013; Liu et al. 2025), we also identified a 30σ emission excess about 3.4 years before the main flare of AT2020afhd (see Figure 7). The second flare of AT2019aalc and AT2020afhd was approximately 2 and 36 times brighter than the first, respectively. This behaviour is consistent with a low-mass star being tidally heated and gradually stripped of mass over multiple passages around the SMBH – initially producing weak flares that exponentially intensify in the final encounters before complete disruption (Liu et al. 2025).
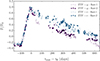 |
Fig. 6. Rest-frame ZTF g and r light curves of the two flares of AT2019aalc, binned to 1 day, time-shifted to the optical peak (t0), and normalized to their respective peak fluxes (F0). |
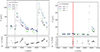 |
Fig. 7. ZTF light curves of the repeating (a) AT2019aalc and (b) AT2020afhd, binned to 14 days. Bottom panel: Colour evolution corrected for Galactic extinction and host galaxy contributions. For (a) AT2019aalc the shaded grey regions indicate light curve segments corresponding to flux dips before the flares identified by Bayesian blocks at significance levels of 34σ (first) and 8σ (second). For (b) AT2020afhd the 30σ flux excess is shown in red. |
MOSFiT modelling of AT2019aalc and AT2020afhd suggests that they are TDEs of low-mass stars, with a mass ≈0.2 M⊙ during the last passages (see Table A.4). The compact photospheres of the two BFs and ≈7 × 10⁶ M⊙ SMBHs are consistent with the average properties of the TDE-H+He spectral class (Hammerstein et al. 2023). For AT2019aalc we find that the viscous timescales of both flares are surprisingly long (≈70 days), which bottlenecks fallback accretion and results in an optical light curve with a shallower decay and flatter peak (see Figure 2; Guillochon & Ramirez-Ruiz 2015; Mockler et al. 2019). The viscous delay of AT2019aalc is consistent with the timescales of a flux reduction in the optical bands that occur before each flare. That is, the Bayesian blocks analysis reveals that a drop in brightness of 61 days before the first flare at a significance of 34σ and an 8σ-emission dip that lasted 58 days before the second flare (see Figure 7a). Their lack of colour change is consistent with grey obscuration by the temporary suspension of dust-free, optically thick stellar debris.
5.1.2. AT2019aalc: Post-flare reconfiguration of the inner disk
The Seyfert 1 polar view of AT2019aalc provides an unobscured view of its nucleus and accretion disk. Following its first flare, the optical continuum of the host dimmed by ≈0.2 mag relative to its pre-burst level–a behaviour reminiscent of CSS100217 (Moriya et al. 2017). This decline likely reflects a significant reconfiguration of the AGN accretion disk, driven by the interaction between the disrupted stellar debris and the pre-existing disk. Such an interaction can generate shocks that efficiently transport angular momentum (Dodd et al. 2025), triggering a rapid inward inflow and leading to a partial depletion of the inner disk (Chan et al. 2019). Although the incoming stream might partially replenish the inner disk, the timescales for full recovery are uncertain. Since part of the optical emission in AGNs is enhanced through the reprocessing of the inner disk (Krolik et al. 1991), any reduction of the inner disk luminosity would naturally lead to a decline in the observed optical brightness. Moreover, the blue colours observed immediately after the first flare (≈59250 MJD) are consistent with a TDE that shock-heated the inner disk; as the disk cools, its continuum reverts to the pre-flare redder state (≈59250 − 60000 MJD; see Figure 7a). Alternatively, if the TDE induced a geometrical reconfiguration of the inner disk (e.g. a tilted disk, warping), the reprocessing efficiency of the X-ray emission by the outer disk can also be altered (Breedt et al. 2009), resulting in the observed optical dimming.
5.1.3. AT2019aalc: Quasi-periodic oscillations from a precessing inner disk
AT2019aalc displayed repeated flux excesses superimposed on the overall emission decay. We subtracted the smooth, decreasing baseline with a polynomial fit and performed a Lomb-Scargle periodogram analysis (Scargle 1982). With false-alarm probabilities estimated via bootstrap simulations, we identified two sets of quasi-periodic oscillations (QPOs) across ZTF bands at more than 3σ significance (see Figure 8). The first QPO has a period of T ≈ 162 days and is observed from the onset of the first flare until the start of the second flare, while the second set of QPO with a period of T ≈ 88 days was detected during the second flare. In a TDE scenario, QPOs could arise from modulations in the reprocessing layer or intrinsic variability of the inner accretion disk.
 |
Fig. 8. Lomb-Scargle periodograms of AT2019aalc from ZTF forced photometry, binned to 1-day intervals. Panel (a): Periodograms for the first flare of AT2019aalc, using data from the time of its peak up to the onset of the next flare (58700 − 59900 MJD). To account for the underlying fading of the continuum beyond the first flare, we subtracted a fourth-degree polynomial fit. Panel (b): Periodograms of the second flare of AT2019aalc (60200 − 60730 MJD). In this case, a second-degree polynomial was subtracted to remove the continuum. Uncertainties of the period (T) correspond to the FWHM of the detected peaks. The horizontal dotted lines represent the 3σ false-alarm probability thresholds, estimated via bootstrapping. Note that none of the peaks in the i-band light curve of the first flare exceeded 3σ and were thus excluded. |
If these QPOs reflect the dynamical timescales of the orbiting material, then assuming circular Keplerian orbits with timescales  , the material orbits at r ≈ 1015 cm. This is consistent with the size of TDE reprocessing photospheres (Nicholl et al. 2022; Hammerstein et al. 2023) as well as the optical-emitting region of an AGN disk (Shakura & Sunyaev 1973). In this context, QPOs could be due to inhomogeneities in the reprocessing layer from overdensities in the circularisation of the TDE debris or material ejected in debris-disk collisions (Chan et al. 2021), which would periodically change the covering factor. The higher-frequency QPO of the second flare would imply that the material responsible for the QPOs could be orbiting closer to the SMBH.
However, the QPO signal remained once the first flare of AT2019aalc faded beyond pre-flare continuum levels (see Figure 7a), arguing against overdensities from the TDE optically thick reprocessing layer. Instead, we suggest that the TDE caused a long-lived change in the AGN inner disk (Chan et al. 2019). Given the short lag timescales (≈0.7 days) between the inner disk and the TDE reprocessing layer (or optical-emitting AGN disk region), the observed QPOs could arise from geometric changes in the inner disk, which would modulate what is ultimately reprocessed at larger radii. This interpretation is further supported by contemporaneous X-ray observations during the optical flux excesses, which revealed a tenfold increase in X-ray flux (Veres et al. 2024; Śniegowska et al. 2025). Such behaviour is consistent with a scenario where the inner accretion disk is precessing over time. In particular, frame-dragging precession of the accretion disk can be induced if the infalling stellar debris is injected misaligned with the SMBH spin axis (Stone & Loeb 2012; Teboul & Metzger 2023; Pasham et al. 2024). Assuming a circularisation radius of Rc = 2Rt, where Rt = R★(MBH/M★)1/3 is the tidal radius, the Lense-Thirring torque timescale for the solid-body precession of a narrow ring is tLT = (πc3Rc3)/(aG2MBH2) (Lense & Thirring 1918; Stella & Vietri 1998). For the range of allowed masses of the disrupted star (see Table A.4) and the period of the QPOs (see Figure 8b), this implies a slowly rotating SMBH with spins of ∣a∣ ≲ 0.07. In this context, the higher-frequency QPO of the second flare could be caused by a smaller circularisation radius from a deeper star-SMBH encounter. Given the evidence of persistent TDE disks years after the optical flares (van Velzen et al. 2019), the intermittent view of the inner disk and low SMBH spin would modulate the reprocessed optical emission until the disk aligns with the SMBH spin, years later (Franchini et al. 2016; Teboul & Metzger 2023).
5.2. Polarisation of Bowen flares
Here, we discuss the interpretation of the polarisation time series of the two BFs. We begin with AT2019aalc – covering its early and late phases in Sections 5.2.1 and 5.2.2, respectively – and subsequently discuss AT2020afhd in Section 5.2.3.
5.2.1. AT2019aalc: Early time asymmetries in the accretion outflows
Between 30 days pre-optical peak and 25 days post-peak, the polarisation degree of AT2019aalc rose from P ≈ 0% to P ≈ 2%. This trend closely resembles that of AT2019qiz, a TDE-H+He. AT2019qiz was initially unpolarised near optical-peak time but exhibited a polarisation increase to P ≈ 1% around 29 days post-peak (Patra et al. 2022) – a value likely underestimated due to host galaxy dilution, and potentially as high as P ≈ 2% when accounting for it (see Figure 3). To explain the increase in the polarisation degree with time and the coincident rise of X-ray emission, two mechanisms were proposed: a receding quasi-spherical photosphere that exposed a growing asymmetry deep within the outflow (Patra et al. 2022) or a strong decrease in an initially high optical depth coupled with an intrinsically asymmetric outflow (Charalampopoulos et al. 2023). For AT2019aalc the increasing polarisation degree and stable polarisation angle were observed during the optically thick regime (see Figure 3), which is consistent with disk-driven emission reprocessed by large-scale, asymmetric outflows (Leloudas et al. 2022; Charalampopoulos et al. 2023). In this context the polarisation rise of AT2019aalc indicates that the outer layers of the photosphere began to thin around ≈60115 MJD (i.e. at ≈20 days before the optical peak), allowing single-scattered photons to start escaping. This is consistent with the contemporaneous X-ray upturn, with a peak at ≈60131 MJD (Veres et al. 2024; Śniegowska et al. 2025). Although the initial X-ray emission peak of AT2019aalc was at least one magnitude brighter than that of AGNs at comparable redshifts (Auchettl et al. 2018), the X-ray-to-optical luminosity ratio was low (LX/Lopt ≈ 10−2). This low ratio, combined with the high-density environment necessary for Bowen fluorescence, further supports a reprocessing-dominated TDE scenario (Roth et al. 2016).
The absence of a clear trend in the polarisation angle of AT2019aalc before 25 days post-optical peak is indicative of an axisymmetric photosphere during this early optically thick phase. However, mild stochastic variability was detected in both polarisation degree and angle (ΔP ≈ 0.4%, Δθ ≈ 15°), likely due to a clumpy, inhomogeneous medium – similar to what has been proposed for AT2019qiz (Patra et al. 2022) and AT2022fpx (Koljonen et al. 2024). AT2019aalc, AT2019qiz, and AT2022fpx showed coronal lines, in particular, high-ionisation iron emission lines (Short et al. 2023; Koljonen et al. 2024; Veres et al. 2024). The presence of such lines is consistent with the polarisation variability, as they are thought to arise from the leakage of a hard continuum – through, for example clumpy medium near the SMBH –, which subsequently ionises pre-existing material at larger distances (Short et al. 2023).
5.2.2. AT2019aalc: Late-time evidence of a tilted disk geometry
As shown in Section 5.1.3, the second flare of AT2019aalc exhibits a QPO with a period of T ≈ 90 days, which interpret as disk precession. Phase-folding the polarisation measurements taken beyond ≈190 days post-peak reveals this modulation in the polarisation signal as well. That is, the polarisation angle presents a modulation with amplitudes of Δθ ≈ 40°, peaking in phase with the flux maxima (see Figure 1a). The polarisation degree tends to decrease during the rebrightenings, likely due to the partial cancellation of the polarisation vectors. Altogether, these observations further suggest that by ≈190 days post-optical peak, the TDE material had already settled into an accretion disk, misaligned with the SMBH spin axis.
5.2.3. AT2020afhd: Evidence of direct and scattered emission
To date, polarimetric monitoring of changing-look AGNs at optical wavelengths has shown that their dramatic spectral transitions are likely driven by intrinsic variations in the accretion rate, rather than changes in dust obscuration along the line of sight (Marin 2017; Hutsemékers et al. 2017, 2019). In a canonical AGN type 2, the central engine is obscured behind a dusty torus, and a UV and optical flare such as that of AT2020afhd should only be seen via light scattered from the bi-conical polar outflows into our line of sight. In such a configuration, purely scattered light should yield a constant polarisation angle (Marin & Hutsemékers 2020). However, AT2020afhd displays a striking Δθ = 83 ± 8° rotation of the polarisation angle during its second flare. This behaviour can be naturally explained if both the direct continuum from the flare and the orthogonally polarised light echo – scattered by the polar outflows – are observed (Marin & Hutsemékers 2020). When the flare is bright, the direct component dominates, and as it fades, the scattered echo causes the net angle to rotate by Δθ = 90°. This two-component model for polarisation suggests an intermediate-viewing angle of the AT2020afhd system (Marin & Hutsemékers 2020). We note that a Δθ ≈ 90° was recently reported during the nuclear flare of AT2023clx in a LINER galaxy and was interpreted as the interplay between direct outflow emission and an orthogonally polarised scattered dust echo (Uno et al. 2025).
The detection of direct UV and optical continuum emission through what is normally a Compton-thick line of sight has previously pointed towards an exceptionally powerful, transient increase in the AGN accretion rate in the type-2 changing-look 1ES 1927+654 (Trakhtenbrot et al. 2019a). For AT2020afhd the polarisation angle shift is consistent with a temporary unobscured view of the flare, in line with the low hydrogen column density inferred by MOSFiT (see Table A.4). Furthermore, the progressively brighter flares of AT2020afhd point towards a partial tidal disruption event as the most plausible driver of the enhanced accretion episode (see Section 5.1.1 and Figure 7b; Wang et al. 2024; Liu et al. 2025).
6. Conclusions
The optical polarimetric campaign presented here provides strong evidence that most thermal TDEs are primarily powered by the reprocessing of the emission of newly formed accretion disks, rather than shocks from stellar-debris streams. The three TDEs from quiescent galaxies (AT2024bgz, AT2024pvu, and AT2024wsd) exhibited mild, slowly declining degrees of optical polarisation (P ≲ 6%) with fixed electric-vector position angles. This behaviour is in line with what axisymmetric reprocessing geometries predict (Leloudas et al. 2022; Charalampopoulos et al. 2023), and it has now been observed in six of the seven thermal TDEs for which time-resolved polarimetry exists.
The BF events of this work are best explained as partial TDEs in AGNs rather than a new form of AGN variability. Several independent strands of evidence converge on this conclusion. (i) AT2019aalc has produced two optical outbursts with identical rise and decay profiles – a behaviour naturally expected if a star is repeatedly skimmed and stripped on successive pericentre passages. (ii) In both AT2019aalc and AT2020afhd, the second flare is more luminous than the first, matching the prediction that a partially disrupted star sheds mass exponentially faster in its final encounters with the SMBH (Liu et al. 2025). (iii) QPOs detected since the onset of the first flare of AT2019aalc – together with a phase-locked Δθ ≈ 40° rotation of the linear-polarisation angle – point to a precessing, tilted inner disk formed by the misaligned interaction of the stellar debris with the SMBH. Additionally, the polarisation data of AT2019aalc suggest asymmetric, clumpy outflows – in line with other coronal-line emitters. By contrast, the Δθ = 83 ± 8° swing in the polarisation angle observed in the AGN type-2 AT2020afhd signals a combination of direct and polar-scattered light and hence an episode of extreme accretion seen by a mid-latitude observer. Taken together, these findings suggest that TDEs occurring in AGNs may systematically differ from those in quiescent galaxies and provide the EUV photons as well as the dense, optically thick environment necessary for sustained Bowen fluorescence. Additionally, such events can induce long-lasting changes in the AGN inner flow, thereby imprinting distinctive, time-dependent polarisation signatures.
The Vera Rubin Observatory’s photometric survey is expected to raise the annual TDE discovery rate from a few tens to several thousand (Bricman & Gomboc 2020), enabling population-scale studies across TDE spectral subclasses. Deep, early time broadband polarimetric (and spectropolarimetric) observations with sub-month cadence – paired with soft X-ray monitoring – of even a small fraction of these TDEs would allow the systematic mapping of the reprocessing-layer (and line-emitting) geometries and help discriminate between disk-reprocessing and stream-shock emission models.
This discovery rate is based on the classification reports submitted to the Transient Name Server (TNS): https://www.wis-tns.org/search
Initially, the polarisation of AT2019dsg was interpreted as potentially arising from a relativistic TDE outflow (Lee et al. 2020); however, subsequent multi-wavelength observations did not support this scenario (Cendes et al. 2021).
Note that the average values of instrumental polarisation derived here are in agreement with those reported on the Liverpool Telescope website: https://telescope.livjm.ac.uk/TelInst/Inst/MOPTOP/
Acknowledgments
N.J.-M. acknowledges support from the Alexander von Humboldt Foundation. A.F. and P.M.V. acknowledge the support from the DFG via the Collaborative Research Center SFB1491 Cosmic Interacting Matters – From Source to Signal. E.R.-R. thanks the Heising-Simons Foundation and NSF: AST 1852393, AST 2150255 and AST 2206243. The Liverpool Telescope is operated on the island of La Palma by Liverpool John Moores University in the Spanish Observatorio del Roque de los Muchachos of the Instituto de Astrofisica de Canarias with financial support from the UK Science and Technology Facilities Council. This project has received funding from the European Union’s Horizon 2020 research and innovation programme under grant agreement No. 101004719. Based on observations obtained with the Samuel Oschin Telescope 48-inch and the 60-inch Telescope at the Palomar Observatory as part of the Zwicky Transient Facility project. ZTF is supported by the National Science Foundation under Grant No. AST-2034437 and a collaboration including Caltech, IPAC, the Weizmann Institute for Science, the Oskar Klein Center at Stockholm University, the University of Maryland, Deutsches Elektronen-Synchrotron and Humboldt University, the TANGO Consortium of Taiwan, the University of Wisconsin at Milwaukee, Trinity College Dublin, Lawrence Livermore National Laboratories, and IN2P3, France. Operations are conducted by COO, IPAC, and UW. This work has made use of data from the Asteroid Terrestrial-impact Last Alert System (ATLAS) project. The Asteroid Terrestrial-impact Last Alert System (ATLAS) project is primarily funded to search for near-Earth asteroids through NASA grants NN12AR55G, 80NSSC18K0284, and 80NSSC18K1575; byproducts of the NEO search include images and catalogs from the survey area. This work was partially funded by Kepler/K2 grant J1944/80NSSC19K0112 and HST GO-15889, and STFC grants ST/T000198/1 and ST/S006109/1. The ATLAS science products have been made possible through the contributions of the University of Hawaii Institute for Astronomy, the Queen’s University Belfast, the Space Telescope Science Institute, the South African Astronomical Observatory, and The Millennium Institute of Astrophysics (MAS), Chile. Finally, we thank the anonymous referee for their constructive comments and suggestions.
References
- Alexander, T. 2017, ARA&A, 55, 17 [NASA ADS] [CrossRef] [Google Scholar]
- Arcavi, I., Gal-Yam, A., Sullivan, M., et al. 2014, ApJ, 793, 38 [Google Scholar]
- Arcavi, I., Faris, S., Newsome, M., Sniegowska, M., & Trakhtenbrot, B. 2024, Transient Name Server AstroNote, 53, 1 [Google Scholar]
- Arnold, D. 2017, Ph.D. Thesis, Liverpool John Moores University [Google Scholar]
- Auchettl, K., Ramirez-Ruiz, E., & Guillochon, J. 2018, ApJ, 852, 37 [NASA ADS] [CrossRef] [Google Scholar]
- Bade, N., Komossa, S., & Dahlem, M. 1996, A&A, 309, L35 [NASA ADS] [Google Scholar]
- Bandopadhyay, A., Coughlin, E. R., Nixon, C. J., & Pasham, D. R. 2024, ApJ, 974, 80 [Google Scholar]
- Bellm, E. C., Kulkarni, S. R., Graham, M. J., et al. 2019, PASP, 131, 018002 [Google Scholar]
- Beroiz, M., Cabral, J. B., & Sanchez, B. 2020, Astron. Comput., 32, 100384 [NASA ADS] [CrossRef] [Google Scholar]
- Blagorodnova, N., Cenko, S. B., Kulkarni, S. R., et al. 2019, ApJ, 873, 92 [NASA ADS] [CrossRef] [Google Scholar]
- Bonnerot, C., Rossi, E. M., & Lodato, G. 2017, MNRAS, 464, 2816 [Google Scholar]
- Bonnerot, C., Lu, W., & Hopkins, P. F. 2021, MNRAS, 504, 4885 [NASA ADS] [CrossRef] [Google Scholar]
- Bowen, I. S. 1934, PASP, 46, 146 [NASA ADS] [CrossRef] [Google Scholar]
- Bowen, I. S. 1935, ApJ, 81, 1 [NASA ADS] [CrossRef] [Google Scholar]
- Bradley, L., Sipocz, B., Robitaille, T., et al. 2016, https://doi.org/10.5281/zenodo.164986 [Google Scholar]
- Breedt, E., Arévalo, P., McHardy, I. M., et al. 2009, MNRAS, 394, 427 [NASA ADS] [CrossRef] [Google Scholar]
- Bricman, K., & Gomboc, A. 2020, ApJ, 890, 73 [NASA ADS] [CrossRef] [Google Scholar]
- Brindle, C., Hough, J. H., Bailey, J. A., Axon, D. J., & Sparks, W. B. 1991, MNRAS, 252, 288 [Google Scholar]
- Cendes, Y., Alexander, K. D., Berger, E., et al. 2021, ApJ, 919, 127 [NASA ADS] [CrossRef] [Google Scholar]
- Chan, C.-H., Piran, T., Krolik, J. H., & Saban, D. 2019, ApJ, 881, 113 [Google Scholar]
- Chan, C.-H., Piran, T., & Krolik, J. H. 2021, ApJ, 914, 107 [NASA ADS] [CrossRef] [Google Scholar]
- Charalampopoulos, P., Bulla, M., Bonnerot, C., & Leloudas, G. 2023, A&A, 670, A150 [NASA ADS] [CrossRef] [EDP Sciences] [Google Scholar]
- Chen, Y.-P., Zaw, I., Farrar, G. R., & Elgamal, S. 2022, ApJS, 258, 29 [Google Scholar]
- Dai, L., McKinney, J. C., Roth, N., Ramirez-Ruiz, E., & Miller, M. C. 2018, ApJ, 859, L20 [Google Scholar]
- De Colle, F., Guillochon, J., Naiman, J., & Ramirez-Ruiz, E. 2012, ApJ, 760, 103 [NASA ADS] [CrossRef] [Google Scholar]
- Dodd, S. A., Huang, X., Davis, S. W., & Ramirez-Ruiz, E. 2025 ArXiv e-prints [arXiv:2506.19900] [Google Scholar]
- Drake, A. J., Djorgovski, S. G., Mahabal, A., et al. 2009, ApJ, 696, 870 [Google Scholar]
- Franchini, A., Lodato, G., & Facchini, S. 2016, MNRAS, 455, 1946 [NASA ADS] [CrossRef] [Google Scholar]
- Frank, J. 1978, MNRAS, 184, 87 [Google Scholar]
- Gezari, S. 2021, ARA&A, 59, 21 [NASA ADS] [CrossRef] [Google Scholar]
- Gezari, S., Heckman, T., Cenko, S. B., et al. 2009, ApJ, 698, 1367 [Google Scholar]
- Gezari, S., Chornock, R., Rest, A., et al. 2012, Nature, 485, 217 [Google Scholar]
- Godson, B., Warwick, B., Pursiainen, M., et al. 2024a, Transient Name Server AstroNote, 47, 1 [Google Scholar]
- Godson, B., Warwick, B., Pursiainen, M., et al. 2024b, Transient Name Server Classification Report, 2024-401, 1 [Google Scholar]
- Guillochon, J., & Ramirez-Ruiz, E. 2013, ApJ, 767, 25 [NASA ADS] [CrossRef] [Google Scholar]
- Guillochon, J., & Ramirez-Ruiz, E. 2015, ApJ, 809, 166 [Google Scholar]
- Guillochon, J., Manukian, H., & Ramirez-Ruiz, E. 2014, ApJ, 783, 23 [NASA ADS] [CrossRef] [Google Scholar]
- Guillochon, J., Nicholl, M., Villar, V. A., et al. 2018, ApJS, 236, 6 [NASA ADS] [CrossRef] [Google Scholar]
- Hammerstein, E., van Velzen, S., Gezari, S., et al. 2023, ApJ, 942, 9 [NASA ADS] [CrossRef] [Google Scholar]
- Hayasaki, K., Stone, N., & Loeb, A. 2016, MNRAS, 461, 3760 [NASA ADS] [CrossRef] [Google Scholar]
- Hills, J. G. 1975, Nature, 254, 295 [Google Scholar]
- Hung, T., Gezari, S., Cenko, S. B., et al. 2018, ApJS, 238, 15 [NASA ADS] [CrossRef] [Google Scholar]
- Hutsemékers, D., Agís González, B., Sluse, D., Ramos Almeida, C., & Acosta Pulido, J. A. 2017, A&A, 604, L3 [NASA ADS] [CrossRef] [EDP Sciences] [Google Scholar]
- Hutsemékers, D., Agís González, B., Marin, F., et al. 2019, A&A, 625, A54 [NASA ADS] [CrossRef] [EDP Sciences] [Google Scholar]
- Jiang, Y.-F., Guillochon, J., & Loeb, A. 2016, ApJ, 830, 125 [NASA ADS] [CrossRef] [Google Scholar]
- Jonker, P. G., Stone, N. C., Generozov, A., van Velzen, S., & Metzger, B. 2020, ApJ, 889, 166 [NASA ADS] [CrossRef] [Google Scholar]
- Jordana-Mitjans, N. 2021, Ph.D. Thesis, University of Bath [Google Scholar]
- Jordana-Mitjans, N., Mundell, C. G., Smith, R. J., et al. 2021, MNRAS, 505, 2662 [Google Scholar]
- Kelly, B. C., Bechtold, J., & Siemiginowska, A. 2009, ApJ, 698, 895 [Google Scholar]
- Kochanek, C. S., Shappee, B. J., Stanek, K. Z., et al. 2017, PASP, 129, 104502 [Google Scholar]
- Koljonen, K. I. I., Liodakis, I., Lindfors, E., et al. 2024, MNRAS, 532, 112 [Google Scholar]
- Komossa, S. 2015, J. High Energy Astrophys., 7, 148 [Google Scholar]
- Komossa, S., & Bade, N. 1999, A&A, 343, 775 [NASA ADS] [Google Scholar]
- Krolik, J. H., Horne, K., Kallman, T. R., et al. 1991, ApJ, 371, 541 [Google Scholar]
- Lacy, M., Baum, S. A., Chandler, C. J., et al. 2020, PASP, 132, 035001 [Google Scholar]
- Lee, C.-H., Hung, T., Matheson, T., et al. 2020, ApJ, 892, L1 [NASA ADS] [CrossRef] [Google Scholar]
- Leloudas, G., Bulla, M., Cikota, A., et al. 2022, Nat. Astron., 6, 1193 [NASA ADS] [CrossRef] [Google Scholar]
- Lense, J., & Thirring, H. 1918, Physikalische Zeitschrift, 19, 156 [NASA ADS] [Google Scholar]
- Liodakis, I., Koljonen, K. I. I., Blinov, D., et al. 2023, Science, 380, 656 [Google Scholar]
- Liu, X.-L., Dou, L.-M., Chen, J.-H., & Shen, R.-F. 2022, ApJ, 925, 67 [NASA ADS] [CrossRef] [Google Scholar]
- Liu, C., Mockler, B., Ramirez-Ruiz, E., et al. 2023, ApJ, 944, 184 [CrossRef] [Google Scholar]
- Liu, C., Yarza, R., & Ramirez-Ruiz, E. 2025, ApJ, 979, 40 [Google Scholar]
- Loeb, A., & Ulmer, A. 1997, ApJ, 489, 573 [Google Scholar]
- Lu, W., & Bonnerot, C. 2020, MNRAS, 492, 686 [NASA ADS] [CrossRef] [Google Scholar]
- MacLeod, C. L., Ivezić, Ž., Kochanek, C. S., et al. 2010, ApJ, 721, 1014 [Google Scholar]
- MacLeod, M., Ramirez-Ruiz, E., Grady, S., & Guillochon, J. 2013, ApJ, 777, 133 [NASA ADS] [CrossRef] [Google Scholar]
- Mainzer, A., Bauer, J., Grav, T., et al. 2011, ApJ, 731, 53 [Google Scholar]
- Marin, F. 2014, MNRAS, 441, 551 [NASA ADS] [CrossRef] [Google Scholar]
- Marin, F. 2017, A&A, 607, A40 [NASA ADS] [CrossRef] [EDP Sciences] [Google Scholar]
- Marin, F. 2018, A&A, 615, A171 [NASA ADS] [CrossRef] [EDP Sciences] [Google Scholar]
- Marin, F., & Hutsemékers, D. 2020, A&A, 636, A23 [NASA ADS] [CrossRef] [EDP Sciences] [Google Scholar]
- Marin, F., Goosmann, R. W., Gaskell, C. M., Porquet, D., & Dovčiak, M. 2012, A&A, 548, A121 [NASA ADS] [CrossRef] [EDP Sciences] [Google Scholar]
- Metzger, B. D., & Stone, N. C. 2016, MNRAS, 461, 948 [NASA ADS] [CrossRef] [Google Scholar]
- Miller, M. C. 2015, ApJ, 805, 83 [Google Scholar]
- Mockler, B., & Ramirez-Ruiz, E. 2021, ApJ, 906, 101 [CrossRef] [Google Scholar]
- Mockler, B., Guillochon, J., & Ramirez-Ruiz, E. 2019, ApJ, 872, 151 [Google Scholar]
- Moriya, T. J., Tanaka, M., Morokuma, T., & Ohsuga, K. 2017, ApJ, 843, L19 [NASA ADS] [CrossRef] [Google Scholar]
- Nicholl, M., Lanning, D., Ramsden, P., et al. 2022, MNRAS, 515, 5604 [NASA ADS] [CrossRef] [Google Scholar]
- Pasham, D. R., Zajaček, M., Nixon, C. J., et al. 2024, Nature, 630, 325 [NASA ADS] [CrossRef] [Google Scholar]
- Patra, K. C., Lu, W., Brink, T. G., et al. 2022, MNRAS, 515, 138 [NASA ADS] [CrossRef] [Google Scholar]
- Piran, T., Svirski, G., Krolik, J., Cheng, R. M., & Shiokawa, H. 2015, ApJ, 806, 164 [Google Scholar]
- Planck Collaboration VI. 2020, A&A, 641, A6 [NASA ADS] [CrossRef] [EDP Sciences] [Google Scholar]
- Planck Collaboration XII. 2020, A&A, 641, A12 [NASA ADS] [CrossRef] [EDP Sciences] [Google Scholar]
- Predehl, P., Andritschke, R., Arefiev, V., et al. 2021, A&A, 647, A1 [EDP Sciences] [Google Scholar]
- Ramirez-Ruiz, E., & Rosswog, S. 2009, ApJ, 697, L77 [NASA ADS] [CrossRef] [Google Scholar]
- Rees, M. J. 1988, Nature, 333, 523 [Google Scholar]
- Roth, N., Kasen, D., Guillochon, J., & Ramirez-Ruiz, E. 2016, ApJ, 827, 3 [Google Scholar]
- Scargle, J. D. 1982, ApJ, 263, 835 [Google Scholar]
- Scargle, J. D., Norris, J. P., Jackson, B., & Chiang, J. 2013, ApJ, 764, 167 [Google Scholar]
- Schachter, J., Filippenko, A. V., & Kahn, S. M. 1990, ApJ, 362, 74 [Google Scholar]
- Schlegel, D. J., Finkbeiner, D. P., & Davis, M. 1998, ApJ, 500, 525 [Google Scholar]
- Schmidt, G. D., Elston, R., & Lupie, O. L. 1992, AJ, 104, 1563 [Google Scholar]
- Serkowski, K., Mathewson, D. S., & Ford, V. L. 1975, ApJ, 196, 261 [NASA ADS] [CrossRef] [Google Scholar]
- Shakura, N. I., & Sunyaev, R. A. 1973, A&A, 24, 337 [NASA ADS] [Google Scholar]
- Shingles, L., Smith, K. W., Young, D. R., et al. 2021, Transient Name Server AstroNote, 7, 1 [NASA ADS] [Google Scholar]
- Shiokawa, H., Krolik, J. H., Cheng, R. M., Piran, T., & Noble, S. C. 2015, ApJ, 804, 85 [Google Scholar]
- Short, P., Lawrence, A., Nicholl, M., et al. 2023, MNRAS, 525, 1568 [NASA ADS] [CrossRef] [Google Scholar]
- Shrestha, M., Steele, I. A., Piascik, A. S., et al. 2020, MNRAS, 494, 4676 [NASA ADS] [CrossRef] [Google Scholar]
- Simmons, J. F. L., & Stewart, B. G. 1985, A&A, 142, 100 [NASA ADS] [Google Scholar]
- Śniegowska, M., Trakhtenbrot, B., Makrygianni, L., et al. 2025, ApJ, 989, 173 [Google Scholar]
- Steele, I. A. 2004, Astron. Nachr., 325, 519 [NASA ADS] [CrossRef] [Google Scholar]
- Stein, R., Mahabal, A., Reusch, S., et al. 2024a, ApJ, 965, L14 [Google Scholar]
- Stein, R., Ahumada, T., Angus, C., et al. 2024b, Transient Name Server AstroNote, 221, 1 [Google Scholar]
- Stein, R., Andreoni, I., Graham, M., et al. 2024c, Transient Name Server AstroNote, 302, 1 [Google Scholar]
- Stella, L., & Vietri, M. 1998, ApJ, 492, L59 [NASA ADS] [CrossRef] [Google Scholar]
- Stone, N., & Loeb, A. 2012, Phys. Rev. Lett., 108, 061302 [NASA ADS] [CrossRef] [Google Scholar]
- Stone, N. C., & Metzger, B. D. 2016, MNRAS, 455, 859 [NASA ADS] [CrossRef] [Google Scholar]
- Strubbe, L. E., & Quataert, E. 2009, MNRAS, 400, 2070 [NASA ADS] [CrossRef] [Google Scholar]
- Teboul, O., & Metzger, B. D. 2023, ApJ, 957, L9 [Google Scholar]
- Thomsen, L. L., Kwan, T. M., Dai, L., et al. 2022, ApJ, 937, L28 [NASA ADS] [CrossRef] [Google Scholar]
- Toba, Y., Oyabu, S., Matsuhara, H., et al. 2014, ApJ, 788, 45 [Google Scholar]
- Tonry, J. L., Denneau, L., Heinze, A. N., et al. 2018, PASP, 130, 064505 [Google Scholar]
- Trakhtenbrot, B., Arcavi, I., MacLeod, C. L., et al. 2019a, ApJ, 883, 94 [Google Scholar]
- Trakhtenbrot, B., Arcavi, I., Ricci, C., et al. 2019b, Nat. Astron., 3, 242 [Google Scholar]
- Turnshek, D. A., Bohlin, R. C., Williamson, R. L., et al. 1990, AJ, 99, 1243 [NASA ADS] [CrossRef] [Google Scholar]
- Uno, K., Maeda, K., Nagao, T., et al. 2025, ApJ, 986, L23 [Google Scholar]
- van Velzen, S., Farrar, G. R., Gezari, S., et al. 2011, ApJ, 741, 73 [Google Scholar]
- van Velzen, S., Stone, N. C., Metzger, B. D., et al. 2019, ApJ, 878, 82 [NASA ADS] [CrossRef] [Google Scholar]
- van Velzen, S., Holoien, T. W. S., Onori, F., Hung, T., & Arcavi, I. 2020, Space Sci. Rev., 216, 124 [CrossRef] [Google Scholar]
- van Velzen, S., Pasham, D. R., Komossa, S., Yan, L., & Kara, E. A. 2021a, Space Sci. Rev., 217, 63 [NASA ADS] [CrossRef] [Google Scholar]
- van Velzen, S., Gezari, S., Hammerstein, E., et al. 2021b, ApJ, 908, 4 [NASA ADS] [CrossRef] [Google Scholar]
- Veres, P. M., Franckowiak, A., van Velzen, S., et al. 2024, A&A, submitted [arXiv:2408.17419] [Google Scholar]
- Voges, W., Aschenbach, B., Boller, T., et al. 1999, A&A, 349, 389 [NASA ADS] [Google Scholar]
- Wang, L., Wheeler, J. C., & Höflich, P. 1997, ApJ, 476, L27 [NASA ADS] [CrossRef] [Google Scholar]
- Wang, Y., Lin, D. N. C., Zhang, B., & Zhu, Z. 2024, ApJ, 962, L7 [NASA ADS] [CrossRef] [Google Scholar]
- Weitenbeck, A. J. 1999, Acta Astron., 49, 59 [NASA ADS] [Google Scholar]
- Whittet, D. C. B. 2004, ASP Conf. Ser., 309, 65 [Google Scholar]
- Whittet, D. C. B., Martin, P. G., Hough, J. H., et al. 1992, ApJ, 386, 562 [NASA ADS] [CrossRef] [Google Scholar]
- Wiersema, K., van der Horst, A. J., Levan, A. J., et al. 2012, MNRAS, 421, 1942 [NASA ADS] [CrossRef] [Google Scholar]
- Wiersema, K., Higgins, A. B., Levan, A. J., et al. 2020, MNRAS, 491, 1771 [NASA ADS] [CrossRef] [Google Scholar]
- Willingale, R., Starling, R. L. C., Beardmore, A. P., Tanvir, N. R., & O’Brien, P. T. 2013, MNRAS, 431, 394 [Google Scholar]
- Wright, E. L., Eisenhardt, P. R. M., Mainzer, A. K., et al. 2010, AJ, 140, 1868 [Google Scholar]
- Yan, L., Wang, T., Jiang, N., et al. 2019, ApJ, 874, 44 [NASA ADS] [CrossRef] [Google Scholar]
- Yao, Y., Ravi, V., Gezari, S., et al. 2023, ApJ, 955, L6 [NASA ADS] [CrossRef] [Google Scholar]
Appendix A: Extended data reduction
In Appendix A.1, we explain how we maximised the signal-to-noise ratio of the transients; in Appendix A.2, we detail the calibration methods employed to correct the target data for the MOPTOP instrumental effects.
A.1. Maximising the signal-to-noise ratio
Each observing sequence with MOPTOP consists of Nrot full rotations of the half-wave plate. Each full rotation yields 16 images per CMOS, which is a total of 32Nrot images per observing run. We improved the signal-to-noise ratio of the detections by aligning frames using the astroalign package (Beroiz et al. 2020) and combining them. In an initial approach, each 32Nrot-image dataset was combined into a 32-images dataset (i.e. 16 images per CMOS), from which we extracted 8 pairs of (q, u) values following Shrestha et al. (2020). In a second attempt to maximise the signal-to-noise ratio of the faint targets, we stacked the 32 images until there were only eight left (i.e. four images per CMOS), from which we derived two pairs of (q, u) values. The average (q, u) measurements obtained from the 32- and eight-frame datasets were consistent within 1σ. For the remainder of this work, we adopted the eight-frame approach due to its higher signal-to-noise ratio. For example, during the 14 June 2023 observing run of AT2019aalc (see Table A.1), we detected the transient (and host galaxy) at an average signal-to-noise ratio of ≈250 in each of the 32 frames, which was maximised to a signal-to-noise ratio of ≈453 in each of the eight frames of the final stack (see Table A.3).
For each observing sequence, we used variable photometric apertures to account for the varying point-spread function of the sources from different atmospheric conditions. We fitted a 2D Gaussian to the sources and estimated the FWHM of the point-spread function. Note that to later be able to estimate the host galaxy depolarisation with pre-flare survey data (see Section 3.2), we included most of the host galaxy emission. That is, we used large photometric apertures of 2FWHM radius, corresponding to 99.998% of the flux of a point-like source.
After correcting the observations for MOPTOP instrumental polarisation effects (see Appendix A.2), we checked the stability of the instrument during observations using bright stars in each field of view (12.4 − 14.4 mag in the r band). We also tested the accuracy of the polarisation measurements using different photometric apertures in the range of 1.5 − 4 FWHM. For the polarisation time series of the transients and bright stars, there were no polarisation variations larger than 1σ. The polarisation degree of the bright stars presented ΔP ≈ 0.03 − 0.15% departure from the mean during MOPTOP observations; therefore, each polarimetric measurement of the transient was individually corrected for these instrumental offsets (note that in this process, we also subtracted the Galactic ISM polarisation). The average polarisation of these bright stars is reported in Table A.2, which gives an estimate of the Galactic ISM polarisation in the lines of sight of the transients.
A.2. Instrumental polarisation corrections
Here, we describe the steps that we have followed to correct the target data for MOPTOP instrumental effects. We first subtracted the instrumental offset in Appendix A.2.1; we then corrected the data for the instrumental depolarisation in Appendix A.2.3 (alternatively, see Appendix A.2.2, where we describe a correction assuming a constant depolarisation factor); finally, we corrected the polarisation angle for instrumental rotation effects in Appendix A.2.4.
A.2.1. Stokes parameters offset
To correct for the instrumental polarisation, we analysed 244 routine MOP-L and 199 MOP-I observations of the unpolarised standards GD 319, BD +32 3739, and HD 14069 (Turnshek et al. 1990) between 1 October 2022 and 18 February 2025. We calculated the Stokes parameters of the unpolarised standards to determine the instrumental polarisation offset (qinst, uinst; see Figures A.1). The average Stokes parameters8 were  ,
,  for the MOP-L filter, and
  ,
,  for the MOP-I filter.
Using a Pearson’s correlation test on the time series, we detected the following significant trends with p-values < 0.05; the signal-to-noise ratio of the standard stars presented a monotonic decrease across years caused by the normal degradation of the Liverpool Telescope primary mirror (with correlation coefficients |r|> 0.7). This trend continued until 02/08/24, when the mirror was re-aluminised9, resulting in an increase in signal-to-noise ratio by a factor of ≈1.6. Additionally, the qinst offset decreased with time (|r|{L, I} = 0.1, 0.2 for the MOP-L and MOP-I filters, respectively), while the uinst increased (|r|{L, I} = 0.2, 0.4). To account for the observed trends, we corrected each raw science measurement (qraw, uraw) by an average instrumental offset determined around the same observing time as the science target (qinst, uinst). The instrumental offsets were then subtracted from the science measurement as (q′,u′) = (qraw, uraw)−(qinst, uinst).
A.2.2. Constant depolarisation
To calculate the degree of depolarisation of the MOPTOP polarimeter with the MOP-L and MOP-I filter setups, we used routine observations of the following polarised standards: BD +64 106, VI Cyg 12, HD 251204, HD 155197, and HILT 960 (Turnshek et al. 1990; Schmidt et al. 1992; Weitenbeck 1999). The standards were observed between the 1 October 2022 and 19 February 2025, and we analysed 562 MOP-L and 556 MOP-I observations.
Assuming uniform depolarisation across the Stokes plane, the (q′,u′) measurements are expected to lie along characteristic polarisation circles, resulting from variations in the telescope’s rotation angle at each observation epoch (see Appendix A.2.4). Under this assumption, the catalogue polarisation value (Pref) and the measured polarisation ( ) are directly related as P′=Pref Dc. We measured depolarisation factors Dc, L = 0.87 ± 0.01 and Dc, I = 0.81 ± 0.02 for the MOP-L and MOP-I filters, respectively; see Figures A.2.
A.2.3. Elliptical depolarisation
Former polarimeters at the Liverpool Telescope presented elliptical depolarisation (Arnold 2017; Jordana-Mitjans 2021). MOPTOP also suffers from this instrumental effect and the (q′,u′) data are distributed in ellipses in the Stokes plane instead of circles (see Figures A.3-A.4, a), which causes an angle dependence on the depolarisation. Therefore, next, we characterised the degree of ellipticity of the MOPTOP and corrected the data for it before calculating a new depolarisation factor (Dϵ).
For each MOPTOP filter, we simultaneously fitted an ellipse to the normalised (q′, u′) data of the five polarised standards, with parameters the major axis scaling (a), the minor axis scaling (b), and the ellipse rotation angle (ψ). We found the following parameters: for the MOP-L filter, aL = 1.080 ± 0.005, bL = 0.919 ± 0.004, and ψL = 106.4 ± 1.3° (with eccentricity ϵL = 0.53 ± 0.01); for the MOP-I filter, aI = 1.080 ± 0.006, bI = 0.941 ± 0.004, ψI = 108.8 ± 1.4° (ϵI = 0.49 ± 0.01). Note that the eccentricity levels are similar to those found for the MOPTOP predecessor RINGO3 (Jordana-Mitjans 2021).
Next, we corrected for ellipticity and derived the transformed Stokes parameters ( ,
,  ). Starting from the general equation of an ellipse, we have that each pair of (qi′, ui′) satisfies
 (A.1)
(A.1)
 (A.2)
(A.2)
where the angle is
 (A.3)
(A.3)
and we have defined δ = (a − b)/a, which takes values δL = 0.149 ± 0.006 and δI = 0.129 ± 0.006, depending on the MOPTOP filter. We corrected each pair of (qi′, ui′) values to obtain the ellipticity-corrected Stokes parameters ( ,
,  ) as follows:
 (A.4)
(A.4)
which corresponds to a polarisation circle with a radius equal to the major axis ai. For each pair of (qi′, ui′), the parameter ai was calculated as
 (A.5)
(A.5)
 (A.6)
(A.6)
 (A.7)
(A.7)
After correcting for ellipticity in Figures A.3-A.4 (b), we found depolarisation factors  and
and  for the MOP-L and MOP-I filters, respectively (see Figures A.2). The Stokes parameters were corrected as
  .
.
To evaluate the long-term stability of MOPTOP, we analysed the polarisation degree of polarised standard stars over a two-year period. We found that the Pearson correlation coefficients of the polarisation time series of the standard stars shown in Figure A.5 are not statistically significant for both filters (p-values > 0.05), indicating no evidence for monotonic trends in polarisation over time. The polarisation degree presented a variability of ΔP ≲ 0.2% (1σ) in both filters, in agreement with that found using bright stars in Appendix A.1. However, we note that the scatter increased to ΔP ≈ 0.3 − 0.8% (1σ) when no correction for ellipticity was applied.
A.2.4. Polarisation angle offset
Finally, we used the polarised standards to correct for the instrumental effects on the observed polarisation angle (θobs). That is, we first corrected each observation for the rotation angle of the telescope (θtel), and then we determined the instrumental offset relative to the North (θinst) per filter. We measured an average  and
and  for the instrumental polarisation angle; see bottom panels of Figures A.5. We found significant Pearson’s correlation coefficients with p-values < 0.05 and |r| = 0.2, indicating a weak but consistent monotonic decrease in polarisation over time for both filters. As a result, the science observations were corrected for a local average, following the same approach as for the instrumental Stokes offset correction. The Stokes parameters were then corrected as

is the rotation matrix that corrects for θ = θtel + θinst; see results in Figures A.3-A.4 (c).
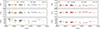 |
Fig. A.1. Time series of the MOPTOP instrumental zero points (qinst, uinst) for the (a) MOP-L and (b) MOP-I filters. The unpolarised stars used for the determination of these zero points are GD 319, BD +32 3739, and HD 14069. The grey lines correspond to the mean instrumental offset and the shaded grey regions to its standard deviation. The S/N panel corresponds to the target average signal-to-noise ratio. |
 |
Fig. A.2. MOPTOP instrumental depolarisation for the (a) MOP-L and (b) MOP-I filters. The Pref is the polarisation degree of BD +64 106, VI Cyg 12, HD 251204, HD 155197, and HILT 960 reported in Turnshek et al. (1990), Schmidt et al. (1992), Weitenbeck (1999), and P is that measured with the MOPTOP. The dotted line represents the 1:1 relation. The solid lines are linear fits to the data, i.e. P = Pref D, where D is the depolarisation factor. Coloured-marker data (Dc) do not include ellipticity corrections, and black-marker data (Dϵ) are corrected for ellipticity. |
 |
Fig. A.3. Stokes parameters of the polarised standards as measured with the MOPTOP and the MOP-L filter. The solid circles correspond to the catalogue polarisation degree (Turnshek et al. 1990; Schmidt et al. 1992; Weitenbeck 1999), and the dotted lines mark the (q, u) = (0, 0). The three figures show (a) data corrected only for the instrumental offset (qinst, uinst), (b) data corrected for ellipticity (a, b, ψ), and (c) data additionally corrected via depolarisation (Dϵ), as well as the angle rotation induced by the Liverpool Telescope (θtel) and MOPTOP (θinst). |
 |
Fig. A.4. Stokes parameters of the polarised standards as measured with the MOPTOP and the MOP-I filter. See the caption of Figure A.3 for more details. |
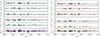 |
Fig. A.5. Upper five panels: Polarisation-degree time series of the polarised standards, BD +64 106 (Ps1), HD 155197 (Ps2), HD 251204 (Ps3), HILT 960 (Ps4), and VI Cyg 12 (Ps5). The dotted black lines indicate the catalogue polarisation, and the shaded regions represent the standard deviation around the mean. Bottom panels: Instrumental offset of the polarisation angle (θinst). The shaded regions represent the standard deviation around the mean (i.e. the solid-coloured line). Note that panel (a) contains data from the MOP-L filter, and panel (b) contains data from the MOP-I filter. The coloured-marker data do not include ellipticity corrections, whereas the black-marker data have all instrumental corrections implemented. |
MOPTOP observing log for the TDE candidates.
Galactic ISM properties of each TDE line of sight.
MOPTOP polarisation measurements of the TDE candidates.
MOSFiT results for the TDEs analysed in this work (and AT2020mot).
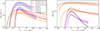 |
Fig. A.6. MOSFiT blackbody models for the TDEs analysed in this work (see Table A.4). The solid curves show the median model, and the shaded regions indicate the 16–84th percentile credible intervals. All light curves are aligned so that trest = 0 at the epoch of peak blackbody luminosity (tLmax). |
All Tables
All Figures
|
Fig. 1. ZTF and ATLAS (Tonry et al. 2018; Shingles et al. 2021) optical light curves of (a) AT2019aalc, (b) AT2020afhd, (c) AT2024bgz, (d) AT2024pvu, and (e) AT2024wsd, for filters ZTF g (420 − 540 nm), r (570 − 720 nm), and i (720 − 880 nm), and ATLAS c (420 − 650 nm) and o (560 − 820 nm). The ZTF data are binned into fixed time windows of 7 days in the observer rest frame. In the bottom panels, we show the MOPTOP polarisation in the MOP-L (400 − 700 nm) and MOP-I filters (700 − 1000 nm), corrected for Galactic ISM and the host galaxy. Note that the polarisation angle θ = 0° is equivalent to θ = 180° and that epochs with Pobs/σP < 3 are treated as 2σ upper limits (empty markers). For these the polarisation angles are not shown (see them in Table A.3). For AT2019aalc the vertical dotted black lines correspond to the flux maxima of the QPOs; see details in Section 5.1.3. |
| In the text | |
|
Fig. 2. ZTF r-band light curves of the TDE candidates analysed in this work, binned to 7 days in the rest frame and time-shifted to optical peak brightness (t0). The absolute magnitudes are calculated as Mr = mr − 5log10(d/10)−K(z)−Ar, where mr is the apparent magnitude, d is the luminosity distance in parsecs, Ar accounts for Galactic extinction. We assume a uniform K-correction: K = 2.5log10(1 + z). Bottom panel: Colour evolution corrected for Galactic extinction and host galaxy contribution. |
| In the text | |
|
Fig. 3. Rest-frame polarisation measurements of thermal TDEs (Patra et al. 2022; Leloudas et al. 2022), BFs, and the extreme coronal line emitter AT2022fpx (Koljonen et al. 2024). Time is scaled by each event’s rise time to peak bolometric luminosity to remove the primary timing dependencies on SMBH and stellar mass (i.e. |
| In the text | |
|
Fig. 4. Polarisation measurements of thermal TDEs, BFs and the extreme coronal line emitter AT2022fpx as a function of (a) the Eddington-scaled blackbody luminosity and (b) photospheric radius scaled by gravitational radius. Both were evaluated at the time of the polarimetric observations using MOSFiT blackbody fits to ZTF photometry. |
| In the text | |
|
Fig. 5. Eddington-scaled blackbody luminosity of thermal TDEs, BFs, and the extreme coronal line emitter AT2022fpx as a function of photospheric radius normalised by gravitational radius. Both were evaluated at the time of the maximum polarisation (Pmax) of each event. The marker colour indicates the maximum polarisation degree measured for each event. |
| In the text | |
|
Fig. 6. Rest-frame ZTF g and r light curves of the two flares of AT2019aalc, binned to 1 day, time-shifted to the optical peak (t0), and normalized to their respective peak fluxes (F0). |
| In the text | |
|
Fig. 7. ZTF light curves of the repeating (a) AT2019aalc and (b) AT2020afhd, binned to 14 days. Bottom panel: Colour evolution corrected for Galactic extinction and host galaxy contributions. For (a) AT2019aalc the shaded grey regions indicate light curve segments corresponding to flux dips before the flares identified by Bayesian blocks at significance levels of 34σ (first) and 8σ (second). For (b) AT2020afhd the 30σ flux excess is shown in red. |
| In the text | |
|
Fig. 8. Lomb-Scargle periodograms of AT2019aalc from ZTF forced photometry, binned to 1-day intervals. Panel (a): Periodograms for the first flare of AT2019aalc, using data from the time of its peak up to the onset of the next flare (58700 − 59900 MJD). To account for the underlying fading of the continuum beyond the first flare, we subtracted a fourth-degree polynomial fit. Panel (b): Periodograms of the second flare of AT2019aalc (60200 − 60730 MJD). In this case, a second-degree polynomial was subtracted to remove the continuum. Uncertainties of the period (T) correspond to the FWHM of the detected peaks. The horizontal dotted lines represent the 3σ false-alarm probability thresholds, estimated via bootstrapping. Note that none of the peaks in the i-band light curve of the first flare exceeded 3σ and were thus excluded. |
| In the text | |
|
Fig. A.1. Time series of the MOPTOP instrumental zero points (qinst, uinst) for the (a) MOP-L and (b) MOP-I filters. The unpolarised stars used for the determination of these zero points are GD 319, BD +32 3739, and HD 14069. The grey lines correspond to the mean instrumental offset and the shaded grey regions to its standard deviation. The S/N panel corresponds to the target average signal-to-noise ratio. |
| In the text | |
|
Fig. A.2. MOPTOP instrumental depolarisation for the (a) MOP-L and (b) MOP-I filters. The Pref is the polarisation degree of BD +64 106, VI Cyg 12, HD 251204, HD 155197, and HILT 960 reported in Turnshek et al. (1990), Schmidt et al. (1992), Weitenbeck (1999), and P is that measured with the MOPTOP. The dotted line represents the 1:1 relation. The solid lines are linear fits to the data, i.e. P = Pref D, where D is the depolarisation factor. Coloured-marker data (Dc) do not include ellipticity corrections, and black-marker data (Dϵ) are corrected for ellipticity. |
| In the text | |
|
Fig. A.3. Stokes parameters of the polarised standards as measured with the MOPTOP and the MOP-L filter. The solid circles correspond to the catalogue polarisation degree (Turnshek et al. 1990; Schmidt et al. 1992; Weitenbeck 1999), and the dotted lines mark the (q, u) = (0, 0). The three figures show (a) data corrected only for the instrumental offset (qinst, uinst), (b) data corrected for ellipticity (a, b, ψ), and (c) data additionally corrected via depolarisation (Dϵ), as well as the angle rotation induced by the Liverpool Telescope (θtel) and MOPTOP (θinst). |
| In the text | |
|
Fig. A.4. Stokes parameters of the polarised standards as measured with the MOPTOP and the MOP-I filter. See the caption of Figure A.3 for more details. |
| In the text | |
|
Fig. A.5. Upper five panels: Polarisation-degree time series of the polarised standards, BD +64 106 (Ps1), HD 155197 (Ps2), HD 251204 (Ps3), HILT 960 (Ps4), and VI Cyg 12 (Ps5). The dotted black lines indicate the catalogue polarisation, and the shaded regions represent the standard deviation around the mean. Bottom panels: Instrumental offset of the polarisation angle (θinst). The shaded regions represent the standard deviation around the mean (i.e. the solid-coloured line). Note that panel (a) contains data from the MOP-L filter, and panel (b) contains data from the MOP-I filter. The coloured-marker data do not include ellipticity corrections, whereas the black-marker data have all instrumental corrections implemented. |
| In the text | |
|
Fig. A.6. MOSFiT blackbody models for the TDEs analysed in this work (see Table A.4). The solid curves show the median model, and the shaded regions indicate the 16–84th percentile credible intervals. All light curves are aligned so that trest = 0 at the epoch of peak blackbody luminosity (tLmax). |
| In the text | |
Current usage metrics show cumulative count of Article Views (full-text article views including HTML views, PDF and ePub downloads, according to the available data) and Abstracts Views on Vision4Press platform.
Data correspond to usage on the plateform after 2015. The current usage metrics is available 48-96 hours after online publication and is updated daily on week days.
Initial download of the metrics may take a while.