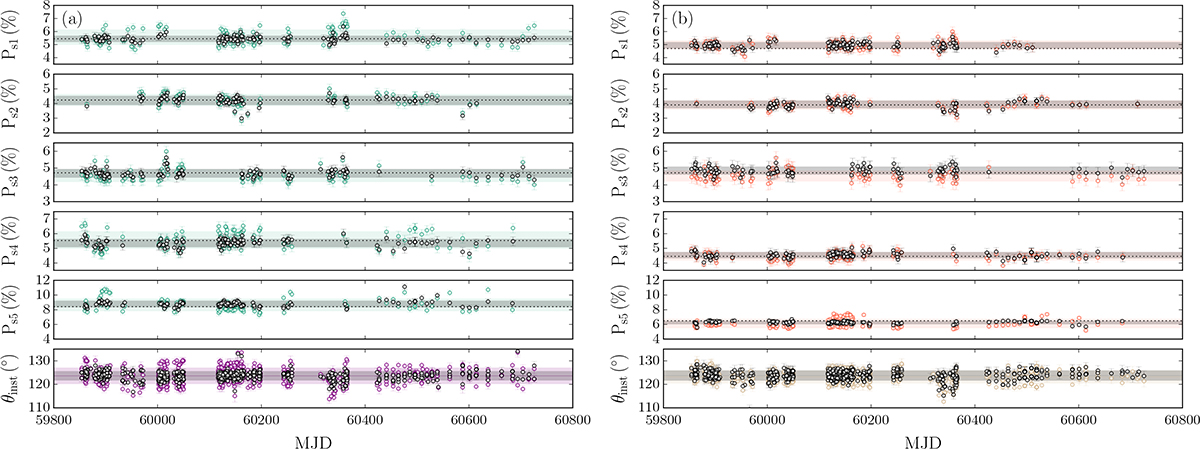
Fig. A.5.
Download original image
Upper five panels: Polarisation-degree time series of the polarised standards, BD +64 106 (Ps1), HD 155197 (Ps2), HD 251204 (Ps3), HILT 960 (Ps4), and VI Cyg 12 (Ps5). The dotted black lines indicate the catalogue polarisation, and the shaded regions represent the standard deviation around the mean. Bottom panels: Instrumental offset of the polarisation angle (θinst). The shaded regions represent the standard deviation around the mean (i.e. the solid-coloured line). Note that panel (a) contains data from the MOP-L filter, and panel (b) contains data from the MOP-I filter. The coloured-marker data do not include ellipticity corrections, whereas the black-marker data have all instrumental corrections implemented.
Current usage metrics show cumulative count of Article Views (full-text article views including HTML views, PDF and ePub downloads, according to the available data) and Abstracts Views on Vision4Press platform.
Data correspond to usage on the plateform after 2015. The current usage metrics is available 48-96 hours after online publication and is updated daily on week days.
Initial download of the metrics may take a while.