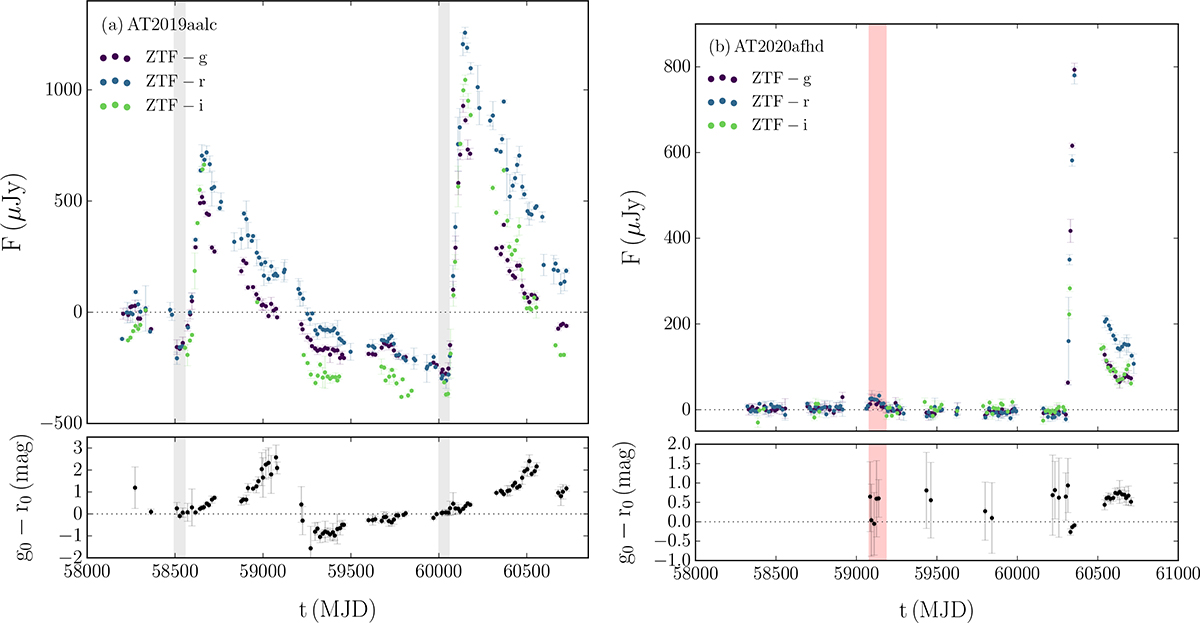
Fig. 7.
Download original image
ZTF light curves of the repeating (a) AT2019aalc and (b) AT2020afhd, binned to 14 days. Bottom panel: Colour evolution corrected for Galactic extinction and host galaxy contributions. For (a) AT2019aalc the shaded grey regions indicate light curve segments corresponding to flux dips before the flares identified by Bayesian blocks at significance levels of 34σ (first) and 8σ (second). For (b) AT2020afhd the 30σ flux excess is shown in red.
Current usage metrics show cumulative count of Article Views (full-text article views including HTML views, PDF and ePub downloads, according to the available data) and Abstracts Views on Vision4Press platform.
Data correspond to usage on the plateform after 2015. The current usage metrics is available 48-96 hours after online publication and is updated daily on week days.
Initial download of the metrics may take a while.