Fig. 8.
Download original image
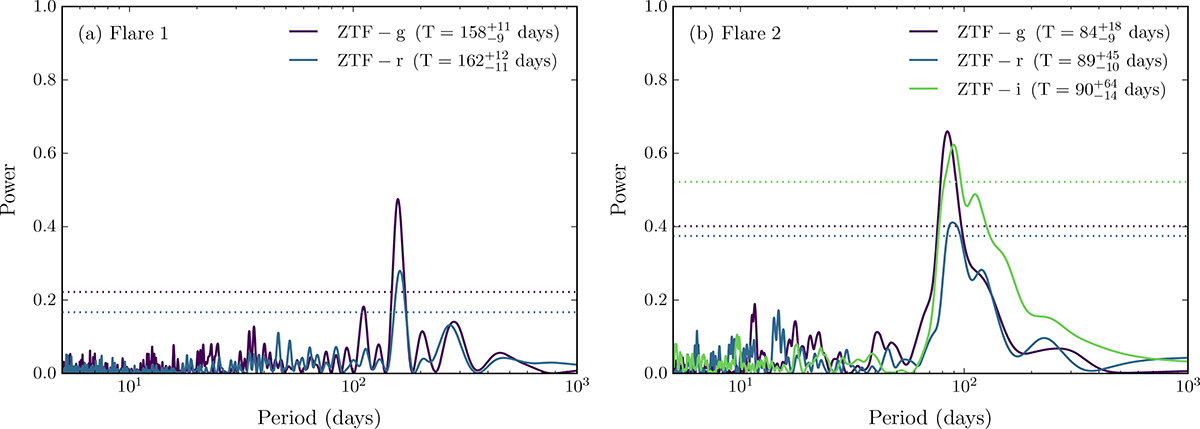
Lomb-Scargle periodograms of AT2019aalc from ZTF forced photometry, binned to 1-day intervals. Panel (a): Periodograms for the first flare of AT2019aalc, using data from the time of its peak up to the onset of the next flare (58700 − 59900 MJD). To account for the underlying fading of the continuum beyond the first flare, we subtracted a fourth-degree polynomial fit. Panel (b): Periodograms of the second flare of AT2019aalc (60200 − 60730 MJD). In this case, a second-degree polynomial was subtracted to remove the continuum. Uncertainties of the period (T) correspond to the FWHM of the detected peaks. The horizontal dotted lines represent the 3σ false-alarm probability thresholds, estimated via bootstrapping. Note that none of the peaks in the i-band light curve of the first flare exceeded 3σ and were thus excluded.
Current usage metrics show cumulative count of Article Views (full-text article views including HTML views, PDF and ePub downloads, according to the available data) and Abstracts Views on Vision4Press platform.
Data correspond to usage on the plateform after 2015. The current usage metrics is available 48-96 hours after online publication and is updated daily on week days.
Initial download of the metrics may take a while.