Fig. 4
Download original image
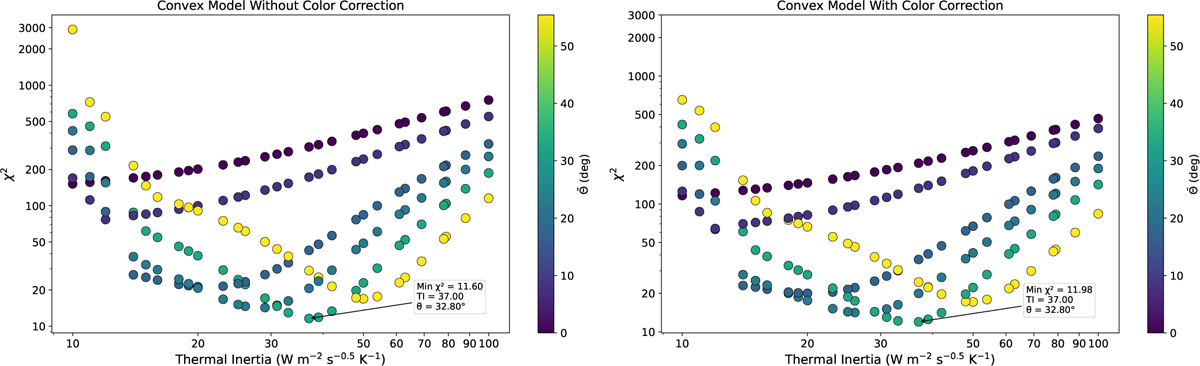
Comparison of thermophysical model fits using the convex shape of asteroid Oersted without (left) and with (right) color correction. The plot shows the chi-square (χ2) as a function of thermal inertia for various levels of surface roughness, characterized by the mean surface slope angle, θ̄. Each curve corresponds to a different roughness value, as indicated in the legend. The best-fit thermal inertia is Γ = 37 J m−2 s−1/2 K−1 in both cases. Color correction leads to a marginal decrease in the fit quality, increasing the minimum χ2 from 1.66 to 1.71, but it does not significantly affect the derived physical parameters.
Current usage metrics show cumulative count of Article Views (full-text article views including HTML views, PDF and ePub downloads, according to the available data) and Abstracts Views on Vision4Press platform.
Data correspond to usage on the plateform after 2015. The current usage metrics is available 48-96 hours after online publication and is updated daily on week days.
Initial download of the metrics may take a while.