| Issue |
A&A
Volume 704, December 2025
|
|
|---|---|---|
| Article Number | A67 | |
| Number of page(s) | 8 | |
| Section | Planets, planetary systems, and small bodies | |
| DOI | https://doi.org/10.1051/0004-6361/202556313 | |
| Published online | 08 December 2025 | |
Physical characterization of asteroid (16583) Oersted combining stellar occultation and photometric data
1
Charles University, Faculty of Mathematics and Physics, Institute of Astronomy,
V Holešovickách 2,
18000,
Prague 8,
Czech Republic
2
Université Côte d’Azur, CNRS-Lagrange, Observatoire de la Côte d’Azur,
CS 34229,
06304
Nice Cedex 4,
France
3
School of Physics and Astronomy, University of Leicester,
Leicester
LE1 7RH,
UK
4
Department of Physics, The Catholic University of America,
Washington,
DC
20064,
USA
5
Astrophysics Science Division,
NASA Goddard Space Flight Center,
Greenbelt,
MD
20771,
USA
6
Center for Research and Exploration in Space Science and Technology, NASA/GSFC,
Greenbelt,
MD
20771,
USA
7
SETI Institute, Carl Sagan Center,
189 Bernado Avenue,
Mountain View,
CA
94043,
USA
8
Unistellar,
5 allé Marcel Leclerc, bâtiment B,
13008
Marseille,
France
★ Corresponding author: This email address is being protected from spambots. You need JavaScript enabled to view it.
Received:
8
July
2025
Accepted:
5
October
2025
Abstract
Context. We report a successful observation of a stellar occultation by asteroid (16583) Oersted, which provides a detailed physical characterization of its shape, spin state, and surface properties.
Aims. Our goal is to determine the physical parameters of Oersted by combining multi-chord occultation timing, sparse optical photometry, and thermal infrared observations. Asteroids of this size (~20 km) are rarely modeled in such detail due to observational limitations, making Oersted a valuable case study.
Methods. We applied convex light curve inversion to sparse photometric data to derive an initial shape and spin state. We then refined and scaled this model using non-convex shape modeling with the All-Data Asteroid Modelling (ADAM) algorithm, incorporating constraints from the occultation chord profile. Thermophysical modeling based on WISE thermal infrared fluxes was used to determine the asteroid’s effective diameter, geometric albedo, and thermal inertia.
Results. The non-convex shape model reveals localized surface concavities and provides a size estimate consistent with radiometric measurements. The derived thermal inertia is typical for asteroids of comparable size.
Conclusions. This work demonstrates the effectiveness of combining stellar occultations, photometry, and thermal infrared data for asteroid modeling and highlights the valuable contributions of citizen scientists, who played a key role in capturing the occultation and constraining the profile of the asteroid.
Key words: methods: observational / techniques: photometric / minor planets, asteroids: individual: (16583) Oersted
© The Authors 2025
 Open Access article, published by EDP Sciences, under the terms of the Creative Commons Attribution License (https://creativecommons.org/licenses/by/4.0), which permits unrestricted use, distribution, and reproduction in any medium, provided the original work is properly cited.
This article is published in open access under the Subscribe to Open model. This email address is being protected from spambots. You need JavaScript enabled to view it. to support open access publication.
1 Introduction
Asteroids are remnants of the early Solar System and preserve key information about its dynamical and compositional evolution. Physical characterization, including determination of shape, size, spin state, surface roughness, and thermal properties, is essential to understand both their origin and evolution histories in the context of the overall asteroid population and its various subpopulations.
Various observational techniques have been developed to retrieve these physical parameters of asteroids, including radar imaging (Ostro et al. 2002), direct spacecraft reconnaissance (Thomas et al. 1996), adaptive optics (Viikinkoski et al. 2018), thermal infrared observations Delbo’ et al. (2007), and photometric light curves (Kaasalainen et al. 2002). Among groundbased methods, stellar occultations and light curve inversion stand out because of their accessibility, cost-efficiency, and complementarity. Disk-integrated photometric light curves are particularly effective at constraining the rotation period and general shape of an asteroid through convex inversion methods (Kaasalainen & Torppa 2001; Kaasalainen et al. 2001), while stellar occultations provide direct measurements of the asteroid’s silhouette in the plane of the sky, enabling precise size estimation and detection of non-convex features (Ďurech et al. 2011; Herald et al. 2020). Therefore, these two methods complement each other and can be used to obtain a size-calibrated non-convex model for, in principle, any observable asteroid.
A stellar occultation occurs when an asteroid passes in front of a star, momentarily blocking its light for observers located within a narrow ground track. The timing of these events from multiple stations can be used to reconstruct a twodimensional projection of the asteroid’s shape at a known rotational phase. High-precision star positions from Gaia astrometry (Gaia Collaboration 2022) have improved the accuracy of occultation path predictions. This improvement makes coordinated multi-chord observations of a single asteroid during one night more feasible and scientifically productive.
Stellar occultation observations have long been the domain of dedicated citizen astronomers, who contribute valuable scientific data using their own equipment, time, and resources. The International Occultation Timing Association (IOTA) and the Occult software package1 are central to this community, providing the coordination and tools necessary to plan, observe, and analyze occultation events. In recent years, a new group of contributors has emerged through the deployment of eVscope telescopes, which are smart, connected instruments operated by members of the Unistellar Network2 (Marchis 2020). This global network of citizen astronomers, coordinated by the SETI Institute, has begun contributing to stellar occultation campaigns. In 2024, the Unistellar Network recorded approximately 400 occultation observations. While this is still a small fraction compared to the more than 4000 observations reported by IOTA observers (Herald 2025), it represents a growing complementary effort.
In this work, we present a comprehensive physical characterization of asteroid (16583) Oersted (hereafter referred to simply as Oersted), based on a multi-chord stellar occultation observed on March 3, 2024, sparse photometric data from various surveys, and thermal infrared fluxes from the WISE satellite (Wright et al. 2010). Oersted is a relatively small main-belt asteroid with a diameter of approximately 20 km. Due to their small angular extent, such asteroids cannot be resolved by adaptive optics or radar imaging, making indirect techniques critical. Our results contribute new constraints on the shape, spin axis, and thermal inertia in this underrepresented population, where reliable thermal inertia values are especially scarce.
Our methodology integrates convex light curve inversion, non-convex shape modeling using the All-Data Asteroid Modelling (ADAM) algorithm (Viikinkoski et al. 2015), and thermophysical modeling based on the approach of Lagerros (1996) as implemented in Delbo’ (2004); Hanuš et al. (2018); Hung et al. (2022). In particular, we demonstrate the value of combining stellar occultations and photometry to scale shape models, resolve spin-state ambiguities, and constrain surface properties such as thermal inertia and albedo. We also highlight the contribution of citizen scientists, whose key role in capturing the occultation made it possible to constrain the asteroid’s profile.
2 Data
2.1 Sparse photometry
To derive the rotational properties of asteroid Oersted, we used relevant sparse-in-time photometric observations. These data were collected from several large-scale sky surveys, including the Catalina Sky Survey (CSS; Larson et al. 2003), the Asteroid Terrestrial-impact Last Alert System (ATLAS; Tonry et al. 2018), the All-Sky Automated Survey for Supernovae (ASAS-SN; Shappee et al. 2014; Kochanek et al. 2017; Hanuš et al. 2021), Gaia Data Release 3 (GaiaDR3; Tanga et al. 2023), the Zwicky Transient Facility (ZTF; Bellm et al. 2019), and the Panoramic Survey Telescope and Rapid Response System (Pan-STARRS). The photometric points were retrieved from the Minor Planet Center (MPC) and the Asteroids - Dynamic Site (AstDyS) databases and span multiple apparition epochs, providing sufficient coverage in aspect and illumination geometry for light curve inversion techniques. The data were processed using the pipeline described in Hanuš et al. (2021). A detailed fit of these data to our best-fit convex shape model is shown in Appendix A.
Although sparse photometry does not allow high-resolution light curve modeling for individual apparitions, it is effective in constraining rotation periods and spin axis orientations when combined across multiple epochs (e.g., Hanuš et al. 2011). In this study, the sparse data formed the basis for our initial convex inversion and provided the spin-state solution used in subsequent non-convex modeling.
2.2 Stellar occultation
A stellar occultation by asteroid Oersted occurred on March 3, 2024, involving a target star with apparent magnitude V = 8.7. The event was successfully recorded by fourteen observing stations located in the Czech Republic and Latvia, resulting in thirteen positive detections and one negative detection (miss). Two of the detections were obtained at the same observing site in Plzeň—Lhota: one using video and one visually. The visual observation was included in the analysis with a manually applied time offset to align it with the video-derived timings (the Occult software already provides the chord with this offset). Additionally, the observation from Strašice shows a grazing occultation, in which the star was briefly occulted twice (and thus treated as two separate chords), likely due to local topographic features on the asteroid’s limb. Finally, the chord observed by L. Winkler, with an uncertainty of 0.3s, is markedly shorter than the neighboring chords. We therefore excluded it from the shape modeling, as it likely adds no meaningful constraint relative to the other observations. This event provided a dense chord coverage across the asteroid’s silhouette, making it one of the most successful stellar occultations of 2024.
The occultation data were downloaded in XML format from the Occult software maintained by D. Herald. Occult is a widely used tool to predict and reduce occultation events, providing standardized timing and geometry data. The occultation data archive is periodically backed up at NASA’s Planetary Data System Small Bodies Node3 with the most recent version being (Herald et al. 2024). Table 1 summarizes the observing stations, recorded timings, and associated uncertainties. The occultation chords were extracted from individual video, CCD, or CMOSbased recordings using Tangra4, PyMovie5, or the Unistellar Network pipeline (observation by Josef Hanuš) and converted into a format compatible with shape modeling following the procedure of Ďurech et al. (2011).
The predicted shadow path, based on Gaia DR3 stellar positions and the JPL#54 ephemeris, was in excellent agreement with the observations.
2.3 Thermal infrared data
Thermal infrared observations of Oersted were obtained from the WISE space telescope in the 12 and 22 μm bands (Wright et al. 2010). The data were downloaded from the NASA/IPAC Infrared Science Archive6 and filtered to include only high-quality detections with a signal-to-noise ratio (S/N) greater than 5 (Hanuš et al. 2015). In total, five epochs include measurements in both filters, while two additional epochs contain data in only one filter. These thermal fluxes were used as input to our thermophysical modeling (TPM) to derive the asteroid’s effective diameter, thermal inertia, and geometric visible albedo.
3 Methods
To characterize the physical properties of asteroid Oersted, we combined photometric light curve data with multi-chord stellar occultation observations. The analysis followed a three-step approach: convex light curve inversion, non-convex shape modeling using ADAM, and thermophysical modeling using WISE data.
Summary of Oersted stellar occultation observations.
3.1 Convex light curve inversion
We first applied the light curve inversion technique of Kaasalainen & Torppa (2001); Kaasalainen et al. (2001) to the available disk-integrated photometric data. The dataset includes sparse-in-time photometry from Gaia DR3, ASAS-SN, ATLAS, Pan-STARRS, ZTF, and Catalina Sky Survey (see Sect. 2.1 and Appendix A).
The period search (Fig. 2) reveals a well-defined global minimum corresponding to a sidereal rotation period of P = 4.95663 hours, representing the first determination of Oersted’s rotational period. While convex light curve inversion typically yields two mirror pole solutions due to geometric ambiguity, only a single pole solution was identified in this case (Table 3). This uniqueness can likely be attributed to the relatively high orbital inclination of Oersted (i = 22.6°), which reduces the pole degeneracy inherent in light curve inversion (Kaasalainen & Lamberg 2006).
3.2 Non-convex shape modeling with occultation constraints
To refine the shape model, we employed the ADAM algorithm (Viikinkoski et al. 2015), which supports shape modeling with direct fitting to the occultation profile. We converted the occultation timings (Table 1) into chords in the sky plane following the procedure described by Ďurech et al. (2011). The occultation was observed from 13 positive stations across Europe, providing strong constraints on the asteroid’s shape projection.
The ADAM algorithm was initialized with the convex shape and spin parameters from the light curve inversion and iteratively refined to fit both the photometric and occultation data (cf. Marciniak et al. 2023; Viikinkoski et al. 2017). We performed multiple ADAM runs using different initial meshes and regularization weights to assess the uncertainty in the derived size and topography. The fit to the occultation profile is shown in Fig. 1, and the resulting shape model in Fig. 3.
3.3 Thermophysical modeling
To derive the thermophysical properties of Oersted, we employed the TPM originally developed by Lagerros (1996) and later adapted by Delbo’ (2004); Hanuš et al. (2018); Hung et al. (2022). The TPM uses the asteroid’s shape and spin state as input and fits observed thermal infrared fluxes, specifically from the WISE mission at 12 and 22 μm bands (Wright et al. 2010). The model searches a grid of thermal inertia values (Γ), surface roughness parameters (mean slope angle θ̄), and geometric albedo (pv), minimizing the χ2 between synthetic and observed fluxes.
We investigated three thermophysical modeling configurations:
Convex model without color correction: the TPM was first applied to the convex shape derived from light curve inversion, with the size treated as a free parameter. This model does not account for concavities or mutual heating effects but serves as a benchmark.
Convex model with color correction: a second run employed the same convex model but included color correction for thermal emissivity. The effect on the best-fit parameters was small, with a negligible impact on thermal inertia or fit quality compared to the run without color correction.
Non-convex ADAM model (no color correction): we also applied the TPM to the non-convex ADAM shape model without color correction. The current TPM implementation for non-convex geometries does not correctly handle this correction, and addressing the issue is beyond the scope of this study. However, our comparison with the convex case shows that omitting color correction has a negligible effect; therefore, we proceeded without it for the ADAM-based TPM.
All models assumed a Bond albedo of A = 0.02, derived from the volume-equivalent diameter obtained via ADAM modeling and the absolute magnitude H = 12.28 from the MPC. The geometric albedo pv was calculated using the standard relation ![Mathematical equation: $p_V = \left[\frac{1329}{D\,(\mathrm{km})} \times 10^{-H/5}\right]^2$](/articles/aa/full_html/2025/12/aa56313-25/aa56313-25-eq1.png) , and the Bond albedo was then computed as A = q pv, where the phase integral q was estimated using a slope parameter of G = 0.15 (also from the MPC). The TPM analysis was performed over a grid of thermal inertia and surface roughness values. A summary of the resulting parameters is provided in Table 2.
, and the Bond albedo was then computed as A = q pv, where the phase integral q was estimated using a slope parameter of G = 0.15 (also from the MPC). The TPM analysis was performed over a grid of thermal inertia and surface roughness values. A summary of the resulting parameters is provided in Table 2.
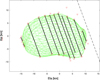 |
Fig. 1 Observed occultation chords (black line segments) from the March 3, 2024 event, projected onto the sky plane, together with the best-fit non-convex ADAM shape model of asteroid Oersted (gray silhouette) at the corresponding rotational phase. Each chord represents the stellar disappearance and reappearance as seen from a specific observer location listed in Table 1. The model silhouette is scaled and oriented to minimize residuals between the chord endpoints and the projected shape boundary. The close match demonstrates the validity of the shape and spin solution. |
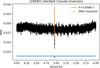 |
Fig. 2 Periodogram of asteroid Oersted based on sparse photometric data. The global minimum, corresponding to a sidereal rotation period of Psid = 4.956677 hours, is indicated by the vertical line. The horizontal solid blue line marks the adopted threshold for the χ2 values used to evaluate the uniqueness of the period solutions. |
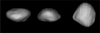 |
Fig. 3 Non-convex shape model of asteroid Oersted reconstructed using the ADAM algorithm. The model was scaled to match the stellar occultation chords observed on March 3, 2024. Including occultation data makes it possible to resolve surface concavities and the overall elongation of the body. Three viewing perspectives are shown: the first two are equator-on views separated by 90° in longitude, and the third is a poleon view. |
4 Results
4.1 Spin state and shape
The convex light curve inversion and the ADAM modeling both converge on a consistent sidereal rotation period of P = 4.95664 ± 0.00001 h. The derived pole solutions exhibit very similar ecliptic latitudes (β) but differ slightly in ecliptic longitude (λ). This discrepancy is not significant, as the pole latitude is close to β ≈ 90°, a region where small angular separations correspond to large changes in longitude due to the coordinate system geometry. As a result, the total angular separation between the two solutions remains within 5°, consistent with typical uncertainties in pole determination.
The resulting non-convex shape model (Fig. 3) reveals localized surface concavities and a slightly elongated body with axis ratios of approximately 1.00:0.87:0.72. The volume-equivalent diameter derived from the ADAM model is D = 21.7 ± 1.0 km, and the projected silhouette matches the occultation profile within the chord timing uncertainties (Fig. 1).
The shape model, spin-state parameters, and optical photometric data are available from the Database of Asteroid Models from Inversion Techniques (DAMIT7, Ďurech et al. 2010).
4.2 Thermal properties
The thermophysical modeling results for asteroid Oersted are summarized in Table 2. All configurations yield consistent sizes, with the volume-equivalent diameter ranging from 20.9 to 21.8 km and the geometric visible albedo fixed at pv = 0.046.
For the convex model without color correction, the best-fit thermal inertia is Γ = 37 J m−2 s−1/2 K−1 and the mean surface slope is θ̄ = 32.8°, with a reduced χ2 of 1.66. Including the color correction increases the χ2 slightly to 1.71 but does not significantly affect the thermal parameters, indicating that color correction has only a minor impact (Oersted is a C-type asteroid, possibly with a flat spectrum). We show the fit comparison in Fig. 4.
For the non-convex ADAM shape model (without color correction), the best-fit thermal inertia remains Γ = 37 J m−2 s−1/2 K−1 (Fig. 5), as does the roughness θ = 32.8°. The fit quality is slightly poorer, with a reduced χ2 of 2.00. Although color correction was not applied due to implementation limitations, a prior test using the convex model suggests that its effect is negligible.
These results confirm that the derived thermophysical properties are robust across modeling approaches, with thermal inertia values typical of main-belt asteroids of similar size (Delbo’ et al. 2015). The slightly elevated surface roughness inferred from the non-convex model is plausible, given the presence of concavities resolved in the ADAM shape.
Comparison of thermophysical properties of asteroid Oersted derived from three TPM configurations.
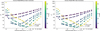 |
Fig. 4 Comparison of thermophysical model fits using the convex shape of asteroid Oersted without (left) and with (right) color correction. The plot shows the chi-square (χ2) as a function of thermal inertia for various levels of surface roughness, characterized by the mean surface slope angle, θ̄. Each curve corresponds to a different roughness value, as indicated in the legend. The best-fit thermal inertia is Γ = 37 J m−2 s−1/2 K−1 in both cases. Color correction leads to a marginal decrease in the fit quality, increasing the minimum χ2 from 1.66 to 1.71, but it does not significantly affect the derived physical parameters. |
Derived rotation states of asteroid Oersted from convex inversion and ADAM modeling.
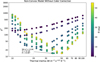 |
Fig. 5 Thermophysical model fit for asteroid Oersted using the nonconvex ADAM shape model. The plot shows the chi-square (χ2) as a function of thermal inertia for various levels of surface roughness, characterized by the mean surface slope angle, θ̄. Each curve corresponds to a different roughness value, as indicated in the legend. The best-fit solution corresponds to Γ = 37 J m−2 s−1/2 K−1 and θ̄ = 32.8°, with a minimum reduced χ2 of 2.00. |
5 Discussion
The non-convex model, derived from the ADAM algorithm, shows localized topography, including potential concavities that could not be detected by convex methods alone.
Our thermophysical modeling results are in excellent agreement with the radiometric estimates published by Masiero et al. (2011), who derived a volume-equivalent diameter of 22.10 ± 0.22 km and a geometric visible albedo of pv = 0.045 for Oersted using NEOWISE thermal infrared data and a standard thermal model. However, the quoted relative uncertainty of ~1% is unrealistically low, as noted by Mainzer et al. (2016) and further supported by Herald et al. (2020), who compared radiometric diameters with independent stellar occultation measurements for 219 asteroids. Therefore, in practice, radiometric diameters typically carry uncertainties of at least 10% owing to limitations in shape, thermal properties, and observation geometry. The values derived from our convex and non-convex shape models (D = 20.9-21.8 km and pv = 0.046) are fully consistent with the NEOWISE estimates, providing an important cross-validation of both modeling approaches. This close match supports the robustness of our shape models and confirms that even when self-heating effects are incorporated, the derived size and albedo remain stable. This agreement strengthens confidence in the use of occultation-constrained shape modeling combined with thermophysical analysis as a reliable alternative to classical radiometric methods.
The thermophysical properties derived for Oersted, particularly the thermal inertia Γ =  J m−2 s −1/2 K−1 (we adopt the solution with the non-convex shape), are consistent with values typically found among similarly sized main-belt asteroids (Delbo’ et al. 2015; Hung et al. 2022; Novaković et al. 2024). This moderate thermal inertia suggests that the surface is likely covered by a layer of coarse-grained or compact regolith, rather than fine dust (TI<20) or bare rock (TI>500). Such a surface structure would allow partial heat retention between day-night cycles, but without the extremely low conductivity associated with very fine-grained regolith or the high conductivity of exposed rock.
The agreement in effective diameter between the thermophysical model and the occultation-constrained ADAM shape confirms the reliability of both approaches. While the flux color correction was not included in the non-convex TPM due to implementation limitations, the use of the ADAM model still provides a more physically realistic surface representation. The consistency in diameter and fit quality across modeling setups highlights the importance of including detailed shape information when interpreting thermal infrared fluxes, especially for asteroids with resolved topographic features.
These results further demonstrate the synergy between light curve inversion, stellar occultations, and thermal infrared data in producing physically realistic asteroid models. For objects such as Oersted, where multi-chord occultations and quality photometry are available, the combination of methods enables not only accurate shape reconstruction but also meaningful constraints on surface composition and thermal behavior.
6 Conclusions
We have presented a comprehensive physical characterization of asteroid Oersted based on multi-chord stellar occultation data, disk-integrated photometry, and thermal infrared observations (see Tables 2 and 3). Asteroids in this size range (D ~ 20 km) are rarely modeled in such detail due to observational limitations, making Oersted a valuable case study.
Our analysis combines convex light curve inversion, nonconvex shape modeling using the ADAM algorithm, and thermophysical modeling constrained by WISE data. The resulting shape model resolves surface concavities, while the derived size and thermal properties are consistent with expectations for a mid-sized main-belt asteroid with a moderately compact regolith.
Crucially, this study demonstrates the power of combining complementary datasets - particularly occultations and light curves - to produce high-fidelity asteroid models. The successful inclusion of data from citizen astronomers underscores the growing potential of distributed observing campaigns to contribute valuable constraints in planetary science and highlights the role of community-driven efforts in advancing our understanding of small bodies in the Solar System.
Multi-chord occultation observations remain a key tool for constraining asteroid shapes and sizes. The growing availability of automated telescopes, such as those in the Unistellar Network, offers a promising opportunity to increase the frequency and spatial coverage of these events. Future efforts should focus on better integrating this existing infrastructure into a broader, decentralized global network, so that coordination and data sharing for small body characterization are more efficient (Marchis et al. 2025).
Acknowledgements
We gratefully acknowledge all amateur and professional astronomers who recorded and submitted occultation observations used in this study. Their commitment of time and resources is essential to advance asteroid science. We also thank Dave Herald for his thorough review and constructive suggestions, which helped improve the quality and clarity of the manuscript. The grant 22-17783S of the Czech Science Foundation has supported this work. M.D. acknowledges support from France’s Centre national d’études spatiales (CNES). Part of this work was funded by a grant from the Gordon and Betty Moore Foundation #12285. P.P.’s research was supported by NASA’s Planetary Science Division Research Program, through ISFM work packages EIMM and Planetary Geodesy at NASA Goddard Space Flight Center, NASA award numbers 80GSFC24M0006 and 80NSSC21K0153.
References
- Bellm, E. C., Kulkarni, S. R., Graham, M. J., et al. 2019, PASP, 131, 018002 [Google Scholar]
- Delbo’, M. 2004, PhD thesis - Freie Univesitaet Berlin, Germany [Google Scholar]
- Delbo’, M., dell’Oro, A., Harris, A. W., Mottola, S., & Mueller, M. 2007, Icarus, 190, 236 [CrossRef] [Google Scholar]
- Delbo’, M., Mueller, M., Emery, J., Rozitis, B., & Capria, M. T. 2015, in Asteroids IV, ed. P. Michel, F. E. DeMeo, & W. F. Bottke (Tucson: The University of Arizona Press), 107 [Google Scholar]
- Ďurech, J., Sidorin, V., & Kaasalainen, M. 2010, A&A, 513, A46 [Google Scholar]
- Ďurech, J., Kaasalainen, M., Herald, D., et al. 2011, Icarus, 214, 652 [Google Scholar]
- Gaia Collaboration (Vallenari, A., Brown, et al.) 2022, A&A, 667, A1 [Google Scholar]
- Hanuš, J., Ďurech, J., Broz, M., et al. 2011, A&A, 530, A134 [NASA ADS] [CrossRef] [EDP Sciences] [Google Scholar]
- Hanuš, J., Delbo , M., Ďurech, J., & Alí-Lagoa, V. 2015, Icarus, 256, 101 [CrossRef] [Google Scholar]
- Hanuš, J., Delbo , M., Ďurech, J., & Alí-Lagoa, V. 2018, Icarus, 309, 297 [CrossRef] [Google Scholar]
- Hanuš, J., Pejcha, O., Shappee, B. J., et al. 2021, A&A, 654, A48 [NASA ADS] [CrossRef] [EDP Sciences] [Google Scholar]
- Herald, D. 2025, Personal Communication [Google Scholar]
- Herald, D., Gault, D., Anderson, R., et al. 2020, MNRAS, 499, 4570 [Google Scholar]
- Herald, D., Gault, D., Carlson, N., et al. 2024, Small Bodies Occultations Bundle V4.0, NASA Planetary Data System, urn:nasa:pds:smallbodiesoccultations::4.0 [Google Scholar]
- Hung, D., Hanuš, J., Masiero, J. R., & Tholen, D. J. 2022, Planetary Science journal, 3, 56 [Google Scholar]
- Kaasalainen, M., & Lamberg, L. 2006, Inverse Prob., 22, 749 [NASA ADS] [CrossRef] [Google Scholar]
- Kaasalainen, M., & Torppa, J. 2001, Icarus, 153, 24 [NASA ADS] [CrossRef] [Google Scholar]
- Kaasalainen, M., Torppa, J., & Muinonen, K. 2001, Icarus, 153, 37 [NASA ADS] [CrossRef] [Google Scholar]
- Kaasalainen, M., Mottola, S., & Fulchignoni, M. 2002, Asteroids III (Tucson: University of Arizona Press), 139 [Google Scholar]
- Kochanek, C. S., Shappee, B. J., Stanek, K. Z., et al. 2017, PASP, 129, 104502 [Google Scholar]
- Lagerros, J. S. V. 1996, A&A, 310, 1011 [Google Scholar]
- Larson, S., Beshore, E., Hill, R., et al. 2003, BAAS, 35, 982 [NASA ADS] [Google Scholar]
- Mainzer, A. K., Bauer, J. M., Cutri, R. M., et al. 2016, NASA Planetary Data System, 247 [Google Scholar]
- Marchis, F. 2020, AJ, 159, 123 [Google Scholar]
- Marchis, F., Esposito, T. M., Hanuš, J., et al. 2025, in EPSC-DPS Joint Meeting 2025, Helsinki, Finland, ePSC-DPS2025-1038 [Google Scholar]
- Marciniak, A., Ďurech, J., Choukroun, A., et al. 2023, A&A, 679, A60 [NASA ADS] [CrossRef] [EDP Sciences] [Google Scholar]
- Masiero, J. R., Mainzer, A. K., Grav, T., et al. 2011, ApJ, 741, 68 [Google Scholar]
- Novaković, B., Fenucci, M., Marčeta, D., & Pavela, D. 2024, Planet. Sci. J., 5, 11 [CrossRef] [Google Scholar]
- Ostro, S. J., Hudson, R. S., Benner, L. A. M., et al. 2002, Asteroids III (Tucson: University of Arizona Press), 151 [Google Scholar]
- Shappee, B. J., Prieto, J. L., Grupe, D., et al. 2014, ApJ, 788, 48 [Google Scholar]
- Tanga, P., Pauwels, T., Mignard, F., et al. 2023, A&A, 674, A12 [NASA ADS] [CrossRef] [EDP Sciences] [Google Scholar]
- Thomas, P. C., Belton, M. J. S., Carcich, B., et al. 1996, Icarus, 120, 20 [NASA ADS] [CrossRef] [Google Scholar]
- Tonry, J. L., Denneau, L., Heinze, A. N., et al. 2018, PASP, 130, 064505 [Google Scholar]
- Viikinkoski, M., Kaasalainen, M., & Ďurech, J. 2015, A&A, 576, A8 [NASA ADS] [CrossRef] [EDP Sciences] [Google Scholar]
- Viikinkoski, M., Hanuš, J., Kaasalainen, M., Marchis, F., & Ďurech, J. 2017, A&A, 607, A117 [NASA ADS] [CrossRef] [EDP Sciences] [Google Scholar]
- Viikinkoski, M., Vernazza, P., Hanuš, J., et al. 2018, A&A, 619, L3 [NASA ADS] [CrossRef] [EDP Sciences] [Google Scholar]
- Wright, E. L., Eisenhardt, P. R. M., Mainzer, A. K., et al. 2010, AJ, 140, 1868 [Google Scholar]
Appendix A Additional figures
To complement the main analysis presented in this work, we include in this appendix a series of diagnostic plots illustrating the quality of the photometric fits. These figures show the comparison between observed and modeled light curves for all sparse photometric datasets used in the shape and spin modeling of asteroid Oersted. The datasets include measurements from Gaia DR3, ASAS-SN, ATLAS, Pan-STARRS, ZTF, and the Catalina Sky Survey. Each figure consists of three panels per dataset, visualizing (i) the phase-folded light curve and corresponding model, (ii) residuals relative to the fitted phase function, and (iii) residuals relative to the normalized light curve. These plots serve to demonstrate the internal consistency of the light curve inversion results and the reliability of the shape model.
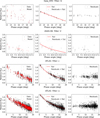 |
Fig. A.1 light curve fits of asteroid Oersted for sparse photometric datasets from Gaia DR3, ASAS-SN, and ATLAS (c and o filters). For each dataset, three panels are shown: (i) observed and model data, (ii) residuals relative to the fitted phase function, (iii) residuals relative to the normalized light curve model. The residuals illustrate the quality of the photometric calibration and the goodness of fit. |
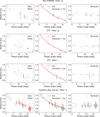 |
Fig. A.2 light curve fits of asteroid Oersted for sparse photometric datasets from Pan-STARRS, ZTF (g and r filters), and the Catalina Sky Survey. For each dataset, three panels are shown: (i) observed and model data, (ii) residuals relative to the fitted phase function, (iii) residuals relative to the normalized light curve model. The residuals illustrate the quality of the photometric calibration and the goodness of fit. |
All Tables
Comparison of thermophysical properties of asteroid Oersted derived from three TPM configurations.
Derived rotation states of asteroid Oersted from convex inversion and ADAM modeling.
All Figures
|
Fig. 1 Observed occultation chords (black line segments) from the March 3, 2024 event, projected onto the sky plane, together with the best-fit non-convex ADAM shape model of asteroid Oersted (gray silhouette) at the corresponding rotational phase. Each chord represents the stellar disappearance and reappearance as seen from a specific observer location listed in Table 1. The model silhouette is scaled and oriented to minimize residuals between the chord endpoints and the projected shape boundary. The close match demonstrates the validity of the shape and spin solution. |
| In the text | |
|
Fig. 2 Periodogram of asteroid Oersted based on sparse photometric data. The global minimum, corresponding to a sidereal rotation period of Psid = 4.956677 hours, is indicated by the vertical line. The horizontal solid blue line marks the adopted threshold for the χ2 values used to evaluate the uniqueness of the period solutions. |
| In the text | |
|
Fig. 3 Non-convex shape model of asteroid Oersted reconstructed using the ADAM algorithm. The model was scaled to match the stellar occultation chords observed on March 3, 2024. Including occultation data makes it possible to resolve surface concavities and the overall elongation of the body. Three viewing perspectives are shown: the first two are equator-on views separated by 90° in longitude, and the third is a poleon view. |
| In the text | |
|
Fig. 4 Comparison of thermophysical model fits using the convex shape of asteroid Oersted without (left) and with (right) color correction. The plot shows the chi-square (χ2) as a function of thermal inertia for various levels of surface roughness, characterized by the mean surface slope angle, θ̄. Each curve corresponds to a different roughness value, as indicated in the legend. The best-fit thermal inertia is Γ = 37 J m−2 s−1/2 K−1 in both cases. Color correction leads to a marginal decrease in the fit quality, increasing the minimum χ2 from 1.66 to 1.71, but it does not significantly affect the derived physical parameters. |
| In the text | |
|
Fig. 5 Thermophysical model fit for asteroid Oersted using the nonconvex ADAM shape model. The plot shows the chi-square (χ2) as a function of thermal inertia for various levels of surface roughness, characterized by the mean surface slope angle, θ̄. Each curve corresponds to a different roughness value, as indicated in the legend. The best-fit solution corresponds to Γ = 37 J m−2 s−1/2 K−1 and θ̄ = 32.8°, with a minimum reduced χ2 of 2.00. |
| In the text | |
|
Fig. A.1 light curve fits of asteroid Oersted for sparse photometric datasets from Gaia DR3, ASAS-SN, and ATLAS (c and o filters). For each dataset, three panels are shown: (i) observed and model data, (ii) residuals relative to the fitted phase function, (iii) residuals relative to the normalized light curve model. The residuals illustrate the quality of the photometric calibration and the goodness of fit. |
| In the text | |
|
Fig. A.2 light curve fits of asteroid Oersted for sparse photometric datasets from Pan-STARRS, ZTF (g and r filters), and the Catalina Sky Survey. For each dataset, three panels are shown: (i) observed and model data, (ii) residuals relative to the fitted phase function, (iii) residuals relative to the normalized light curve model. The residuals illustrate the quality of the photometric calibration and the goodness of fit. |
| In the text | |
Current usage metrics show cumulative count of Article Views (full-text article views including HTML views, PDF and ePub downloads, according to the available data) and Abstracts Views on Vision4Press platform.
Data correspond to usage on the plateform after 2015. The current usage metrics is available 48-96 hours after online publication and is updated daily on week days.
Initial download of the metrics may take a while.