Fig. 1
Download original image
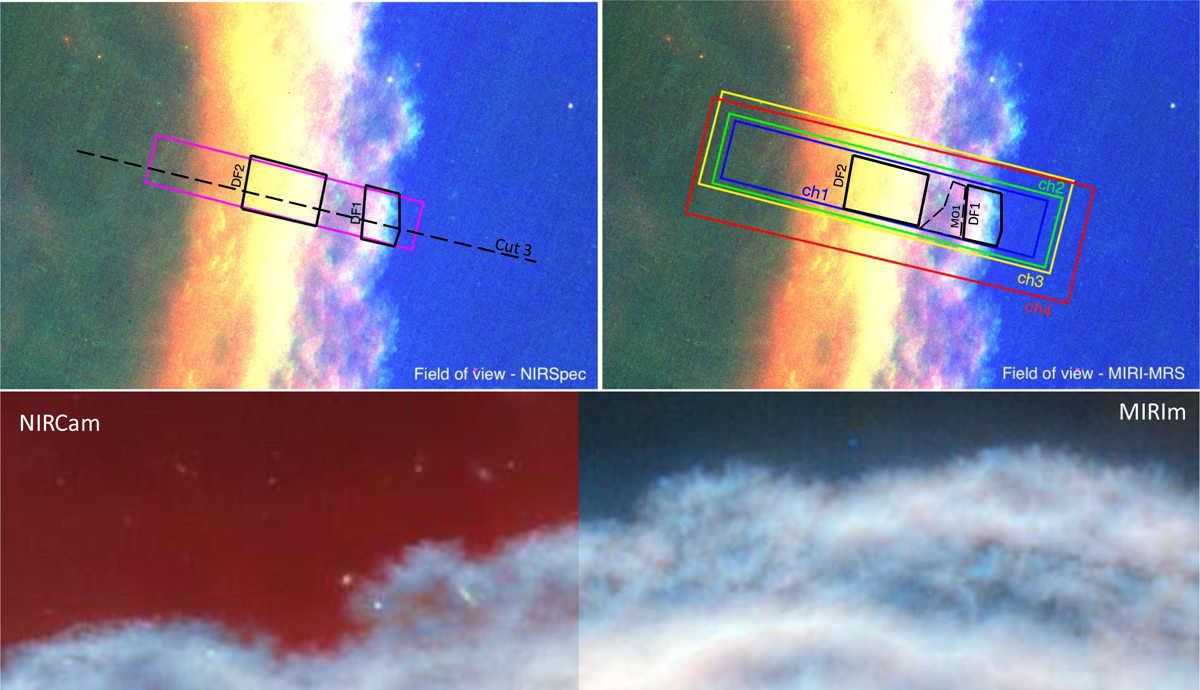
Top panel: JWST NIRCam RGB image of the Horsehead nebula, located in the Orion molecular cloud. Red corresponds to the 3.35 μ m emission (F335M NIRCam filter), blue to the emission of Pa α (F187N filter), and green to the emission of the H2 1−0 S(1) line at 2.12 μ m (F212N filter). Left panel: NIRSpec field of view overlaid on the image in magenta. Right panel: field of view of the different MIRI-MRS channels overlaid on the image (channel 1: blue, channel 2: green, channel 3: yellow, channel 4: red). The black boxes correspond to the aperture used to derive spectra in the dissociation front regions and the dashed black boxes correspond to the aperture in the “molecular” region behind DF1, as defined in Misselt et al. (2025). The dashed line indicates the position of cut #3 from Abergel et al. (2024). Bottom panel: JWST NIRCam and MIRI-MRS composite image of the Horsehead nebula, zoomed on the edge where the faint striated features, attributed to an evaporative flow, are more visible. The image is rotated by 90° with respect to the top panel. Credit: ESA/Webb, NASA, CSA, K. Misselt (University of Arizona), and A. Abergel (IAS/University Paris-Saclay, CNRS).
Current usage metrics show cumulative count of Article Views (full-text article views including HTML views, PDF and ePub downloads, according to the available data) and Abstracts Views on Vision4Press platform.
Data correspond to usage on the plateform after 2015. The current usage metrics is available 48-96 hours after online publication and is updated daily on week days.
Initial download of the metrics may take a while.