Open Access
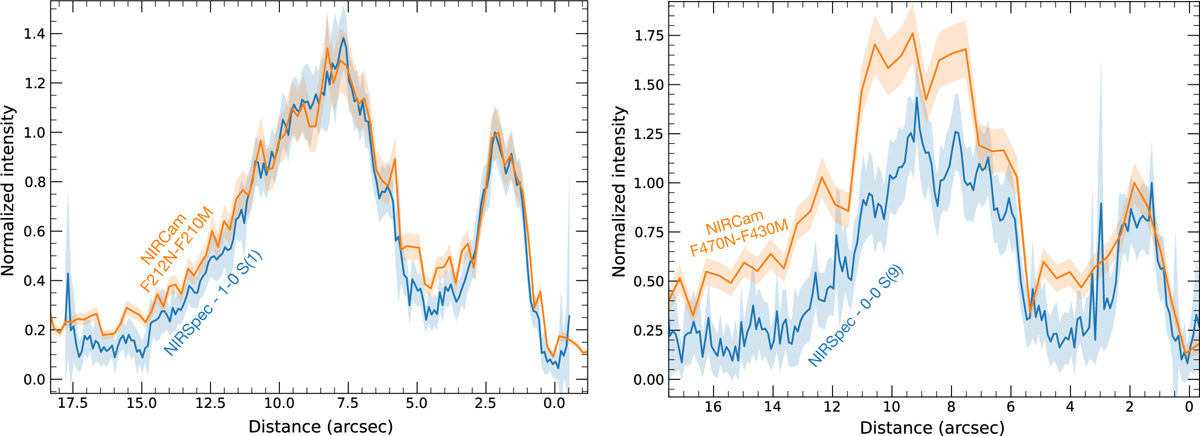
Fig. A.2
Download original image
Comparison of H2 lines and emission profiles from imaging data across the front (cut #3 from Abergel et al. 2024) averaged on 0.5′′ perpendicular to the line cut. Profiles are flux-normalized between 0.5′′ and 3′′ (average around the first peak).
Current usage metrics show cumulative count of Article Views (full-text article views including HTML views, PDF and ePub downloads, according to the available data) and Abstracts Views on Vision4Press platform.
Data correspond to usage on the plateform after 2015. The current usage metrics is available 48-96 hours after online publication and is updated daily on week days.
Initial download of the metrics may take a while.