Open Access
Fig. C.1
Download original image
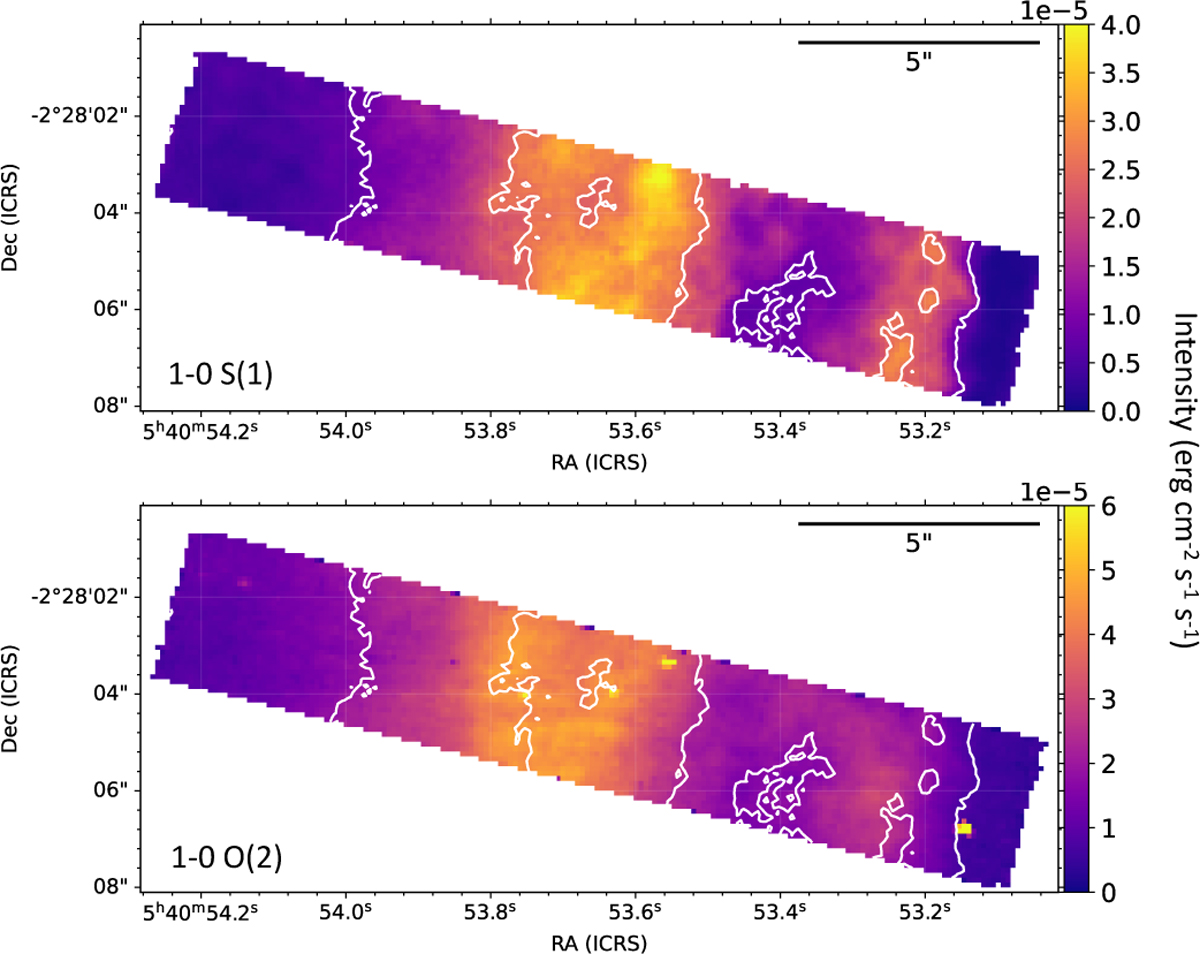
Comparison of the spatial distribution of an ortho rovibrational line (1−0 S(1)) and a para rovibrational line (1−0 O(2)). White contours are from the 1−0 S(1) line emission. A spatial shift is observed between these lines in the data.
Current usage metrics show cumulative count of Article Views (full-text article views including HTML views, PDF and ePub downloads, according to the available data) and Abstracts Views on Vision4Press platform.
Data correspond to usage on the plateform after 2015. The current usage metrics is available 48-96 hours after online publication and is updated daily on week days.
Initial download of the metrics may take a while.