Open Access
Fig. 3
Download original image
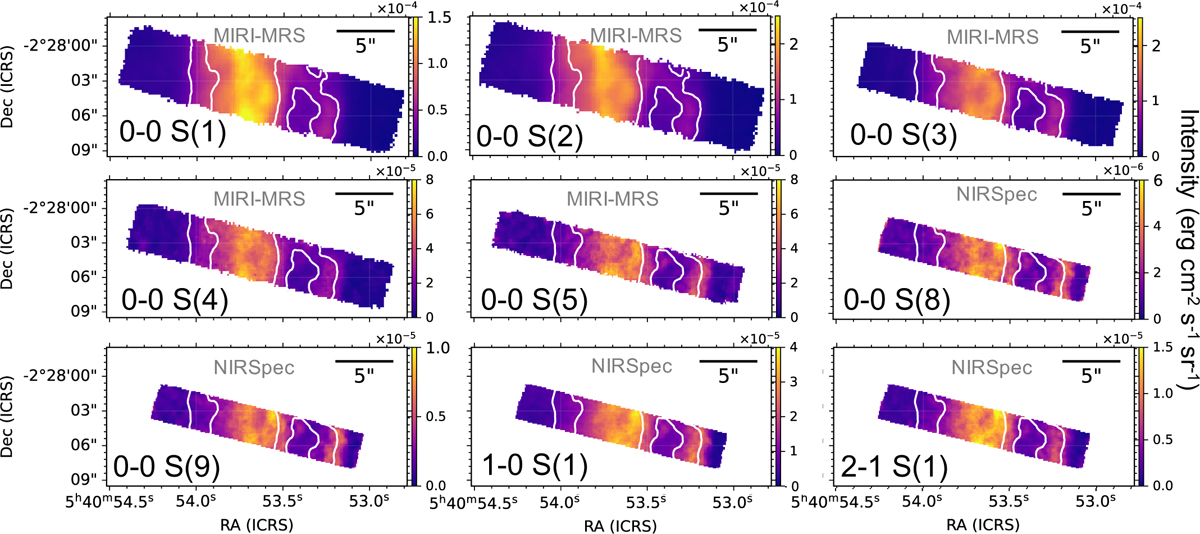
Maps of the brightest H2 rotational lines emission and 1−0 S(1) and 2−1 S(1) rovibrational line emission obtained with MIRI-MRS and NIRSpec across the PDR front. White contours indicate the 0−0 S(1) line emission.
Current usage metrics show cumulative count of Article Views (full-text article views including HTML views, PDF and ePub downloads, according to the available data) and Abstracts Views on Vision4Press platform.
Data correspond to usage on the plateform after 2015. The current usage metrics is available 48-96 hours after online publication and is updated daily on week days.
Initial download of the metrics may take a while.