Fig. 5
Download original image
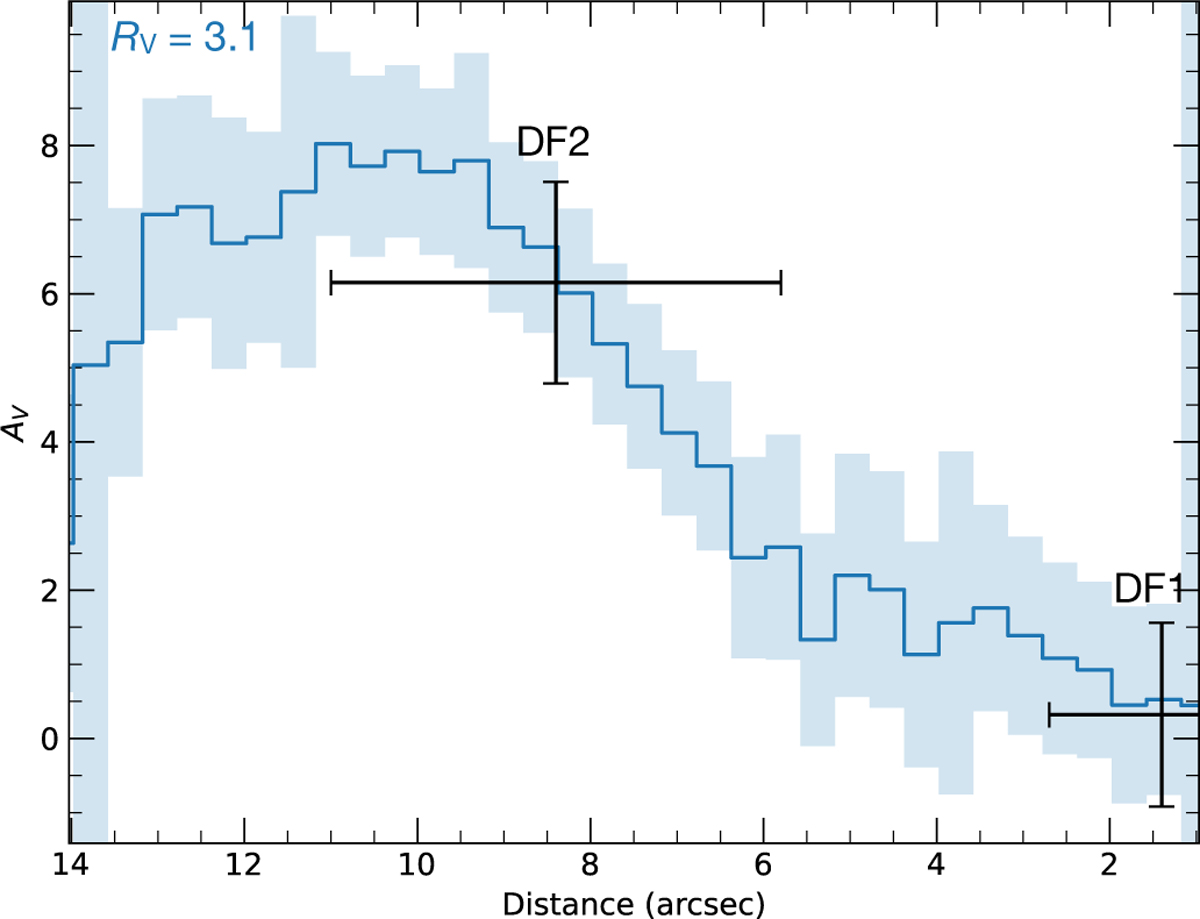
Profile of AV, the attenuation by the foreground matter, across the PDR front, derived from H2 line ratios. The signal was averaged over the width of the maps and four columns of pixels to compute H2 maps with sufficient S/N. Within 1′′ and beyond 14′′ from the front, H2 emission is too faint to derive AV. The value of AV increases from the edge of the PDR to the second and third H2 filaments.
Current usage metrics show cumulative count of Article Views (full-text article views including HTML views, PDF and ePub downloads, according to the available data) and Abstracts Views on Vision4Press platform.
Data correspond to usage on the plateform after 2015. The current usage metrics is available 48-96 hours after online publication and is updated daily on week days.
Initial download of the metrics may take a while.