Fig. 8
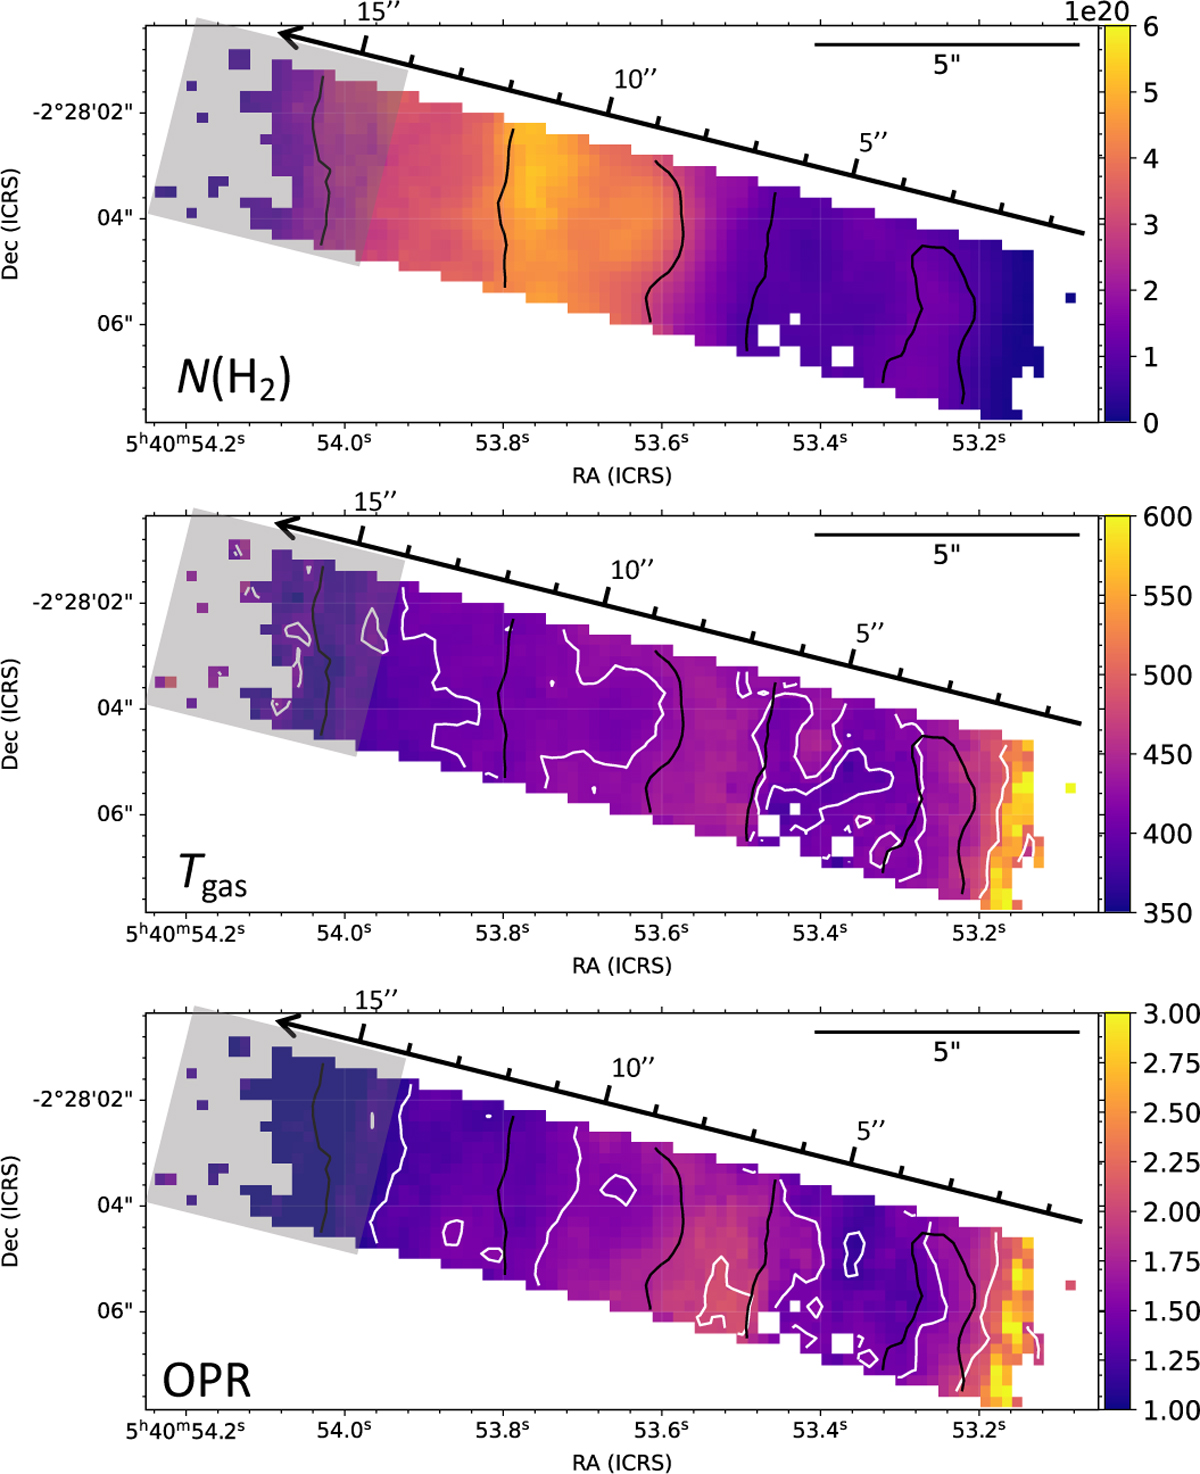
Download original image
Maps of column density (top panel), gas temperature (middle panel), and ortho-to-para ratio (bottom panel) corrected for extinction. The black contours show the H2 0−0 S(1) line corrected for extinction, with levels of: 4.5 × 10⁻⁵ and 1.5 × 10⁻⁴ erg cm−2 s−1 sr−1). The white contours levels are 400, 420, and 500 K for Tgas and 1.2, 1.5, and 2 for the OPR. The gray boxes overlaid on the map correspond to the region where the extinction is poorly constrained.
Current usage metrics show cumulative count of Article Views (full-text article views including HTML views, PDF and ePub downloads, according to the available data) and Abstracts Views on Vision4Press platform.
Data correspond to usage on the plateform after 2015. The current usage metrics is available 48-96 hours after online publication and is updated daily on week days.
Initial download of the metrics may take a while.