Open Access
Fig. B.1.
Download original image
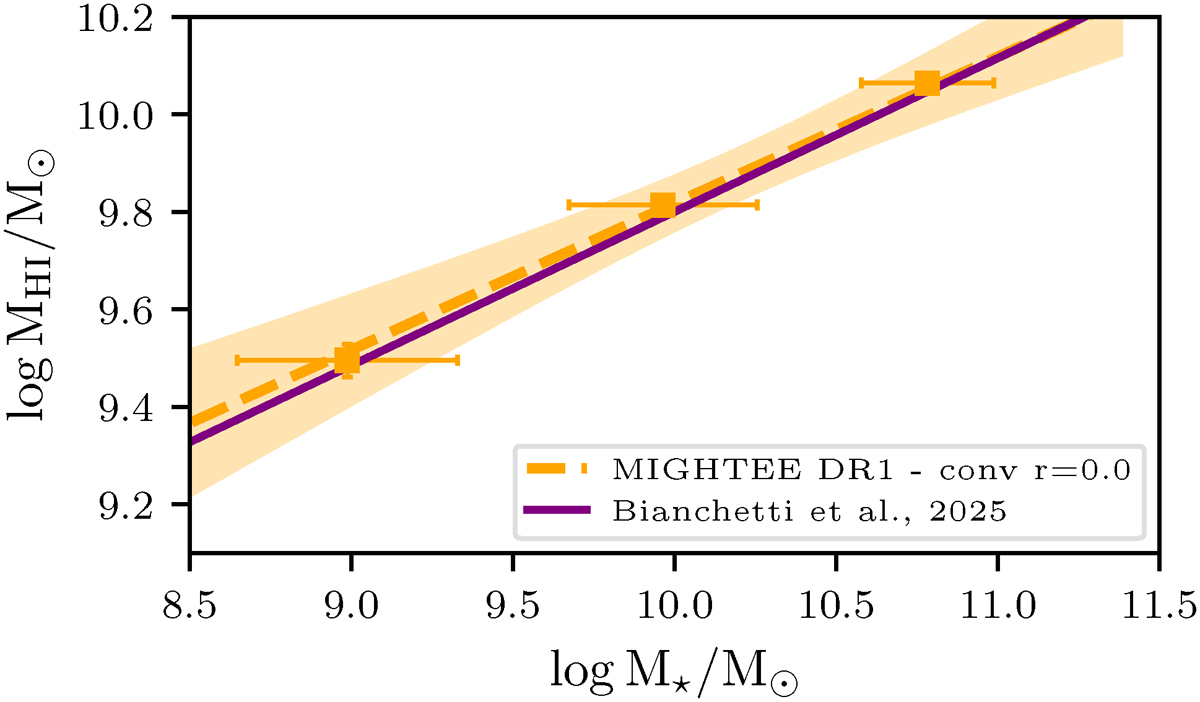
Comparison between the MHI-M⋆ scaling relation from B25 (purple solid line) and the MHI values extracted from the stacks performed on the MIGHTEE-DR1 data with the same settings (orange squares), fitted by a linear model (dashed orange line).
Current usage metrics show cumulative count of Article Views (full-text article views including HTML views, PDF and ePub downloads, according to the available data) and Abstracts Views on Vision4Press platform.
Data correspond to usage on the plateform after 2015. The current usage metrics is available 48-96 hours after online publication and is updated daily on week days.
Initial download of the metrics may take a while.