| Issue |
A&A
Volume 704, December 2025
|
|
|---|---|---|
| Article Number | A162 | |
| Number of page(s) | 11 | |
| Section | Extragalactic astronomy | |
| DOI | https://doi.org/10.1051/0004-6361/202556367 | |
| Published online | 05 December 2025 | |
Atomic hydrogen reservoirs in quiescent galaxies at z = 0.4
1
Department of Physics and Astronomy, Università degli Studi di Padova, Vicolo dell’Osservatorio 3, I-35122 Padova, Italy
2
INAF – Osservatorio Astronomico di Padova, Vicolo dell’Osservatorio 5, I-35122 Padova, Italy
3
National Center for Nuclear Research, Pasteura 7, 02-093 Warsaw, Poland
4
SISSA, Via Bonomea 265, 34136 Trieste, Italy
5
Département d’Astronomie, Université de Genève, Chemin Pegasi 51, 1290 Versoix, Switzerland
6
Institut für Astrophysik, Universität Zürich, Winterthurerstrasse 190, CH-8057 Zürich, Switzerland
7
Department of Physics and Astronomy, University of the Western Cape, Robert Sobukwe Rd, 7535 Bellville, Cape Town, South Africa
8
Inter-university Institute for Data Intensive Astronomy, Department of Astronomy, University of Cape Town, 7701 Rondebosch, Cape Town, South Africa
9
Inter-university Institute for Data Intensive Astronomy, Department of Physics and Astronomy, University of the Western Cape, 7535 Bellville, Cape Town, South Africa
10
INAF – Istituto di Radioastronomia, Via Gobetti 101, 40129 Bologna, Italy
11
Sterrenkundig Observatorium, Universiteit Gent, Krijgslaan 281 S9, 9000 Gent, Belgium
12
Institute for Astronomy, University of Edinburgh, Royal Observatory, Edinburgh EH9 3HJ, United Kingdom
13
INAF – Osservatorio Astronomico di Cagliari, Via della Scienza 5, I-09047 Selargius, CA, Italy
14
Astrophysics, Department of Physics, University of Oxford, Keble Road, Oxford OX1 3RH, UK
15
Centre for Radio Astronomy Techniques and Technologies, Department of Physics and Electronics, Rhodes University, PO Box 94 Makhanda 6140, South Africa
16
South African Radio Astronomy Observatory, 2 Fir Street, Black River Park, Observatory, Cape Town 7925, South Africa
⋆ Corresponding author: This email address is being protected from spambots. You need JavaScript enabled to view it.
Received:
11
July
2025
Accepted:
10
September
2025
Abstract
Context. Based on local Universe observations, quiescent galaxies (QGs) host lower or negligible HI compared to star-forming galaxies (SFGs), but no constraints have been derived to date at higher redshift (z > 0.1). Understanding whether QGs can retain significant HI reservoirs at higher z is crucial for refining quenching and gas accretion models and for constraining overall star formation efficiency at different epochs.
Aims. We aim to probe HI in candidate QGs at intermediate redshifts (⟨z⟩≈0.36) and to understand whether a class of QGs exists that retains consistent HI reservoir, as well as which parameters (dust content, stellar mass, Dn4000, morphology, and environment) effectively capture HI-rich QGs.
Methods. We performed 21-cm spectral line stacking on MIGHTEE-HI data at ⟨z⟩ = 0.36, targeting two different samples of QGs, defined by means of a color-selection criterion and a spectroscopic criterion based on Dn4000, respectively. We also performed stacking on subsamples of the spectroscopically selected quiescent sample to investigate the correlation between the HI content and other galaxy properties.
Results. We find that QGs with an IR counterpart (i.e., dusty galaxies) host a substantial HI content, on average only 40% lower than that of SFGs. In contrast, color-selected QGs still retain HI, but at levels lower than those of SFGs by a factor of ∼3. Among dusty objects, we find that morphology has a mild impact on the atomic gas content, with spirals hosting approximately 15 − 30% more HI than spheroids. Environmental effects are also present: galaxies in low-density regions are richer in HI than those in high-density regions, by approximately 30% for spirals and 60% for spheroids. We suggest that, in general, HI content is influenced by several factors, including slow quenching mechanisms and interstellar medium (ISM) enrichment processes. Also, QGs – and especially dusty systems – seem to yield HI more consistently than in the local Universe.
Key words: methods: observational / galaxies: evolution / galaxies: ISM
© The Authors 2025
 Open Access article, published by EDP Sciences, under the terms of the Creative Commons Attribution License (https://creativecommons.org/licenses/by/4.0), which permits unrestricted use, distribution, and reproduction in any medium, provided the original work is properly cited.
This article is published in open access under the Subscribe to Open model. This email address is being protected from spambots. You need JavaScript enabled to view it. to support open access publication.
1. Introduction
Although not directly fueling star formation, neutral atomic hydrogen (HI) is a key phase of the interstellar medium (ISM), particularly at high redshift, becoming dominant at z ⪆ 2 (Péroux & Howk 2020; Walter et al. 2020). It offers insight into quenching and gas retention and rejuvenation. It can be detected through the 21-cm line arising from the hyperfine structure of the atom. The intrinsic faintness of this line makes direct detection very challenging: current record holders for high-redshift direct 21-cm detection are a set of six galaxies detected by FAST at z ≈ 0.4 (Xi et al. 2024). For this reason, the HI community employed indirect statistical methods to measure average HI properties at higher distances. In particular, spectral stacking has yielded statistically robust results at redshifts up to ⪅0.4 (e.g., see Lah et al. 2007; Delhaize et al. 2013; Bera et al. 2019, 2023; Chowdhury et al. 2020, 2022a; Guo et al. 2020, 2021; Sinigaglia et al. 2022, 2024; Rhee et al. 2023; Bianchetti et al. 2025), where only a limited number of direct detections are currently available. Pioneering uGMRT (upgraded Giant Meter Radio Telescope, see Gupta et al. 2021) studies pushed the boundaries of stacking studies to z ≈ 1 (Chowdhury et al. 2021, 2022b,c).
Although traditionally regarded as gas-poor, recent works provide evidence of cold molecular gas in quiescent galaxies (QGs; Combes et al. 2007; Davis et al. 2013; Gobat et al. 2018). In particular, analysis of the ATLAS-3D sample (Cappellari et al. 2011) reveal signficant amounts of atomic gas in early-type galaxies (ETGs; Serra et al. 2012; Maccagni et al. 2017; Yıldız et al. 2020). Young et al. (2014) further showed that even these ETGs may have quenched from blue progenitors while retaining a fraction of their cold gas budget. Subsequent studies using the Sloan Digital Sky Survey (SDSS; Abazajian et al. 2009), the Arecibo Legacy Fast ALFA survey (ALFALFA; Giovanelli et al. 2005), the GALEX Arecibo SDSS Survey (GASS; Catinella et al. 2010), and the COLD GASS survey (Saintonge et al. 2011) show evidence that the vast majority of massive quiescent disk galaxies contain abundant HI reservoirs (Zhang et al. 2019).
In contrast, other studies find a lack of HI in QGs. In the local Universe, Cortese et al. (2020) find little to no HI down to log MHI ≈ 8 in quiescent spirals from the extragalactic GASS survey (xGASS; Catinella et al. 2018), claiming that reduced star formation correlates with depletion of HI reservoirs. Geréb et al. (2016, 2018) report only isolated cases of HI-rich QGs, labeling them as HI-excess galaxies. Building on this, Saintonge & Catinella (2022) note that the existence of galaxies below the main sequence (MS) with relevant HI reservoirs does not contradict the general trend of HI-poor QGs, as these galaxies have low HI fractions. At slightly higher redshift (0.04 < z < 0.09), stacking color-selected QGs in the Deep Investigation of Neutral Gas Origins (DINGO; Meyer 2009) survey reveals no HI down to log MHI ≈ 9 (Rhee et al. 2023). These contradictory results make the presence of atomic gas in QGs a debated issue.
The HI content of QGs beyond the local Universe remains relatively unexplored and could provide a better understanding of star formation efficiency throughout cosmic time. In this paper, we stack samples of candidate QGs in the COSMOS field (from Bianchetti et al. 2025; Donevski et al. 2023, hereafter B25 and D23) at a mean redshift z ≈ 0.37. We use data from the MeerKAT International Giga-Hertz Tiered Extragalactic Exploration survey (MIGHTEE; Jarvis et al. 2016; Heywood et al. 2024) obtained with the MeerKAT radio interferometer (Jonas & MeerKAT Team 2016) to study the presumed HI content in the two samples of quenched galaxies. The paper is organized as follows. In Sect. 2 we briefly summarize the specifics of the MIGHTEE-HI radio survey used for the stacking analysis, present the samples used, and briefly discuss the steps of the selection process. Sect. 3 outlines the main results of stacking the samples in different slices of phase space, analyzing the impact of dust presence, stellar mass, Dn4000, morphology, and environment, and interpreting our findings in the framework of modern results on galaxy evolution. Sect. 4 summarizes the paper. We assume a flat (Ωk = 0) Λ-CDM cosmology, employing cosmological parameters from Planck Collaboration VI (2020), i.e., H0 = 67.4 km s−1 Mpc−1, Ωm = 0.315, and ΩΛ = 0.685, and an initial mass function from Chabrier (2003).
2. Data and sample
In this work, we stack spectra extracted from MIGHTEE-HI DR1 (Heywood et al. 2024), a survey consisting of 15 deep MeerKAT pointings (94.2 h total) within the COSMOS field. The survey covers two separate frequency ranges (960−1150 MHz and 1290−1520 MHz), where the former is used in this paper, targeting the HI 21 cm line in the redshift range 0.22 < z < 0.5. Comprehensive details on data reduction and data products are provided by Heywood et al. (2024).
We used two different catalogs of candidate QGs, both covering the COSMOS field, as input for the stacking pipeline. The first catalog defines quiescence using a double rest-frame color criterion (NUV − r vs r − J) and is the same catalog used in B25. We refer to that paper for a full description. The second catalog is inherited by D23 and originally comprises 4362 galaxies at 0.01 < z < 0.7 with spectroscopic data from the hCOSMOS survey (Damjanov et al. 2018). We provide here a brief summary of the catalog construction, but we refer to D23 for a full description. Here, the quiescent nature of the selected objects is identified using a combination of criteria. First, a threshold is set on high 4000 Å-break strength (Dn4000 > 1.5), ensuring robust separation between star-forming galaxies (SFGs) and candidate QGs (i.e., Balogh et al. 1999; Damjanov et al. 2025). Furthermore, objects in the catalog meet at least one additional criterion, either (i) low specific star formation rate (sSFR), placing objects more than five times below the Speagle et al. (2014) main-sequence, or (ii) UVJ color criteria for QGs (Muzzin et al. 2013). We supplemented this catalog with IR counterparts from the Herschel Extragalactic Legacy Project (HELP; Shirley et al. 2019) to assess the dust properties of the sample. D23 define a candidate QG as dusty if it is detected (S/N > 3) in at least four bands at 8 ≤ λ ≤ 500 μm, with a reference 1σ sensitivity of ≈1 mJy at λ = 250 μm. Galaxies that do not meet this criterion are considered ordinary, dust-poor QGs.
We show the properties of the investigated sample in Fig. 1. The upper panel shows the log M⋆ − Dn4000 parameter space in Fig. 1, where red points indicate galaxies with an IR counterpart and gray points indicate those with no detected IR counterpart, i.e., below the detection limits previously specified. Histograms at the side of the panel show the distributions of Dn4000 and M⋆ for the dusty and non-dusty subsamples. To further ensure the quiescent nature of the spectroscopic sample, the lower panel of Fig. 1 shows the spread of the sample in the M⋆ − SFR plane, excluding galaxies above the dashed line that marks a 0.3 dex distance from the model by Popesso et al. (2023), which is typically the scatter of the MS. We also plot the color-selected sample in the same panel (blue points).
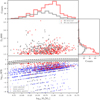 |
Fig. 1. Two-dimensional distributions of galaxy properties from three investigated samples. Upper panel: Scatter plot of the spectroscopic sample from D23 in the Dn4000 − log M⋆ plane. Red triangles indicate galaxies with an IR counterpart, while gray circles mark galaxies with no IR detection. Histograms above and right of the scatter plot show the distribution of these parameters for the two infrared populations, using the same color coding. Lower panel: Distribution of galaxies from the spectroscopic sample of D23, plotted in comparison to the MS galaxies shown in the left panel. Red points represent galaxies with an IR counterpart, while gray points represent galaxies without an IR counterpart. The sample is compared with an MS model by Popesso et al. (2023) (black solid line), while the dashed black line indicates a 0.3 dex scatter around the MS. |
Overall, dusty QG candidates show, on average, higher SFR values than the non-dusty subpopulation and the color-selected sample. We caution that these SFR values are estimated with spectral energy distribution (SED) fitting (D23), which associates far-infrared (FIR) emission with obscured star formation. However, old stellar populations distributed in the diffuse ISM could also partly contribute to dust heating (da Cunha et al. 2008). Therefore, SFRs presented here can be interpreted as upper limits. We refer to the population as “quiescent” since it satisfies quiescence criteria, such as lack of optical emission lines and suitable Dn4000 values.
We added information on the environment by cross-matching our catalog with the density field constructed by Darvish et al. (2017). They use a mass-complete photometric sample to compute a gridded density field on the COSMOS footprint (see Darvish et al. 2017 for more details). Specifically, they define an overdensity value δ as the ratio between the density value of each galaxy and the median density value of the field. This allowed us to separate higher-density from lower-density environments and perform our stacking analysis in different bins.
We also retrieved information about the environment (in particular, the overdensity parameter  ) by cross-matching our catalog with the density field constructed by Darvish et al. (2017). Finally, we assigned a morphology classification (spiral, spheroid, or irregular) to each galaxy through visual inspection of F814W HST/ACS cutouts (Koekemoer et al. 2007; Massey et al. 2010). These reveal a rich morphological diversity, including disks, bars, prominent bulges, spheroids, and irregular shapes.
3. HI stacking results for quiescent galaxies
We applied our stacking pipeline (Sinigaglia et al. 2022, 2024 and B25) to the MIGHTEE-HI DR1 data, using both samples described in Sect. 2 as input (see Appendix A for the stacked spectra). Stacking QGs in the local Universe could also gain a direct comparison. MIGHTEE DR1 covers the z < 0.08 range, but the statistics of the sample is too modest for stacking at this redshift. For a fair comparison with the results obtained with the MIGHTEE Early Science data (B25), we derived the M⋆ − MHI relation for SFGs using the DR1 data and tested that it was still consistent with the previous data release (Appendix B). We divided the sample in various ways, summarized by Table 1 and discussed later in the paper.
Results from stacking runs on different QGs subsamples.
3.1. A link between dust and HI
Fig. 2 shows the results of stacking candidate QGs from the two catalogs, together with the MHI − M⋆ scaling relation for SFGs from B25. Besides the uncertainties on the HI masses (see Appendix A for more details), we also added uncertainties on the stellar mass domain, computed as the standard deviation of the bin. We split the QG color-selected catalog into three stellar mass bins (8.0 < log(M⋆/M⊙) < 10.5, 10.5 < log(M⋆/M⊙) < 11 and log(M⋆/M⊙) > 11) and find no detection in the lowest mass one (blue triangle in Fig. 2), while statistically significant signals were produced in the other two stellar mass bins (blue circles). The stacked spectra are shown in Appendix A, in the upper panels of Fig. A.1). The HI content is a factor of ∼3 lower than that retained by SFGs at the same stellar mass.
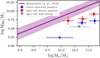 |
Fig. 2. Comparison of average HI content between SFGs and QGs. The solid purple line represents the MHI − M⋆ scaling relation for SFGs from B25. Blue circles show HI masses from color-selected QGs in two stellar mass bins: a circle at the high-mass end (significant detection) and a triangle at the low-mass end (upper limit only). Red squares indicate HI masses from stacked spectra of dusty, spectroscopically selected QGs in two mass bins. A gray triangle marks the upper limit from stacking non-dusty, spectroscopically selected QGs. |
For the Dn4000-selected sample, stacking non-dusty QGs over the full mass range only leads to an upper limit on HI content (gray triangle in Fig. 2), computed as three times the RMS value obtained from the stack (Fig. A.1, bottom panel). In contrast, dusty QGs were split into the same three stellar mass bins as for the color-selected sample (Fig. A.1, middle panels). All three bins exhibit statistical detection of HI, with the corresponding mass estimates marked by red squares in Fig. 2.
Overall, Fig. 2 suggests a trend in which more massive QGs host larger HI reservoirs, mirroring the MHI − M⋆ for MS galaxies. However, QGs present diverse HI content, linked to various ISM properties: color-selected QGs likely encompass a broad dust mass range, mixing dust-rich and dust-poor objects, which dilutes the stacked HI signal. In contrast, the Dn4000-selected QGs show a correlation between dust and HI content. Specifically, dust-rich galaxies possess significant HI reservoirs, on average only 40% less abundant than in MS galaxies. The existence of dusty candidate QGs is documented up to z ∼ 3; (Gobat et al. 2018; Morishita et al. 2022; Rodighiero et al. 2023; Lee et al. 2024; Siegel et al. 2025). Recent studies suggest that dust-rich QGs can retain cold dust and gas for extended periods (> 2 Gyr; Michałowski et al. 2024; Lee et al. 2024; Lorenzon et al. 2025). The diversity in the dust-cold gas mass ratio (Whitaker et al. 2021; Morishita et al. 2022; Donevski et al. 2023) suggests that dust leftovers may not be exclusively relics of star formation. Grain growth on ISM metals is proposed as a dominant dust production channel to explain the observed Mdust/M⋆ distribution. The presence of HI in dusty QGs, as reported here, is likely related to this scenario. In fact, HI reservoirs may shield dust from UV radiation and favor its growth, thereby prolonging dust survival, as proposed by recent theoretical studies (Chen & Oh 2024).
3.2. Correlation with age, morphology and environment
We focused on the dusty, HI-rich QG sample and investigated possible dependencies on the environment and morphology.
First, we split the sample into three Dn4000 bins (1.5 < Dn4000 < 1.61, 1.61 < Dn4000 < 1.8 and Dn4000 > 1.8) and obtained a significant detection (S/N > 4) in all cases (Fig. A.2). Fig. 3 shows the estimated HI fractions (where fHI = MHI/M⋆) as a function of the average Dn4000 value in each bin. A dashed blue line indicates the best-fit linear model. Uncertainties on the Dn4000 axis correspond to the standard deviation within each bin. The figure suggests a trend, with older galaxies yielding lower HI fractions. This implies that recently quenched systems with low Dn4000 have not yet consumed, expelled, or ionized their HI reservoirs, or may have reaccreted HI from the circumgalactic medium, through mechanisms such as tidal streams or mergers.
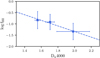 |
Fig. 3. Average HI fraction of dusty QGs in Dn4000 bins. The average fHI = MHI/M⋆ is shown in Dn4000 bins (1.5 < Dn4000 < 1.61, 1.61 < Dn4000 < 1.8 and Dn4000 > 1.8), plotted against their average value. The dashed line indicates the best-fit linear model in both panels. |
To investigate environmental properties, we used the overdensity parameter from Darvish et al. (2017) and defined two bins: galaxies lying in regions denser than average (δ > 1) and galaxies in regions where density is lower than average (δ < 1). Separately stacking the two groups yields a robust signal in both cases (S/N > 7, see Fig. A.3). Fig. 4 displays the logarithm of the ratio between the two HI mass estimates in the two environment bins and the HI mass expected at their average stellar mass for SFGs according to B25 (full purple squares). The higher-density stack yields an HI amount ≈0.15 dex below the lower-density case. Environmental factors are well known to influence gas content, especially in the stellar mass range that we examine (Contini et al. 2020). Li et al. (2025) argue that HI content is more strongly regulated by environment than morphology, highlighting that satellite galaxies in low-density regions often remain gas-rich. In contrast, high-density environments promote gas depletion through processes such as ram pressure stripping, tidal interactions, and starvation. Our findings are consistent with this picture, although the COSMOS field is dominated by filaments and knots rather than rich clusters, making strong environmental depletion less likely. Recent results based on the SIMBA cosmological simulations (Davé et al. 2021) qualitatively support this picture (Lorenzon et al. 2025). Specifically, while dust- and gas-rich QGs are found in both field and cluster environments, galaxies residing in less massive halos exhibit reduced dust destruction rates. If dust and HI share common removal timescales post-quenching, as observed (e.g., Michałowski et al. 2024), would align with our finding of slightly richer HI reservoirs in lower-density environments. Moreover, the same analysis indicates that satellites may act as a secondary channel for enhancing dust and cold gas content, primarily through mergers rather than rejuvenation episodes.
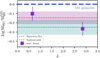 |
Fig. 4. Logarithm of the ratio between the average HI mass of dusty QGs and the equivalent HI contained at the same stellar mass in MS galaxies according to B25, plotted against the median overdensity δ for each galaxy bin. A dashed horizontal line at y = 0 indicates the HI content in SFGs. Purple filled squares mark the HI estimates from stacking dusty galaxies in lower-density (δ < 1) and in higher-density (δ > 1) bins, irrespective of morphology; shaded bands indicate uncertainties. Red and teal dotted lines indicate the HI estimate from stacking spirals and spheroids, respectively, irrespective of environment, spanning across the δ range. |
Following our visual morphology classification, we stacked spirals and irregulars together, while spheroids were placed in a separate bin. We obtain clear HI detections for both groups (S/N > 7; see Fig. A.4). In Fig. 4, a dotted crimson and teal horizontal lines mark the logarithm of the ratio between HI estimates for spirals and spheroids, respectively, over the HI mass for same-stellar-mass MS galaxies. The lines extend over the full δ range as they are not selected through a δ bin. The two morphology classes share a similar median δ, demonstrating that they do not differ in terms of environmental properties. Dusty quiescent spirals and irregulars contain about 40% less HI mass than MS galaxies, while dusty spheroids are even more HI-poor (≈75% less than MS galaxies). D23 mirror these results, reporting that dusty spirals generally have a slightly higher Mdust/M⋆ ratio than spheroids.
The presence of HI in quiescent spirals is not a novel result in the local Universe (e.g., Zhang et al. 2019) show that massive, quiescent disk galaxies present HI fractions ranging from 10 to 30%, comparable to those in SFGs. These studies attribute the cause of the quenching to a lack of molecular gas and dust, along with a low star formation efficiency, while HI reservoirs tend to persist. The similarity in HI content between our red spirals and MS galaxies suggests that these objects may be in some transitioning state – either off the MS or toward the green valley – i.e., experiencing a lull phase, or a post-starburst phase (also see Ellison et al. 2025). This scenario aligns with SED fitting carried out by D23, implying that the star formation histories (SFHs) of most galaxies in the sample are consistent with quenching within the past 1 Gyr. Their substantial HI and dust content points to the potential for future starburst activity, placing them in a “mini-quenching” phase (Dome et al. 2024; Looser et al. 2025), pending the restoration of molecular hydrogen. Moreover, a growing number of observational studies link the occurrence of HI-rich QGs and post-starbursts to slow quenching mechanisms (e.g., morphological quenching), where HI reservoirs persist long after the final burst (Michałowski et al. 2024; Li et al. 2025; Ellison et al. 2025). This conclusion is further supported by SIMBA’s dust modeling, which predicts slow quenching to be prevalent among dusty QGs with old stellar populations (> 5 − 10 Gyr) (Lorenzon et al. 2025). An independent ALMA Band 6 follow-up of 18 QGs, including several objects from this study, reveals that despite reduced molecular gas fractions, dusty QGs can retain high dust-to-gas ratios (≳1/100), comparable to those of SFGs (Lorenzon et al., in preparation). They find that the total cold ISM content declines only slightly with stellar age, with quiescent spirals typically hosting somewhat richer dust reservoirs than ellipticals.
However, the fact that spheroids hold significant amounts of HI – despite their lower HI content with respect to spirals – requires some other HI enrichment channel. Cutouts from the HST (Appendix C) reveal that spheroids are often accompanied by streams and merger remnants, suggesting that environmental properties may play a role. Although we hypothesize that high density environments favor HI stripping, reaccretion may be common for quenched spheroids. Reaccretion may result from past mergers or quenching events, while frequent interaction with external gas supplies might favor accretion (Dutta et al. 2019).
3.3. Separating morphology and environment
To better unravel the impact of environment and morphology on dusty QGs, we split each morphology class into δ bins and obtained significant signal in all four cases (S/N ≥ 4, Fig. A.5). Fig. 5 shows the  plane, with full purple squares marking the two δ bins. Two empty crimson stars and two empty teal circles indicate the split of the δ bins, for spirals plus irregulars and spheroids, respectively. This split shows how galaxies with different morphologies respond differently to environmental properties. Spirals in high-density environments are ≈30% HI-richer than their low-density peers, whereas the depletion is stronger (≈60%) for spheroids. A comparison to the square purple bins, which indicate environment bins irrespective of morphology, shows that in lower-density environments spirals and spheroids have very comparable HI content (within 15%). At higher densities spheroids are more strongly affected, retaining 30% less HI than spirals. Large error bars indicate that these results should be interpreted with caution. This suggests that although both morphology classes exhibit qualitatively similar environmental trends (i.e., decreasing HI with increasing density), the effect is quantitatively stronger for spheroids. Overall, we interpret the environment to be a double-edged agent: galaxies interact with the surroundings and accrete gas from some external source, to either maintain or replenish their HI supplies. However, the densest environments, such as galaxy clusters, have the opposite effect, promoting quenching through processes like ram pressure stripping, X-ray heating, tidal interactions, and harassment, likely favoring the removal of HI (e.g., Cortese et al. 2011; Marasco et al. 2016). Under these conditions, larger dust reservoirs may survive if grain growth is efficient, enriching the interstellar medium with larger, more resilient grains (e.g., Aoyama et al. 2018; Nanni et al. 2024). This may also explain the presence of QGs in this study that are both dust- and HI-rich regardless of environment.
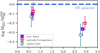 |
Fig. 5. Logarithm of the ratio between average HI mass of dusty QGs and equivalent HI mass in MS galaxies at the same stellar mas according to B25, plotted against the median overdensity δ for each galaxy bin. A dashed horizontal line at y = 0 indicates the HI content of SFGs. Filled purple squares mark the HI estimates from stacking dusty galaxies in lower-density (δ < 1) and in higher-density (δ > 1) bins. Empty red stars represent spiral and irregular galaxies divided into the two separate δ bins. Empty teal circles indicate spheroid galaxies in the same δ bins. |
4. Conclusions
We present the first statistical measurement of neutral atomic hydrogen in QGs at intermediate redshift (⟨z⟩ = 0.36) using spectral stacking of MIGHTEE-HI data. Our analysis reveals that the presence of HI in quiescent systems is not uniform, but strongly depends on dust content, stellar mass, morphology, and environment.
We provide the highest-redshift measurement of HI in QGs to date, using spectral stacking of MIGHTEE-HI data. Although direct quantitative comparison with local Universe studies among QGss studies is limited by sample selection differences and the wide spread in HI measurements, our results suggest that substantial HI reservoirs may be more prevalent at z ≈ 0.36, particularly in dusty systems, hinting at possible evolution in gas retention or quenching processes with redshift. Our analysis shows that the presence of HI in quiescent systems is not uniform but depends on several factors, such as dust content, stellar mass, morphology, and environment.
We summarize the findings of the paper as follows:
-
Dust-rich QGs retain substantial HI reservoirs, on average only ≈40% lower than star-forming galaxies of the same mass. In contrast, dust-poor QGs show no detectable HI. This highlights a close physical link between dust survival and the persistence of atomic gas.
-
Within dusty QGs, younger systems (low Dn4000) are HI-richer, suggesting either incomplete depletion or possible reaccretion of gas after quenching.
-
Measured HI reservoirs in spiral QGs place them systematically closer to the typical HI content of star-forming galaxies. Spheroids also retain significant HI, likely aided by environmental accretion or mergers. Environmental density regulates gas retention, with spheroids exhibiting greater depletion in high-density regions, while spirals are more resilient.
The detection of long-lived HI reservoirs in QGs supports scenarios of slow or partial quenching, in which cold gas survives for several Gyr after star formation declines. Our results further suggest that some dusty QGs may represent transitional phases (e.g., post-starbursts or “mini-quenched” systems) with the potential for rejuvenation if molecular gas reforms. Our findings support a scenario in which QGs do not just constitute the outcome of fuel exhaustion only: rather, a combination of internal ISM processes, morphology, and environment favors slow quenching mechanisms and enables the persistence of cold dust and gas for extended periods after quenching (> 1 − 2 Gyr). Given the large uncertainties in on our HI estimates, further accuracy are needed. The current sample size may be insufficient for definitive conclusions on which parameter regulate HI content in QGs. Future SKA-level sensitivities (Dutta et al. 2022) will strengthen this pioneering study by providing significantly larger samples of HI QGs at this redshift, possibly with statistically significant populations of direct detections.
Acknowledgments
A.B. acknowledges support of the doctoral grant funded by MIUR. A.B., F.S., G.R., L.B. and I.P. acknowledge support from INAF under the Large Grant 2022 funding scheme (project “MeerKAT and LOFAR Team up: a Unique Radio Window on Galaxy/AGN co-Evolution”). I.P. and A.B. acknowledge financial support from the South African Department of Science and Innovation’s National Research Foundation under the ISARP RADIOMAP Joint Research Scheme (DSI-NRF Grant Number 150551), and from the Italian Ministry of Foreign Affairs and International Cooperation under the “Progetti di Grande Rilevanza” scheme (project RADIOMAP, grant number ZA23GR03). D.D. acknowledges support from the NCN through the SONATA grant UMO2020/39/D/ST9/00720. D.D. thanks the support from the Polish National Agency for Academic Exchange (Bekker grant BPN /BEK/2024/1/00029/DEC/1). M.V. and M.G. acknowledge financial support from the Inter-University Institute for Data Intensive Astronomy (IDIA), a partnership of the University of Cape Town, the University of Pretoria and the University of the Western Cape, and from the South African Department of Science and Innovation’s National Research Foundation under the ISARP RADIOSKY2020 and RADIOMAP Joint Research Schemes (DSI-NRF Grant Numbers 113121 and 150551) and the SRUG HIPPO Projects (DSI-NRF Grant Numbers 121291 and SRUG22031677). We acknowledge the use of the ilifu cloud computing facility – www.ilifu.ac.za, a partnership between the University of Cape Town, the University of the Western Cape, Stellenbosch University, Sol Plaatje University and the Cape Peninsula University of Technology. The ilifu facility is supported by contributions from the Inter-University Institute for Data Intensive Astronomy (IDIA – a partnership between the University of Cape Town, the University of Pretoria and the University of the Western Cape), the Computational Biology division at UCT and the Data Intensive Research Initiative of South Africa (DIRISA). The MeerKAT telescope is operated by the South African Radio Astronomy Observatory, which is a facility of the National Research Foundation, an agency of the Department of Science and Innovation. M.G. is supported by the UK STFC Grant ST/Y001117/1. For the purpose of open access, M.G. has applied a Creative Commons Attribution (CC BY) licence to any Author Accepted Manuscript version arising from this submission. FMM carried out part of the research activities described in this paper with contribution of the Next Generation EU funds within the National Recovery and Resilience Plan (PNRR), Mission 4 – Education and Research, Component 2 – From Research to Business (M4C2), Investment Line 3.1 – Strengthening and creation of Research Infrastructures, Project IR0000034 – “STILES - Strengthening the Italian Leadership in ELT and SKA”.
References
- Abazajian, K. N., Adelman-McCarthy, J. K., Agüeros, M. A., et al. 2009, ApJS, 182, 543 [Google Scholar]
- Aoyama, S., Hou, K.-C., Hirashita, H., Nagamine, K., & Shimizu, I. 2018, MNRAS, 478, 4905 [NASA ADS] [CrossRef] [Google Scholar]
- Balogh, M. L., Morris, S. L., Yee, H. K. C., Carlberg, R. G., & Ellingson, E. 1999, ApJ, 527, 54 [Google Scholar]
- Bera, A., Kanekar, N., Chengalur, J. N., & Bagla, J. S. 2019, ApJ, 882, L7 [NASA ADS] [CrossRef] [Google Scholar]
- Bera, A., Kanekar, N., Chengalur, J. N., & Bagla, J. S. 2023, ApJ, 950, L18 [NASA ADS] [CrossRef] [Google Scholar]
- Bianchetti, A., Sinigaglia, F., Rodighiero, G., et al. 2025, ApJ, 982, 82 [Google Scholar]
- Cappellari, M., Emsellem, E., Krajnović, D., et al. 2011, MNRAS, 416, 1680 [Google Scholar]
- Catinella, B., Schiminovich, D., Kauffmann, G., et al. 2010, MNRAS, 403, 683 [Google Scholar]
- Catinella, B., Saintonge, A., Janowiecki, S., et al. 2018, MNRAS, 476, 875 [NASA ADS] [CrossRef] [Google Scholar]
- Chabrier, G. 2003, PASP, 115, 763 [Google Scholar]
- Chen, Z., & Oh, S. P. 2024, MNRAS, 530, 4032 [Google Scholar]
- Chowdhury, A., Kanekar, N., Chengalur, J. N., Sethi, S., & Dwarakanath, K. S. 2020, Nature, 586, 369 [Google Scholar]
- Chowdhury, A., Kanekar, N., Das, B., Dwarakanath, K. S., & Sethi, S. 2021, ApJ, 913, L24 [NASA ADS] [CrossRef] [Google Scholar]
- Chowdhury, A., Kanekar, N., & Chengalur, J. N. 2022a, ApJ, 931, L34 [Google Scholar]
- Chowdhury, A., Kanekar, N., & Chengalur, J. N. 2022b, ApJ, 935, L5 [NASA ADS] [CrossRef] [Google Scholar]
- Chowdhury, A., Kanekar, N., & Chengalur, J. N. 2022c, ApJ, 941, L6 [NASA ADS] [CrossRef] [Google Scholar]
- Combes, F., Young, L. M., & Bureau, M. 2007, MNRAS, 377, 1795 [NASA ADS] [CrossRef] [Google Scholar]
- Contini, E., Gu, Q., Ge, X., et al. 2020, ApJ, 889, 156 [NASA ADS] [CrossRef] [Google Scholar]
- Cortese, L., Catinella, B., Boissier, S., Boselli, A., & Heinis, S. 2011, MNRAS, 415, 1797 [Google Scholar]
- Cortese, L., Catinella, B., Cook, R. H. W., & Janowiecki, S. 2020, MNRAS, 494, L42 [NASA ADS] [CrossRef] [Google Scholar]
- da Cunha, E., Charlot, S., & Elbaz, D. 2008, MNRAS, 388, 1595 [Google Scholar]
- Damjanov, I., Zahid, H. J., Geller, M. J., Fabricant, D. G., & Hwang, H. S. 2018, ApJS, 234, 21 [NASA ADS] [CrossRef] [Google Scholar]
- Damjanov, I., Geller, M. J., & Sohn, J. 2025, ApJ, 982, 178 [Google Scholar]
- Darvish, B., Mobasher, B., Martin, D. C., et al. 2017, ApJ, 837, 16 [Google Scholar]
- Davé, R., Anglés-Alcázar, D., Narayanan, D., et al. 2019, MNRAS, 486, 2827 [Google Scholar]
- Davis, T. A., Alatalo, K., Bureau, M., et al. 2013, MNRAS, 429, 534 [Google Scholar]
- Delhaize, J., Meyer, M. J., Staveley-Smith, L., & Boyle, B. J. 2013, MNRAS, 433, 1398 [NASA ADS] [CrossRef] [Google Scholar]
- Dome, T., Tacchella, S., Fialkov, A., et al. 2024, MNRAS, 527, 2139 [Google Scholar]
- Donevski, D., Damjanov, I., Nanni, A., et al. 2023, A&A, 678, A35 [NASA ADS] [CrossRef] [EDP Sciences] [Google Scholar]
- Dutta, R., Srianand, R., & Gupta, N. 2019, MNRAS, 489, 1099 [NASA ADS] [CrossRef] [Google Scholar]
- Dutta, R., Kurapati, S., Aditya, J. N. H. S., et al. 2022, JApA, 43, 103 [Google Scholar]
- Ellison, S., Huang, Q., Yang, D., et al. 2025, Open J. Astrophys., 8, 87 [Google Scholar]
- Fabello, S., Catinella, B., Giovanelli, R., et al. 2011, MNRAS, 411, 993 [Google Scholar]
- Geréb, K., Catinella, B., Cortese, L., et al. 2016, MNRAS, 462, 382 [Google Scholar]
- Geréb, K., Janowiecki, S., Catinella, B., Cortese, L., & Kilborn, V. 2018, MNRAS, 476, 896 [NASA ADS] [Google Scholar]
- Giovanelli, R., Haynes, M. P., Kent, B. R., et al. 2005, AJ, 130, 2598 [Google Scholar]
- Gobat, R., Daddi, E., Magdis, G., et al. 2018, Nat. Astron., 2, 239 [NASA ADS] [CrossRef] [Google Scholar]
- Guo, H., Jones, M. G., Haynes, M. P., & Fu, J. 2020, ApJ, 894, 92 [NASA ADS] [CrossRef] [Google Scholar]
- Guo, H., Jones, M. G., Wang, J., & Lin, L. 2021, ApJ, 918, 53 [NASA ADS] [CrossRef] [Google Scholar]
- Gupta, Y., Ajithkumar, B., Kale, H. S., et al. 2017, Curr. Sci., 113, 707 [NASA ADS] [CrossRef] [Google Scholar]
- Heywood, I., Ponomareva, A. A., Maddox, N., et al. 2024, MNRAS, 534, 76 [Google Scholar]
- Jarvis, M., Taylor, R., Agudo, I., et al. 2016, MeerKAT Science: On the Pathway to the SKA, 6 [Google Scholar]
- Jonas, J., & MeerKAT Team 2016, MeerKAT Science: On the Pathway to the SKA, 1 [Google Scholar]
- Koekemoer, A. M., Aussel, H., Calzetti, D., et al. 2007, ApJS, 172, 196 [Google Scholar]
- Lah, P., Chengalur, J. N., Briggs, F. H., et al. 2007, MNRAS, 376, 1357 [Google Scholar]
- Lee, M. M., Steidel, C. C., Brammer, G., et al. 2024, MNRAS, 527, 9529 [Google Scholar]
- Li, Y. A., Ho, L. C., Shangguan, J., Li, Z.-Y., & Peng, Y. 2025, ApJ, 984, 184 [Google Scholar]
- Looser, T. J., D’Eugenio, F., Maiolino, R., et al. 2025, A&A, 697, A88 [NASA ADS] [CrossRef] [EDP Sciences] [Google Scholar]
- Lorenzon, G., Donevski, D., Lisiecki, K., et al. 2025, A&A, 693, A118 [NASA ADS] [CrossRef] [EDP Sciences] [Google Scholar]
- Maccagni, F. M., Morganti, R., Oosterloo, T. A., Geréb, K., & Maddox, N. 2017, A&A, 604, A43 [NASA ADS] [CrossRef] [EDP Sciences] [Google Scholar]
- Maddox, N., Frank, B. S., Ponomareva, A. A., et al. 2021, A&A, 646, A35 [NASA ADS] [CrossRef] [EDP Sciences] [Google Scholar]
- Marasco, A., Crain, R. A., Schaye, J., et al. 2016, MNRAS, 461, 2630 [Google Scholar]
- Massey, R., Stoughton, C., Leauthaud, A., et al. 2010, MNRAS, 401, 371 [NASA ADS] [CrossRef] [Google Scholar]
- Meyer, M. 2009, Panoramic Radio Astronomy: Wide-field 1-2 GHz Research on Galaxy Evolution, 15 [Google Scholar]
- Michałowski, M. J., Gall, C., Hjorth, J., et al. 2024, ApJ, 964, 129 [CrossRef] [Google Scholar]
- Morishita, T., Abdurro’uf, Hirashita, H., et al. 2022, ApJ, 938, 144 [Google Scholar]
- Muzzin, A., Marchesini, D., Stefanon, M., et al. 2013, ApJ, 777, 18 [NASA ADS] [CrossRef] [Google Scholar]
- Nanni, A., Cristallo, S., Donevski, D., et al. 2024, A&A, 684, A163 [NASA ADS] [CrossRef] [EDP Sciences] [Google Scholar]
- Péroux, C., & Howk, J. C. 2020, ARA&A, 58, 363 [CrossRef] [Google Scholar]
- Planck Collaboration VI. 2020, A&A, 641, A6 [NASA ADS] [CrossRef] [EDP Sciences] [Google Scholar]
- Popesso, P., Concas, A., Cresci, G., et al. 2023, MNRAS, 519, 1526 [Google Scholar]
- Rhee, J., Meyer, M., Popping, A., et al. 2023, MNRAS, 518, 4646 [Google Scholar]
- Rodighiero, G., Bisigello, L., Iani, E., et al. 2023, MNRAS, 518, L19 [Google Scholar]
- Saintonge, A., & Catinella, B. 2022, ARA&A, 60, 319 [NASA ADS] [CrossRef] [Google Scholar]
- Saintonge, A., Kauffmann, G., Kramer, C., et al. 2011, MNRAS, 415, 32 [NASA ADS] [CrossRef] [Google Scholar]
- Serra, P., Oosterloo, T., Morganti, R., et al. 2012, MNRAS, 422, 1835 [Google Scholar]
- Shirley, R., Roehlly, Y., Hurley, P. D., et al. 2019, MNRAS, 490, 634 [Google Scholar]
- Siegel, J. C., Setton, D. J., Greene, J. E., et al. 2025, ApJ, 985, 125 [Google Scholar]
- Sinigaglia, F., Rodighiero, G., Elson, E., et al. 2022, ApJ, 935, L13 [NASA ADS] [CrossRef] [Google Scholar]
- Sinigaglia, F., Rodighiero, G., Elson, E., et al. 2024, MNRAS, 529, 4192 [NASA ADS] [CrossRef] [Google Scholar]
- Speagle, J. S., Steinhardt, C. L., Capak, P. L., & Silverman, J. D. 2014, ApJS, 214, 15 [Google Scholar]
- Walter, F., Carilli, C., Neeleman, M., et al. 2020, ApJ, 902, 111 [Google Scholar]
- Whitaker, K. E., Narayanan, D., Williams, C. C., et al. 2021, ApJ, 922, L30 [NASA ADS] [CrossRef] [Google Scholar]
- Xi, H., Peng, B., Staveley-Smith, L., et al. 2024, ApJS, 274, 18 [NASA ADS] [Google Scholar]
- Yıldız, M. K., Peletier, R. F., Duc, P. A., & Serra, P. 2020, A&A, 636, A8 [EDP Sciences] [Google Scholar]
- Young, L. M., Scott, N., Serra, P., et al. 2014, MNRAS, 444, 3408 [NASA ADS] [CrossRef] [Google Scholar]
- Zhang, C., Peng, Y., Ho, L. C., et al. 2019, ApJ, 884, L52 [NASA ADS] [CrossRef] [Google Scholar]
Appendix A: Stacking method and variations with respect to Bianchetti et al. 2025
We hereby summarize in short the main steps of the stacking procedure outlined in Bianchetti et al. (2025), to which we refer for an exhaustive description. We extract spectra of galaxies by collapsing subcubes defined by an aperture equal to three times the beamsize in the sky plane. Instead of using the mean beamsize across the frequency range and adopting it as a fixed reference (B25), we now create apertures as large as three times the beamsize accounting for its variation as a function of frequency. This way, aperture adapts to the frequency channel. Subcubes extend roughly ±2000 km s−1 in the spectral direction and we regrid them in frequency to get a homogeneous channel width of 100 km s−1. Then, we assign galaxies a weight given by 1/σγ, where σ is the RMS noise computed on the wings of the individual spectrum and γ is a power index to be selected. We pick γ = 1 following Fabello et al. (2011), Sinigaglia et al. (2022, 2024), Bianchetti et al. (2025). At odds with B25, we do not weigh by primary beam, as the MIGHTEE-HI DR1 data are already primary beam-corrected. Also, since the noise profile is slightly different, the RFI mask that we use to flag channels with unusual noise peaks is slightly more relaxed than the one used for Early Science data.
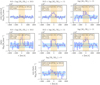 |
Fig. A.1. MHI stacks of the two different samples, photometrically selected and spectroscopically selected. All panels represent the average spectrum of the reference bin or sample. Upper panels refer to the former, split in three different stellar mass bins. Panels from the central row depict stacks from the dusty spectroscopical sample, again in the same stellar mass bins. Finally, the lower panel shows the stack of spectroscopically selected galaxies, on the whole complete range of stellar mass, with no infrared counterparts. In all cases, we use a bin width Δv = 100 km s−1. The yellow, shaded area represents the integration range in the rest-frame velocity domain, spanning from −500 km s−1 to +500 km s−1. The red, dotted line marks the MHI = 0 line. For each panel, we report the extracted hydrogen mass and its associated uncertainty, estimated as the RMS of the bins in the region of the stacked spectrum lying outside the integration range (cyan shaded region). Finally, we report the S/N and the number of spectra selected in that stellar mass bin. |
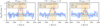 |
Fig. A.2. MHI stacks of dusty spectroscopically selected galaxies divided into three Dn4000 bins. Each panel represents a bin, indicated on top. See Fig. A.1 for details on color-coding. |
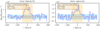 |
Fig. A.3. MHI stacks of dusty spectroscopically selected galaxies divided into two morphology bins: on the left panel, spirals and irregulars are stacked together; on the right panel, we show the stack of spheroids. See Fig. A.1 for details on color-coding. |
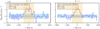 |
Fig. A.4. MHI stacks of dusty spectroscopically selected galaxies divided into two environment bins: on the left panel, we show the stack of galaxies in low-density regions, marked by overdensities δ < 1; the right panel displays the stack of galaxies in higher density environments. See Fig. A.1 for details on color-coding. |
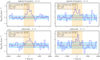 |
Fig. A.5. MHI stacks of dusty spectroscopically selected galaxies divided into four different groups, obtained by crossing morphology and environment phase space. Morphology class and environment selection condition is indicated on top each panel. See Fig. A.1 for details on color-coding. |
HI mass is computed by integrating the final, stacked spectrum within a ±500 km s−1 spectral range. This is slightly larger than what was done in B25, since stacked spectra in this work are generally broader. The reason for that might be linked to an intrinsically higher accuracy of the spec-z of SFGs, whose spectrum is typically crowded with emission lines, which makes redshift determination more precise. Uncertainties on HI mass are given by the RMS computed on the wings of the spectrum, i.e. the channels lying outside the integration region.
Figures A.1–A.5 show the stacks from which we estimate the HI masses used in the analysis. Note that A.1 sustains the claim that non-dusty galaxies contain no HI. We have tested whether or not the non-detection of HI in non-dusty galaxies solely depends on the limited size of the sample: in fact, non-dusty galaxies in the sample are roughly as numerous as one-third of the total dusty galaxies. However, the stack of several realizations of a subset of the dusty QGs, as big as the sample of non-dusty, always yielded a detection, proving that this is a physically driven result. Thus, we can assume that no HI above the depicted upper limit (gray triangle in Fig. 2) is contained in non-dusty galaxies.
Appendix B: Consistency with scaling relation
In this work we stack candidate QGs from a spectroscopic catalog on the MIGHTEE-HI DR1 data (Heywood et al. 2024): among the several data products available, we use the HI datacubes reduced with a robustness parameter r = 0.0, with a final synthesized beam around 20" and spectral resolution of 105 KHz. and with no additional polynomial image-plane continuum subtraction, as we perform our own baseline correction as explained in Sect. A. Throughout the paper, we make direct comparison with the MHI-M⋆ scaling relation extracted by B25 from the MIGHTEE-HI Early Science Data (ES) (Maddox et al. 2021).
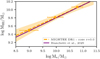 |
Fig. B.1. Comparison between the MHI-M⋆ scaling relation from B25 (purple solid line) and the MHI values extracted from the stacks performed on the MIGHTEE-DR1 data with the same settings (orange squares), fitted by a linear model (dashed orange line). |
To make sure these results can be consistently compared, considering both the change in dataset and the slight modifications of the pipeline discussed in Appendix A, we stack MIGHTEE DR1 spectra extracted the same catalog of SFGs that was used in B25. Results of this consistency check are illustrated in Fig. B.1, where the solid purple line marks the scaling relation reported by B25, while the orange dots represent the HI masses inferred from the stacks performed on the three MIGHTEE mass bins (8.0 < log M⋆ < 9.5, 9.5 < log(M⋆/M⊙) < 10.5, log(M⋆/M⊙) > 10.5) described in that paper. All points are consistent with the solid line within the uncertainties, proving that the ES and DR1 datasets are completely consistent, as already demonstrated by Heywood et al. (2024).
Appendix C: Morphology classification
In this appendix we provide some example of the visual classification that we performed on the sample of dusty QGs drawn from (D23). We checked ACS/HST images over the COSMOS field in the F814W filter. Sources are separated into spirals, irregulars and spheroids. The latter class includes a variety of environmental signatures, that might be connected to the observed enhancement of dust and HI in this specific sample. Figure C.1 illustrates cutouts of size 15"x15" (corresponding to ∼80 kpc at z ∼ 0.37) for: isolated spheroids (top row), spheroids with potential satellites or ongoing minor mergers (middle row), spheroids in groups (bottom row).
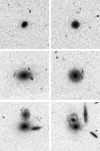 |
Fig. C.1. 15"x15" ACS/HST cutouts for dusty spheroids. Cases for isolated systems (top row), accretion through minor mergers (middle row) and spheroids in groups (bottom row) are shown. |
All Tables
All Figures
|
Fig. 1. Two-dimensional distributions of galaxy properties from three investigated samples. Upper panel: Scatter plot of the spectroscopic sample from D23 in the Dn4000 − log M⋆ plane. Red triangles indicate galaxies with an IR counterpart, while gray circles mark galaxies with no IR detection. Histograms above and right of the scatter plot show the distribution of these parameters for the two infrared populations, using the same color coding. Lower panel: Distribution of galaxies from the spectroscopic sample of D23, plotted in comparison to the MS galaxies shown in the left panel. Red points represent galaxies with an IR counterpart, while gray points represent galaxies without an IR counterpart. The sample is compared with an MS model by Popesso et al. (2023) (black solid line), while the dashed black line indicates a 0.3 dex scatter around the MS. |
| In the text | |
|
Fig. 2. Comparison of average HI content between SFGs and QGs. The solid purple line represents the MHI − M⋆ scaling relation for SFGs from B25. Blue circles show HI masses from color-selected QGs in two stellar mass bins: a circle at the high-mass end (significant detection) and a triangle at the low-mass end (upper limit only). Red squares indicate HI masses from stacked spectra of dusty, spectroscopically selected QGs in two mass bins. A gray triangle marks the upper limit from stacking non-dusty, spectroscopically selected QGs. |
| In the text | |
|
Fig. 3. Average HI fraction of dusty QGs in Dn4000 bins. The average fHI = MHI/M⋆ is shown in Dn4000 bins (1.5 < Dn4000 < 1.61, 1.61 < Dn4000 < 1.8 and Dn4000 > 1.8), plotted against their average value. The dashed line indicates the best-fit linear model in both panels. |
| In the text | |
|
Fig. 4. Logarithm of the ratio between the average HI mass of dusty QGs and the equivalent HI contained at the same stellar mass in MS galaxies according to B25, plotted against the median overdensity δ for each galaxy bin. A dashed horizontal line at y = 0 indicates the HI content in SFGs. Purple filled squares mark the HI estimates from stacking dusty galaxies in lower-density (δ < 1) and in higher-density (δ > 1) bins, irrespective of morphology; shaded bands indicate uncertainties. Red and teal dotted lines indicate the HI estimate from stacking spirals and spheroids, respectively, irrespective of environment, spanning across the δ range. |
| In the text | |
|
Fig. 5. Logarithm of the ratio between average HI mass of dusty QGs and equivalent HI mass in MS galaxies at the same stellar mas according to B25, plotted against the median overdensity δ for each galaxy bin. A dashed horizontal line at y = 0 indicates the HI content of SFGs. Filled purple squares mark the HI estimates from stacking dusty galaxies in lower-density (δ < 1) and in higher-density (δ > 1) bins. Empty red stars represent spiral and irregular galaxies divided into the two separate δ bins. Empty teal circles indicate spheroid galaxies in the same δ bins. |
| In the text | |
|
Fig. A.1. MHI stacks of the two different samples, photometrically selected and spectroscopically selected. All panels represent the average spectrum of the reference bin or sample. Upper panels refer to the former, split in three different stellar mass bins. Panels from the central row depict stacks from the dusty spectroscopical sample, again in the same stellar mass bins. Finally, the lower panel shows the stack of spectroscopically selected galaxies, on the whole complete range of stellar mass, with no infrared counterparts. In all cases, we use a bin width Δv = 100 km s−1. The yellow, shaded area represents the integration range in the rest-frame velocity domain, spanning from −500 km s−1 to +500 km s−1. The red, dotted line marks the MHI = 0 line. For each panel, we report the extracted hydrogen mass and its associated uncertainty, estimated as the RMS of the bins in the region of the stacked spectrum lying outside the integration range (cyan shaded region). Finally, we report the S/N and the number of spectra selected in that stellar mass bin. |
| In the text | |
|
Fig. A.2. MHI stacks of dusty spectroscopically selected galaxies divided into three Dn4000 bins. Each panel represents a bin, indicated on top. See Fig. A.1 for details on color-coding. |
| In the text | |
|
Fig. A.3. MHI stacks of dusty spectroscopically selected galaxies divided into two morphology bins: on the left panel, spirals and irregulars are stacked together; on the right panel, we show the stack of spheroids. See Fig. A.1 for details on color-coding. |
| In the text | |
|
Fig. A.4. MHI stacks of dusty spectroscopically selected galaxies divided into two environment bins: on the left panel, we show the stack of galaxies in low-density regions, marked by overdensities δ < 1; the right panel displays the stack of galaxies in higher density environments. See Fig. A.1 for details on color-coding. |
| In the text | |
|
Fig. A.5. MHI stacks of dusty spectroscopically selected galaxies divided into four different groups, obtained by crossing morphology and environment phase space. Morphology class and environment selection condition is indicated on top each panel. See Fig. A.1 for details on color-coding. |
| In the text | |
|
Fig. B.1. Comparison between the MHI-M⋆ scaling relation from B25 (purple solid line) and the MHI values extracted from the stacks performed on the MIGHTEE-DR1 data with the same settings (orange squares), fitted by a linear model (dashed orange line). |
| In the text | |
|
Fig. C.1. 15"x15" ACS/HST cutouts for dusty spheroids. Cases for isolated systems (top row), accretion through minor mergers (middle row) and spheroids in groups (bottom row) are shown. |
| In the text | |
Current usage metrics show cumulative count of Article Views (full-text article views including HTML views, PDF and ePub downloads, according to the available data) and Abstracts Views on Vision4Press platform.
Data correspond to usage on the plateform after 2015. The current usage metrics is available 48-96 hours after online publication and is updated daily on week days.
Initial download of the metrics may take a while.