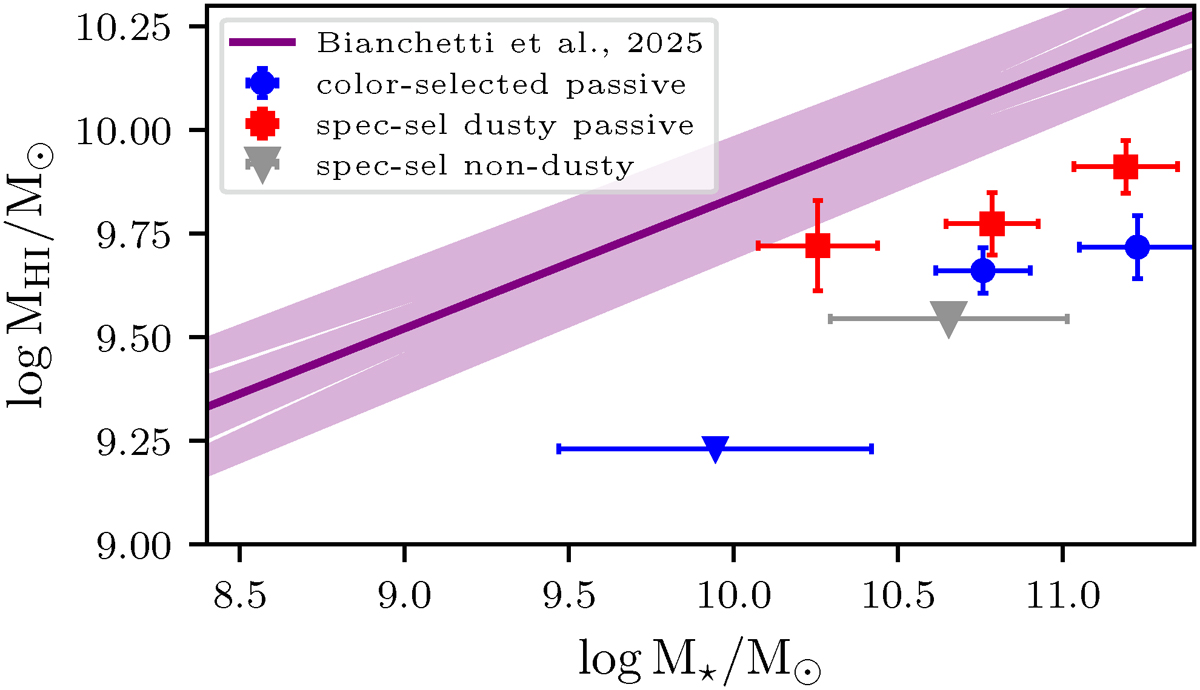
Fig. 2.
Download original image
Comparison of average HI content between SFGs and QGs. The solid purple line represents the MHI − M⋆ scaling relation for SFGs from B25. Blue circles show HI masses from color-selected QGs in two stellar mass bins: a circle at the high-mass end (significant detection) and a triangle at the low-mass end (upper limit only). Red squares indicate HI masses from stacked spectra of dusty, spectroscopically selected QGs in two mass bins. A gray triangle marks the upper limit from stacking non-dusty, spectroscopically selected QGs.
Current usage metrics show cumulative count of Article Views (full-text article views including HTML views, PDF and ePub downloads, according to the available data) and Abstracts Views on Vision4Press platform.
Data correspond to usage on the plateform after 2015. The current usage metrics is available 48-96 hours after online publication and is updated daily on week days.
Initial download of the metrics may take a while.