Open Access
Fig. 3.
Download original image
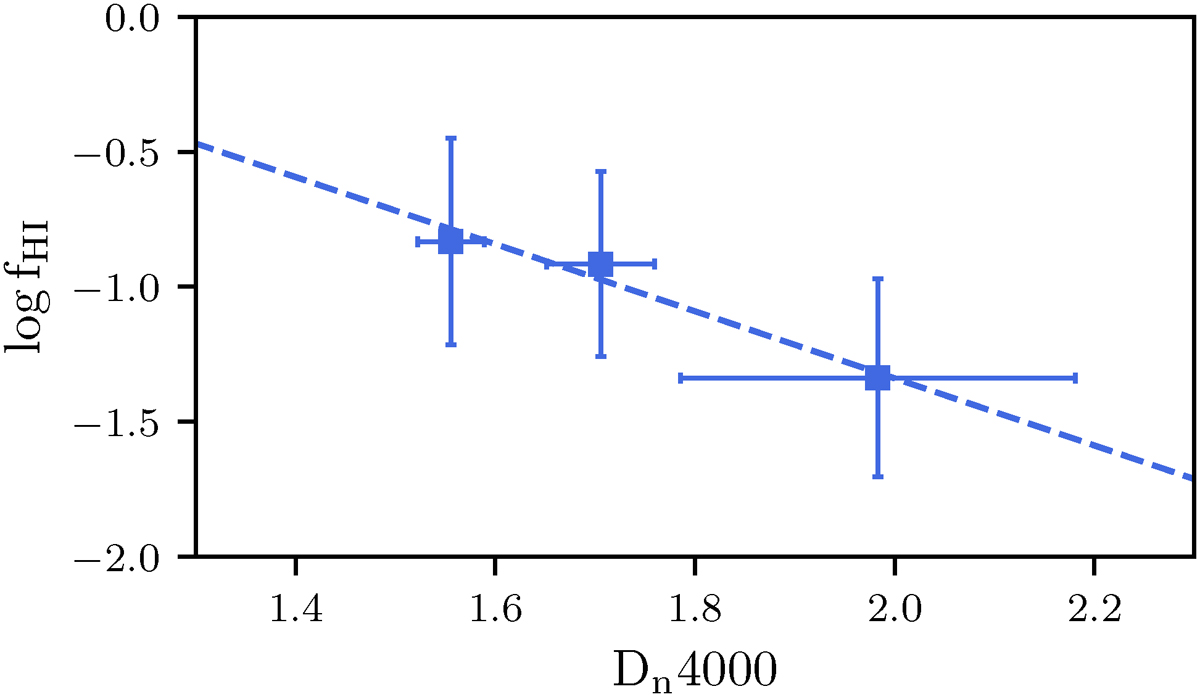
Average HI fraction of dusty QGs in Dn4000 bins. The average fHI = MHI/M⋆ is shown in Dn4000 bins (1.5 < Dn4000 < 1.61, 1.61 < Dn4000 < 1.8 and Dn4000 > 1.8), plotted against their average value. The dashed line indicates the best-fit linear model in both panels.
Current usage metrics show cumulative count of Article Views (full-text article views including HTML views, PDF and ePub downloads, according to the available data) and Abstracts Views on Vision4Press platform.
Data correspond to usage on the plateform after 2015. The current usage metrics is available 48-96 hours after online publication and is updated daily on week days.
Initial download of the metrics may take a while.