Fig. 4.
Download original image
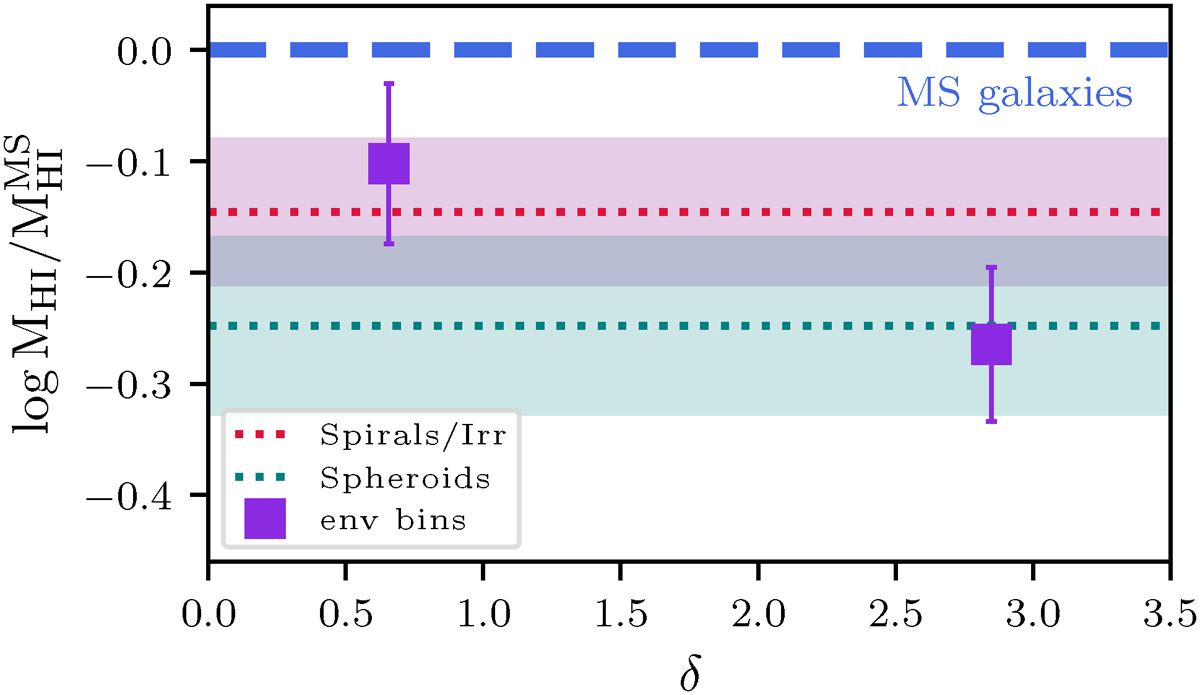
Logarithm of the ratio between the average HI mass of dusty QGs and the equivalent HI contained at the same stellar mass in MS galaxies according to B25, plotted against the median overdensity δ for each galaxy bin. A dashed horizontal line at y = 0 indicates the HI content in SFGs. Purple filled squares mark the HI estimates from stacking dusty galaxies in lower-density (δ < 1) and in higher-density (δ > 1) bins, irrespective of morphology; shaded bands indicate uncertainties. Red and teal dotted lines indicate the HI estimate from stacking spirals and spheroids, respectively, irrespective of environment, spanning across the δ range.
Current usage metrics show cumulative count of Article Views (full-text article views including HTML views, PDF and ePub downloads, according to the available data) and Abstracts Views on Vision4Press platform.
Data correspond to usage on the plateform after 2015. The current usage metrics is available 48-96 hours after online publication and is updated daily on week days.
Initial download of the metrics may take a while.