Fig. 5.
Download original image
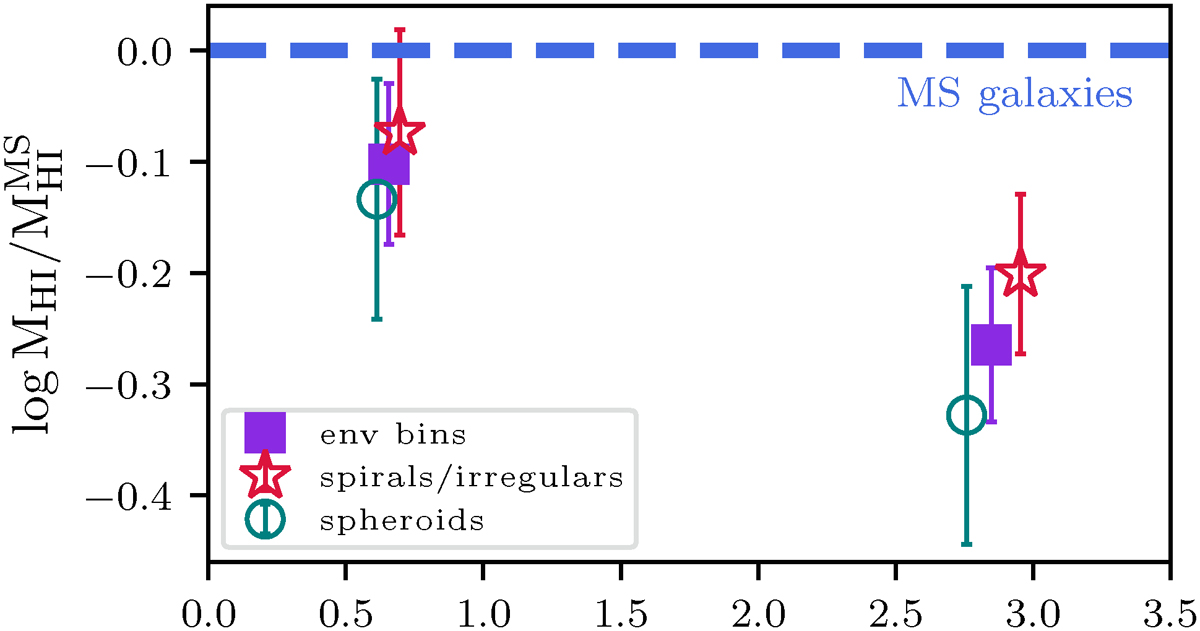
Logarithm of the ratio between average HI mass of dusty QGs and equivalent HI mass in MS galaxies at the same stellar mas according to B25, plotted against the median overdensity δ for each galaxy bin. A dashed horizontal line at y = 0 indicates the HI content of SFGs. Filled purple squares mark the HI estimates from stacking dusty galaxies in lower-density (δ < 1) and in higher-density (δ > 1) bins. Empty red stars represent spiral and irregular galaxies divided into the two separate δ bins. Empty teal circles indicate spheroid galaxies in the same δ bins.
Current usage metrics show cumulative count of Article Views (full-text article views including HTML views, PDF and ePub downloads, according to the available data) and Abstracts Views on Vision4Press platform.
Data correspond to usage on the plateform after 2015. The current usage metrics is available 48-96 hours after online publication and is updated daily on week days.
Initial download of the metrics may take a while.