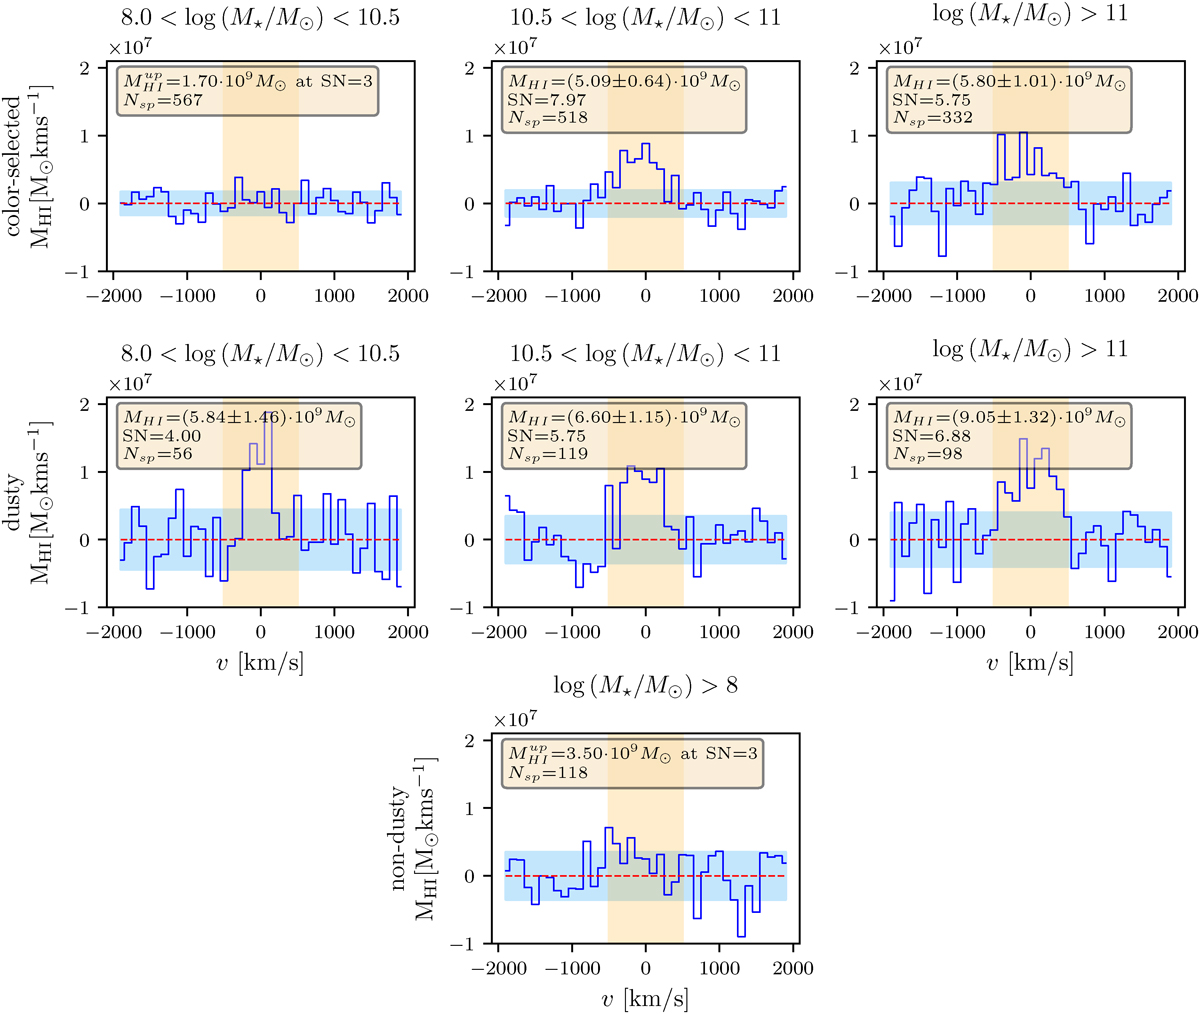
Fig. A.1.
Download original image
MHI stacks of the two different samples, photometrically selected and spectroscopically selected. All panels represent the average spectrum of the reference bin or sample. Upper panels refer to the former, split in three different stellar mass bins. Panels from the central row depict stacks from the dusty spectroscopical sample, again in the same stellar mass bins. Finally, the lower panel shows the stack of spectroscopically selected galaxies, on the whole complete range of stellar mass, with no infrared counterparts. In all cases, we use a bin width Δv = 100 km s−1. The yellow, shaded area represents the integration range in the rest-frame velocity domain, spanning from −500 km s−1 to +500 km s−1. The red, dotted line marks the MHI = 0 line. For each panel, we report the extracted hydrogen mass and its associated uncertainty, estimated as the RMS of the bins in the region of the stacked spectrum lying outside the integration range (cyan shaded region). Finally, we report the S/N and the number of spectra selected in that stellar mass bin.
Current usage metrics show cumulative count of Article Views (full-text article views including HTML views, PDF and ePub downloads, according to the available data) and Abstracts Views on Vision4Press platform.
Data correspond to usage on the plateform after 2015. The current usage metrics is available 48-96 hours after online publication and is updated daily on week days.
Initial download of the metrics may take a while.