Fig. 2.
Download original image
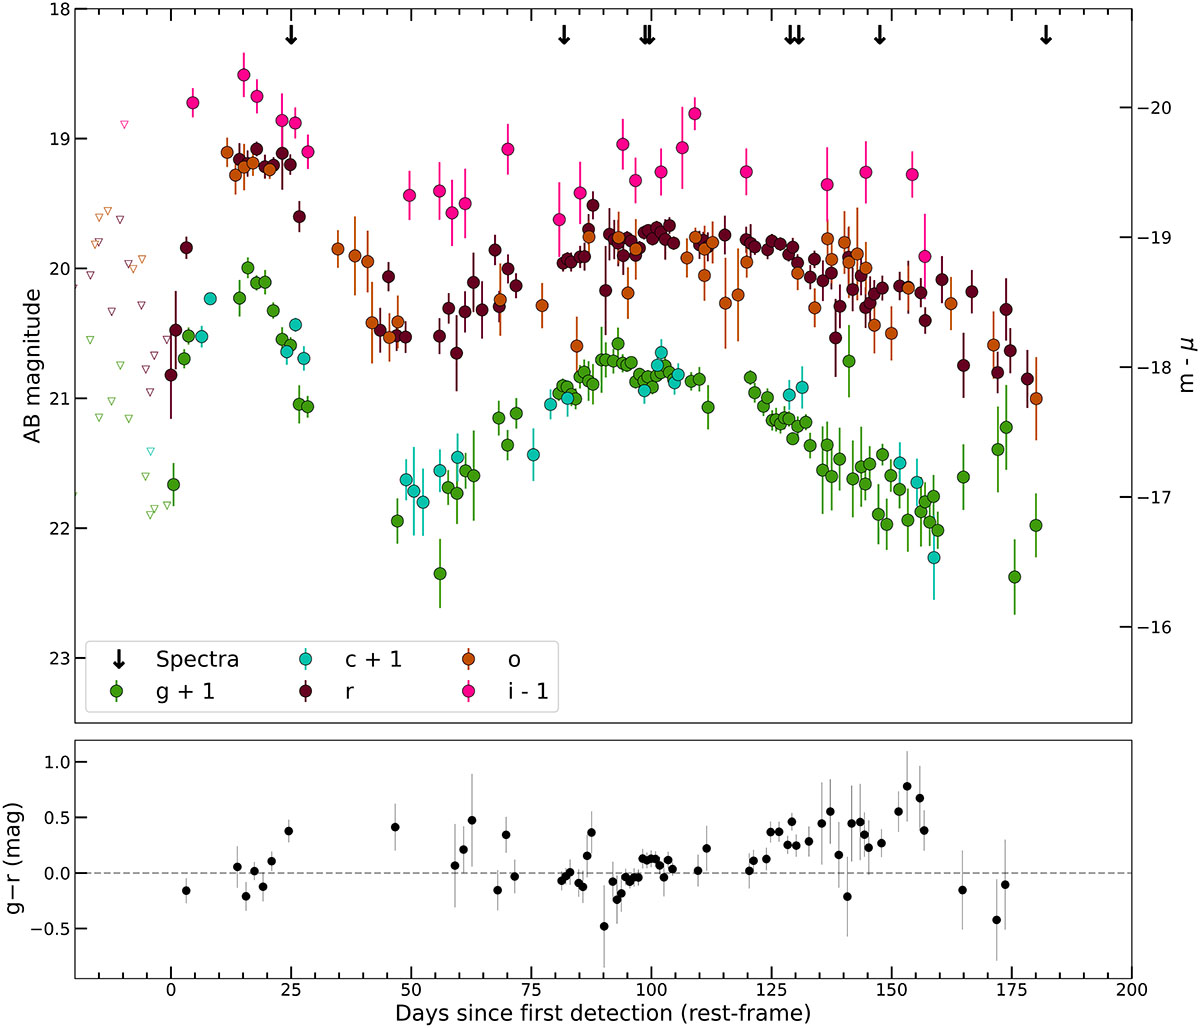
Light curves of SN 2020aeuh. They are corrected for MW extinction, with phases in rest-frame days since first detection. Early non-detections with 5σ upper limits are indicated by downward-facing empty triangles. Apparent magnitudes are provided on the left-hand axis and absolute magnitudes to the right. The photometry has been binned into one-night bins. The arrows on top indicate the epochs of spectroscopy. The lower panel shows the g − r colour evolution.
Current usage metrics show cumulative count of Article Views (full-text article views including HTML views, PDF and ePub downloads, according to the available data) and Abstracts Views on Vision4Press platform.
Data correspond to usage on the plateform after 2015. The current usage metrics is available 48-96 hours after online publication and is updated daily on week days.
Initial download of the metrics may take a while.