| Issue |
A&A
Volume 704, December 2025
|
|
|---|---|---|
| Article Number | A135 | |
| Number of page(s) | 14 | |
| Section | Stellar structure and evolution | |
| DOI | https://doi.org/10.1051/0004-6361/202556369 | |
| Published online | 05 December 2025 | |
A thermonuclear supernova interacting with hydrogen- and helium-deficient circumstellar material
SN 2020aeuh as a SN Ia-CSM-C/O?
1
The Oskar Klein Centre, Department of Astronomy, Stockholm University, AlbaNova, SE-10691 Stockholm, Sweden
2
Graduate Institute for Advanced Studies, SOKENDAI, 2-21-1 Osawa, Mitaka, Tokyo 181-8588, Japan
3
National Astronomical Observatory of Japan, National Institutes of Natural Sciences, 2-21-1 Osawa, Mitaka, Tokyo 181-8588, Japan
4
The Oskar Klein Centre, Department of Physics, Stockholm University, AlbaNova, SE-10691 Stockholm, Sweden
5
Hamburger Sternwarte, University of Hamburg, Gojenbergsweg 112, D-21029 Hamburg, Germany
6
Center for Interdisciplinary Exploration and Research in Astrophysics (CIERA), Northwestern University, 1800 Sherman Ave., Evanston, IL 60201, USA
7
School of Physics and Astronomy, Monash University, Clayton, VIC 3800, Australia
8
University of North Carolina at Chapel Hill, 120 E. Cameron Ave., Chapel Hill, NC 27514, USA
9
Department of Astronomy, University of California, Berkeley, CA 94720-3411, USA
10
IPAC, California Institute of Technology, 1200 E. California Blvd, Pasadena, CA 91125, USA
11
Division of Physics, Mathematics and Astronomy, California Institute of Technology, Pasadena, CA 91125, USA
12
MIT Kavli Institute for Astrophysics and Space Research, 70 Vassar St., Cambridge, MA 02139, USA
13
Department of Physics, Lancaster University, Lancaster LA1 4YB, UK
14
Caltech Optical Observatories, California Institute of Technology, Pasadena, CA 91125, USA
15
School of Physics, Trinity College Dublin, The University of Dublin, Dublin 2, Ireland
16
Department of Physics, Drexel University, Philadelphia, PA 19104, USA
17
Department of Physics, Tsinghua University, Qinghua Yuan, Beijing 100084, China
⋆ Corresponding author: This email address is being protected from spambots. You need JavaScript enabled to view it.
Received:
11
July
2025
Accepted:
24
September
2025
Abstract
Identifying the progenitors of thermonuclear supernovae (Type Ia supernovae; SNe Ia) remains a key objective in contemporary astronomy. The rare sub-class of SNe Ia-CSM that interacts with circumstellar material (CSM) allows for studies of the progenitor’s environment before explosion, and generally favours single-degenerate progenitor channels. The case of SN Ia-CSM PTF11kx clearly connected thermonuclear explosions with hydrogen-rich CSM-interacting events, and the more recent SN 2020eyj connected SNe Ia with helium-rich companion progenitors. Both of these objects displayed delayed CSM interaction which established their thermonuclear nature. Here we present a study of SN 2020aeuh, a Type Ia-CSM with delayed interaction. We analyse photometric and spectroscopic data that monitor the evolution of SN 2020aeuh and compare its properties with those of peculiar SNe Ia and core-collapse SNe. At early times, the evolution of SN 2020aeuh resembles a slightly overluminous SN Ia. Later, the interaction-dominated spectra develop the same pseudocontinuum seen in Type Ia-CSM PTF11kx and SN 2020eyj. However, the later-time spectra of SN 2020aeuh lack hydrogen and helium narrow lines. Instead, a few narrow lines could be attributed to carbon and oxygen. We fit the pseudobolometric light curve with a CSM-interaction model, yielding a CSM mass of 1 − 2 M⊙. We propose that SN 2020aeuh was a Type Ia supernova that eventually interacted with a dense medium that was deficient in both hydrogen and helium. Whereas previous SNe Ia-CSM constitute our best evidence of non-degenerate companion progenitors, the CSM around SN 2020aeuh is more difficult to understand. We include a hydrodynamical simulation for a double-degenerate dynamical collision to showcase that such a progenitor scenario could produce significant amounts of hydrogen-poor CSM, although likely not as much as the inferred CSM mass around SN 2020aeuh. It is clear that SN 2020aeuh challenges current models of stellar evolution leading up to a SN Ia explosion.
Key words: supernovae: general / supernovae: individual: SN 2020aeuh / supernovae: individual: SN 2020eyj
© The Authors 2025
 Open Access article, published by EDP Sciences, under the terms of the Creative Commons Attribution License (https://creativecommons.org/licenses/by/4.0), which permits unrestricted use, distribution, and reproduction in any medium, provided the original work is properly cited.
This article is published in open access under the Subscribe to Open model. This email address is being protected from spambots. You need JavaScript enabled to view it. to support open access publication.
1. Introduction
Supernovae (SNe) interacting with circumstellar material (CSM) are classified based on their spectra, which are dominated by narrow (≲103 km s−1) emission lines (e.g. Gal-Yam 2017). These emission lines are interpreted as signs of shock interaction between fast-moving SN ejecta and slow-moving CSM (see e.g. Smith 2017, for a review). The most commonly observed subtypes of interacting SNe are Type IIn (Schlegel 1990; Nyholm et al. 2020) and Type Ibn (Hosseinzadeh et al. 2017), which have spectra dominated by hydrogen (H) and helium (He) emission lines, respectively. Recently, the classes of H/He-poor CSM-interacting stripped-envelope core-collapse supernovae (SNe Icn; Gal-Yam et al. 2022; Perley et al. 2022) and even a proposed SN Ien (Schulze et al. 2025), were also discovered.
A small fraction of thermonuclear SNe Ia also exhibit evidence of strong CSM interaction (Silverman et al. 2013a; Sharma et al. 2023). These Type Ia-CSM SNe can show diluted SN Ia absorption features at peak brightness, but at later phases their spectra resemble those of SNe IIn with strong narrow H emission. SNe Ia-CSM therefore constitute some of the best candidates for the single-degenerate (SD) channel for SNe Ia, in which a white dwarf (WD) accretes matter from a non-degenerate red giant, an AGB star, a He star, or a main-sequence companion star. In the alternative double-degenerate (DD) channel, in which the SN Ia explosion would arise during the merger of two WDs, the CSM density should be much lower since the WDs must have lost their envelopes long ago (e.g. Shen et al. 2013).
A difficulty in the study of interacting SNe and their progenitors is that the CSM interaction typically dominates the spectral and light-curve evolution of the SN, and therefore conceals the underlying SN ejecta (Leloudas et al. 2015). Especially the sub-class of SNe Ia-CSM and their spectroscopic relatives, SNe IIn, spurred a debate in the literature about the thermonuclear versus core-collapse nature of the former (e.g. Hamuy et al. 2003; Benetti et al. 2006). That debate surrounding SNe Ia-CSM was largely resolved with the discovery of PTF11kx (Dilday et al. 2012). Whereas most SNe Ia-CSM have CSM interaction from the beginning, preventing an unambiguous classification, in PTF11kx the CSM interaction was delayed by ∼60 days. Early-time spectra therefore allowed PTF11kx to be securely classified as a SN Ia similar to SN 1991T (Filippenko et al. 1992) and SN 1999aa (Garavini et al. 2004), which are slightly overluminous SNe Ia with weak Si II absorption lines near maximum light. After the CSM interaction set in, PTF11kx revealed a strong, intermediate-width (1000 km s−1) Hα emission line (Silverman et al. 2013b; Graham et al. 2017).
The discovery of the Type Ia-CSM SN 2020eyj, which lacked narrow H lines in the late-time spectra, further argued for a population of thermonuclear progenitors with H-deficient companions (Kool et al. 2023). The unique optical observables of this object (no H but clear He lines) were also complemented with the first radio detection of a SN Ia, further strengthening the evidence of CSM interaction powering the late-time light curve. The discussions in Kool et al. (2023) argued for a progenitor system with a He-donor star, potentially similar to the V445 Puppis system (Woudt et al. 2009).
In this paper, we report on an extensive follow-up campaign of SN 2020aeuh, which based on its peak spectrum was classified as a SN Ia, but where the later spectra and light-curve evolution clearly reveal substantial CSM interaction. SN 2020aeuh thus resembles both PTF11kx and SN 2020eyj in spectral and photometric evolution. The main difference is that the CSM around SN 2020aeuh is both He-poor and H-poor, in contrast to any previous SN Ia-CSM observed.
This paper is organised as follows. In Section 2 we describe the observations of SN 2020aeuh. Section 3 includes analysis and discussion of the light-curve and spectral properties. In Section 4 we fit the late light curve with a CSM interaction model and discuss the implications of our analysis. Section 5 summarises the findings. Throughout this paper we adopt a flat ΛCDM cosmology with H0 = 70 km s−1 Mpc−1 and ΩM = 0.3.
2. Observations
2.1. Discovery, initial observations and classification
SN 2020aeuh (also known as ATLAS20bkbb, ZTF20acyroke) was first reported to the Transient Name Server (TNS1) in January 2021 by the Asteroid Terrestrial-impact Last Alert System (ATLAS) collaboration (Tonry et al. 2021), with their first detection from Christmas day 2020 December 25 (UTC dates are used throughout this paper;  MJD) at 19.27 ± 0.13 mag in the cyan band.
SN 2020aeuh was also observed with the Palomar Schmidt 48-inch (P48) Samuel Oschin telescope as part of the Zwicky Transient Facility (ZTF) survey (Bellm et al. 2019; Graham et al. 2019). Forced photometry revealed a first detection (> 3σ) in the r band already on 2020 December 16 ( MJD), at the J2000.0 co-ordinates RA = 12h35m51.86s, Dec = +37° 42′12.4″, with a host-subtracted brightness of 20.83 ± 0.34 mag. ZTF yielded a non-detection at the 3σ level on the preceding night, with ZTF (5σ) limiting magnitudes in the g and r bands of 20.9 and 20.6 mag, respectively. Phases (in rest-frame days) in this paper will be relative to the first detection by ZTF (
 ), which is also close to the explosion date, given the constraints from the preceding nights.
SN 2020aeuh (Fig. 1) was classified as a Type Ia SN at redshift z = 0.126 (Weil et al. 2021) based on a spectrum obtained on 2021 January 13 with the Ohio State Multi-Object Spectrograph (OSMOS) on the 2.4 m Hiltner telescope, publicly available on the TNS. This is the only spectrum of the early SN Ia phase. A second spectrum was not obtained until 64 days later, after the light curve had started brightening again. This second spectrum was obtained with the Alhambra Faint Object Spectrograph and Camera (ALFOSC) on the Nordic Optical Telescope (NOT; Djupvik & Andersen 2010), and showed a transformed SN, with a spectrum dominated by CSM interaction features (see details in Sect. 3.2).
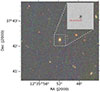 |
Fig. 1. Field of SN 2020aeuh and its host galaxy. The colour image of the field is constructed from Pan-STARRS images in the gri bands (Chambers et al. 2016). The inset shows a negative image of the host galaxy, taken with P60 in the g-band filter at an epoch of 197.8 days. The position of SN 2020aeuh is indicated with red arrows. |
We obtained a redshift of z = 0.1265 ± 0.0028 by measuring host-galaxy absorption lines in a later NOT spectrum, which we use throughout this paper. This is well into the Hubble flow, and thus we use the redshift-derived luminosity distance of 595 Mpc (μ = 38.944 mag).
2.2. Photometry
Following the discovery, we obtained regular follow-up photometry with P48 until SN 2020aeuh faded below the detection limit, 180 days after the first detection. Initial follow-up observations were performed in the g and r bands, with later phases also covered in the i band. This was accomplished with the ZTF camera (Dekany et al. 2020) on the P48. The g-, r-, and i-band P48 data include points on 88, 86, and 23 separate nights, respectively.
The photometry from the P48 come from the ZTF forced-photometry service (Masci et al. 2019, 2023) and from the P60 using the pipeline described in Fremling et al. (2016). The photometric magnitudes of SN 2020aeuh are listed in Table A.1. Additionally, we make use of the forced-photometry service from the ATLAS survey (Tonry et al. 2018; Smith et al. 2020; Shingles et al. 2021), which contains valuable photometry in the o and c bands.
The extinction corrections were applied using the Cardelli et al. (1989) extinction law with RV = 3.1. The extinction in the Milky Way (MW) was obtained from Schlafly & Finkbeiner (2011) as E(B − V) = 0.0156 mag. We do not correct for host-galaxy extinction, since there is no sign of NaI D absorption lines in our spectra. The ATLAS and P48 light curves are shown in Fig. 2, binned into 1-night bins to enhance the signal-to-noise ratio (S/N).
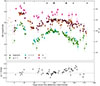 |
Fig. 2. Light curves of SN 2020aeuh. They are corrected for MW extinction, with phases in rest-frame days since first detection. Early non-detections with 5σ upper limits are indicated by downward-facing empty triangles. Apparent magnitudes are provided on the left-hand axis and absolute magnitudes to the right. The photometry has been binned into one-night bins. The arrows on top indicate the epochs of spectroscopy. The lower panel shows the g − r colour evolution. |
2.3. Spectroscopy
The public SN Ia classification spectrum of SN 2020aeuh mentioned above was obtained 24 days after discovery (Weil et al. 2021). The SN never quite reached apparent magnitude 19, which is the cut-off for the Bright Transient Survey (BTS; Fremling et al. 2020; Perley et al. 2020). It was thus too faint for spectral monitoring with the P60 Spectral Energy Distribution Machine (SEDM; Blagorodnova et al. 2018; Rigault et al. 2019), which is typically the workhorse for the BTS project. Instead, once the SN had re-brightened, we obtained four epochs of spectroscopy with the NOT using ALFOSC and three epochs with the Keck I telescope and the Low-Resolution Imaging Spectrometer (LRIS; Oke et al. 1995). A log of the spectral observations is provided in Table A.2. The epochs of spectroscopy are also indicated by the downward-pointing arrows on top of the light curves in Fig. 2. The spectra obtained with ALFOSC and LRIS were reduced with the Pypeit (Prochaska et al. 2020) and LPipe (Perley 2019) software packages, respectively. The spectra were absolute calibrated against the r-band magnitudes using Gaussian process (GP) interpolated magnitudes and then corrected for MW extinction. All spectral data are made available via WISeREP2 (Yaron & Gal-Yam 2012). We present the peak classification spectrum in Fig. 3 and the later sequence of spectra in Fig. 4.
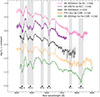 |
Fig. 3. Comparison of the classification spectrum of SN 2020aeuh (in black). A variety of SNe Ia from the literature is shown (see text for discussion and references). The locations of some common transitions are provided at the bottom. |
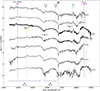 |
Fig. 4. Spectral sequence of SN 2020aeuh at late phases. Our seven spectra between 81 and 181 days past first detection, when the SN is clearly dominated by CSM interaction, are displayed. The smoothed spectra (using a Savitzky–Golay filter) are shown in solid lines, while the original in semi-transparent. The spectral evolution is rather slow during these 100 days. The spectrum with best signal, at 99 days, is compared to spectra of other SNe in Fig. 5. |
3. Analysis
SN 2020aeuh is a rare example of a SN Ia showing delayed CSM interaction. Only three delayed Type Ia-CSM SNe with extended optical light curves have previously been reported in the literature: SN 2002ic (Hamuy et al. 2003; Wood-Vasey et al. 2004), PTF11kx (Dilday et al. 2012), and Type Ia-CSM-He SN 2020eyj (Kool et al. 2023), but see also the discussion in Sharma et al. (2023, their Sect. 4.1). None of these SNe showed light curves with the SN Ia and CSM phases as clearly separated as we see for SN 2020aeuh, nor did they show a clear optical re-brightening (a select number of SNe Ia have shown late-time re-brightening in the mid-infrared due to CSM interaction; Mo et al. 2025). The first peak phase of SN 2020aeuh is consistent with the diffusion peak of a radioactively powered Type I SN. The second phase of the light curve starts at ∼50 days, when the SN increases in brightness again over the course of another ∼50 days, followed by a slow decline.
In this section we first explore the early SN Ia classification spectrum, by comparing it to template spectra of SNe Ia and SNe Ibc included in SuperNova IDentification3 (SNID; Blondin & Tonry 2007). Next, we investigate the properties of the late-time spectra and light curves of SN 2020aeuh in the ‘CSM phase’, and compare SN 2020aeuh to various CSM-interacting SNe from the literature, including PTF11kx and SN 2020eyj.
3.1. Classification spectrum
The first, and only, spectrum obtained during the peak phase of SN 2020aeuh is characterised by broad absorption features (Fig. 3), based on which the SN was classified as a Type Ia (Weil et al. 2021). Using SNID, supplemented with the Type Ibc SN templates from Modjaz et al. (2014), we obtain good (rlap > 12) matches with SN Ia templates, in particular those of subtype Ia-91T. The best core-collapse SN template matches are of Type Ic, such as SN 1994I, with rlap ≈ 7. The phases of the matched SN Ia templates are around 10−15 days post-peak, whereas the matched SN Ic templates are all within a few days of peak brightness. The peak epoch of SN 2020aeuh in the g band is tpeak = 59213.4 MJD (Sect. 3.3), which puts the phase of the classification spectrum at +12 days post peak. The classification spectrum’s phase is consistent with the phases of the SN Ia templates, but inconsistent with any of the matched SN Ic templates.
The spectrum of SN 2020aeuh is well matched in particular to those of Type Ia-91T SNe, for example SN 2007S (Blondin et al. 2012). SNe Ia-91T have previously been connected to SNe Ia-CSM (Leloudas et al. 2015; Phillips et al. 2024). They typically have weak S II and Si II features near maximum light, and are photometrically overluminous compared to normal SNe Ia. These characteristics are shared with SNe Ia-CSM such as SN Ia-CSM PTF11kx and SN 2020eyj, and also with so-called super-Chandrasekhar (SC) SNe Ia such as SN 2020esm (Dimitriadis et al. 2022). In Fig. 3 we show a comparison of these SNe Ia with the classification spectrum of SN 2020aeuh at similar phases post-peak. We thus confirm the classification of SN 2020aeuh as a SN Ia in concordance with the initial report by Weil et al. (2021).
3.2. Late-time spectra
The series of late-time spectra is shown in Fig. 4. The first of these was obtained using ALFOSC (Table A.2) at +81 days, only after it was realised that SN 2020aeuh was not a normal SN Ia.
The seven late-time spectra show little evolution, and are characterised by broad emission features typical of interacting SNe (Fig. 5), such as the steep pseudocontinuum bluewards of ∼5700 Å, attributed to a forest of blended Fe II lines (Chugai 2009; Smith et al. 2012; Stritzinger et al. 2012; Pastorello et al. 2015). We also attribute the pseudocontinuum hump at ∼6000 to ∼6800 Å to a blend of Fe II lines (see e.g. the spectral modelling of interacting SNe Ibn in Dessart et al. 2022). The spectra of SN 2020aeuh also show a broad Ca II near-infrared triplet, which is commonly observed in SNe Ia-CSM (Silverman et al. 2013a), as well as a feature that likely corresponds to Ca II H&K.
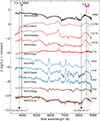 |
Fig. 5. Comparison of the spectrum of SN 2020aeuh at +99 days with a selection of other interacting Type I SNe. The shown Type Ia-CSM (in red) are SNe 2018evt, 2020aekp, 2020qxz (Sharma et al. 2023), and SN 2020eyj (Kool et al. 2023). Type Ibn (blue): SN 2006jc (Foley et al. 2007), SN 2019deh, and SN 2019iep. Type Ic (brown): SN 2019hgp (Gal-Yam et al. 2022) and SN 2021csp (Perley et al. 2022). All spectra have been shifted and multiplied by a numerical factor for visual purposes. Phases are relative to first detection. Dashed lines mark the calcium features. Solid lines indicate the calcium velocity offset estimated for SN 2020aeuh. |
Aside from the features mentioned above, the late-time spectra lack the narrow or intermediate-width emission lines that typically arise from interaction of SN ejecta with CSM. In particular, the highest S/N spectrum of SN 2020aeuh, obtained at +99 days, does not show any evidence of narrow H or He emission. This is unprecedented in a SN Ia-CSM, and somewhat reminiscent of the late-time spectra of SNe Icn (Gal-Yam et al. 2022). The spectrum shows only two clear narrow emission features: a prominent line at an observed wavelength of 8767 ± 8 Å, and a narrow emission line at 6647 ± 10 Å. At the host redshift of z = 0.1265 this translates to rest wavelengths of 7783 ± 8 Å and 5900 ± 9 Å, respectively.
We suggest that the longest wavelength emission feature is due to O Iλ7774, which would imply a velocity offset of the SN from the host redshift of ∼350 km s−1. Assuming such a velocity offset, the other narrow emission feature would reside at ∼5893 Å, consistent with C IIλ5890. That line identification is corroborated by a weak emission feature at 6584 ± 6 Å (with z = 0.1265 and 350 km s−1), which might be interpreted as C IIλ6578. The rare sub-class of core-collapse SNe (CCSNe) that interact with a He/H-free CSM, Type Icn SNe, have spectra that exhibit narrow (P-Cygni) C II emission (Davis et al. 2023), albeit more typically at epochs within a few days post-peak. We do note that C IIλλ7231, 7236 is not observed in any of the spectra of SN 2020aeuh, while this line can be of equal strength to C IIλ5890 in SNe Icn. Alternatively, the 5900 Å line could be due to NaI Dλλ5890, 5896. We disfavour He Iλ5876, as this would require a velocity shift of 1200 km s−1, which is not consistent with the O Iλ7774 identification, and no other He lines such as He I λ7065 are observed.
We examined the three narrow features in the LRIS spectrum with the highest S/N, at 99 days. Both the ∼5893 Å and ∼6584 Å lines have symmetric profiles. This allows for a good Gaussian fit, yielding a full width at half-maximum intensity (FWHM) of 1263 ± 108 km s−1 and 748 ± 220 km s−1 for the suggested C IIλλ5890, 6578, respectively. The most pronounced line at ∼7783 Å shows a blue-wing excess. A Lorentzian fit gives a FWHM of 1343 ± 153 km s−1.
The spectral sequence of SN 2020aeuh shows little to no evolution. The major change involves the disappearance of the narrow features. This is first observed around the +128 d spectrum and onwards (Fig. 4). Simultaneously, at 128 days we observe the emergence of a broad feature within the blue quasicontinuum. This broad line is centred at 4624 ± 5 Å in the rest frame. A potential identification would be Mg I] λ4571. In that case, the offset of ∼350 km s−1 from the host’s redshift is not enough to explain the redshift of the feature. The appearance of a red shoulder of Mg I] could be a visual effect owing to the blending of the line with the numerous iron lines in the blue quasicontinuum.
The main difference between the late-time spectra of SN 2020aeuh and those of other Type Ia-CSM SNe is thus the nature of the emission lines. Normal SNe Ia-CSM show strong Hα and no or only weak He I emission (Sharma et al. 2023). SN 2020eyj did not exhibit Balmer emission, but rather multiple strong He I lines. For SN 2020aeuh, both H and He lines are missing.
3.3. Light curve
The light curve of SN 2020aeuh consists of two distinct phases (Fig. 2). During the first phase, the light curve follows a typical bell shape, which is observed to peak in both the g and r bands around M = −19.7 at 15 days. After the peak, the light curve declines and reddens until ∼40 − 50 days, after which a conspicuous re-brightening sets in.
This re-brightening is mostly pronounced at shorter wavelengths, resulting in a colour change to the blue (at ∼50 − 100 d) before reddening again (at ∼100 − 170 d) during the second decline (Fig. 2, lower panel). A similar colour evolution was observed in the interaction-dominated phase of the Type Ia-CSM-He SN 2020eyj. The development of the blue pseudocontinuum is responsible for the colour evolution during the second peak of SN 2020aeuh, as it overlaps with the ZTF g-band filter (Kool et al. 2023). As is shown in the spectral sequence of SN 2020aeuh (Fig. 4), the blue pseudocontinuum is prominent at +99 d, and then gradually decreases in strength over time, accounting for the rereddening after ∼100 d.
Based on the spectra, we have established that SN 2020aeuh is consistent with a SN Ia during the first peak, and is dominated by CSM interaction during the second peak (Sect. 3.2). We fit the g, r, and i photometry with SN Ia template light curves using SNooPy4 (Burns et al. 2011) to determine the peak of the light curves in the different filters, and to see if the stretch of the light curve is consistent with the peak luminosity in accordance with the Phillips relation (Phillips 1993) for SNe Ia. The light curves (Fig. 6) are well fit by a model with a stretch of 1.19 ± 0.04 corresponding to an expected peak magnitude 0.15 mag fainter than what is observed, which is well within the range for normal Type Ia SNe. We also note that SN 2020aeuh was investigated in connection with the second data release of cosmological SNe Ia from ZTF (Rigault et al. 2025; Dimitriadis et al. 2025; Terwel et al. 2025). It yielded a good SALT2 fit with parameters5Mg = −19.85 ± 0.08 mag and Δm15, g = 0.79 ± 0.15 mag (x1 = 0.92 ± 0.26, c = −0.05 ± 0.04). SNe Ia-CSM have peak magnitudes that are typically brighter than those of normal SNe Ia, in the range −21.3 ≤ MR ≤ −19 mag (Silverman et al. 2013a; Sharma et al. 2023). The r-band light-curve model of SN 2020aeuh peaks at Mr = −19.7 ± 0.1 mag, consistent with the subtype.
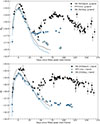 |
Fig. 6. g- (upper panel) and r-band (lower panel) light curves of the delayed SNe Ia-CSM PTF11kx (light blue), SN 2020eyj (dark blue), and SN 2020aeuh (black). The comparison light curves are corrected for the host-galaxy extinction inferred with SNooPy. The modelled light curves are overplotted. All three SNe evolve in a similar way up until ∼25 days after peak brightness, after which the light curves diverge, in particular in the g band. SN 2020aeuh shows a much more conspicuous late-time CSM interacting light curve that even increases in luminosity. |
From the light-curve fits we infer a peak epoch of tpeak = 59213.4 ± 0.3 MJD, in the g band. If we assume the explosion epoch of SN 2020aeuh to be halfway between the last non-detection and the first detection, at 59198.9 ± 0.5 MJD, this results in a rise-time lower limit of 12.5 ± 0.5 days. This is fast for a SN Ia; normal SNe Ia typically have longer rise times (18.5 ± 1.6 d; Miller et al. 2020). Interestingly, both PTF11kx and SN 2020eyj also had unusually fast rise times, at ∼14 days in the g band (Kool et al. 2023).
3.4. Pseudobolometric light curve
To construct a bolometric light curve, we first interpolated the light curves in each band (gcroi) to fill in the missing epochs. The g band has the most populated light curve and was used as the reference band. A polynomial interpolation of sixth order was chosen to estimate the magnitudes of the individual-band light curves at the missing epochs. The polynomial’s order is high enough to capture the two peaks in the light curve and low enough to not significantly overfit the data. We approximated a K-correction by transforming the filters’ effective wavelengths and zero-point fluxes to the rest frame (following the procedure in SUPERBOL; Nicholl 2018) and converted magnitudes to flux densities (Fλ). Once we obtained a spectral energy distribution (SED) consisting of observed and interpolated data points at each epoch, we were able to construct a pseudobolometric light curve employing different assumptions.
First, we integrated the SED across the observed bands (gcroi), enforcing the flux density to go to zero at the edges of the outer filters, using the SuperBol package (Nicholl 2018). This bolometric light curve peaks at ∼1.04 × 1043 erg s−1. Obviously, this pseudobolometric light curve can only serve as a lower limit on the true bolometric light since it ignores the contribution from the near-ultraviolet (NUV) and near-infrared (NIR). Lyman et al. (2014) showed that in the case of stripped-envelope CCSNe (SE-CCSNe), the flux contribution of the optical regime alone (from U to K band) is ∼50%. We can expect the contribution of our optical SED to be even less given that we have narrower wavelength coverage.
Next, we fitted a blackbody spectrum to the observed SEDs and used the best fit to extrapolate the flux densities in the NUV ( ) and NIR (λeff, i − 60 000 Å), using SuperBol. The bolometric light curve constructed in this way peaks at ∼8.75 × 1043 erg s−1. We consider this to be an upper limit for the true bolometric peak luminosity, since for the NUV contribution, a blackbody assumption often overestimates the flux. This is because we can expect significant line blanketing during the early part of the light curve. At later epochs, for the interaction-dominated light curve, we observe the blue pseudocontinuum driving the colour evolution of SN 2020aeuh (Sect. 3.3). This also causes the NUV part to deviate from the blackbody approximation.
In order to relax the blackbody assumption but still include some contribution from the NUV, we linearly extrapolated the flux in that regime. Following the methodology of Lyman et al. (2014), we assumed zero flux at 2000 Å and linearly extrapolate the flux between 2000 Å and λeff, u. Our observations extend until the g band, so we assumed the flux in the u band to be equal to the flux in the g band at every epoch. The NIR was again extrapolated as a blackbody tail until 60 000 Å. This bolometric light curve peaks at ∼2.45 × 1043 erg s−1, a factor of 2.4 higher than the lower limit. We use this pseudobolometric light curve in the subsequent analysis.
Finally, we compared our adopted pseudobolometric light curve with one constructed using the Lyman et al. (2014, their Eq. 12 and Table 2) pseudobolometric corrections for SE-CCSNe. The bolometric light curve constructed for SN 2020aeuh using the Lyman-corrections for the g − r colour differs from our pseudobolometric light curve by only ∼0.04 dex.
3.5. 56Ni mass estimation
We can estimate the amount of 56Ni produced in SN 2020aeuh from its pseudobolometric light curve using the Arnett rule (Arnett 1982), which states that the peak bolometric luminosity equals the instantaneous total energy production rate from the radioactive decay of 56Ni, Lpeak = ϵ(tpeak). Nadyozhin (1994) calculated ϵ(t) to be
![Mathematical equation: $$ \begin{aligned} \epsilon (t) = \left[6.45\times 10^{43} e^{-t/\tau _{\rm Ni}} + 1.45\times 10^{43}e^{-t/\tau _{\rm Co}}\right]\frac{M_{\rm Ni}}{\mathrm{M_{\odot }}}\,\mathrm{erg\,s^{-1}}, \end{aligned} $$](/articles/aa/full_html/2025/12/aa56369-25/aa56369-25-eq5.gif) (1)
(1)
where τNi = 8.8 d and τNi = 111.3 d are the e-folding timescales for the 56Ni and 56Co decays. Using Lpeak ≈ 2.45 × 1043 erg s−1 and tpeak ≈ 12.5 days, we obtain MNi ≈ 0.86 M⊙. This is large for a normal SN Ia (e.g. Stritzinger et al. 2006; Bora et al. 2022), but is expected for a luminous SN 1991T-like object (Nugent et al. 1995; Hoeflich et al. 1996). There are also several caveats in this estimate, from the simple method of estimating the mass, the uncertainty of the bolometric light curve encapsulating all the flux, and any contribution from the circumstellar interaction to the first peak.
3.6. Host analysis
We retrieved science-ready co-added images of the host galaxy of SN 2020aeuh from the Sloan Digital Sky Survey DR 9 (SDSS; Ahn et al. 2012) and processed WISE images (Wright et al. 2010) from the unWISE archive (Lang 2014)6. The unWISE images are based on the public WISE data and include images from NEOWISE-Reactivation mission R-7 (Mainzer et al. 2014; Meisner et al. 2017). We used the software package LAMBDAR (Lambda Adaptive Multi-Band Deblending Algorithm in R) (Wright et al. 2016) and tools presented by Schulze et al. (2021) to measure the brightness of the host galaxy. The host is well detected in all bands. We measure a brightness of 18.01 ± 0.03 mag in the SDSS r band (corrected for MW reddening). The brightness in other filters is reported in Table A.3.
The SED was modelled with the software package Prospector7 version 0.3 (Johnson et al. 2021). We assumed a linear-exponential star-formation history, the Chabrier (2003) initial mass function, the Calzetti et al. (2000) attenuation model, and the Byler et al. (2017) model of the ionised gas contribution. The priors were set as described by Schulze et al. (2021). Based on these assumptions, we measure a k-corrected absolute magnitude of Mr = −20.94 ± 0.05 mag (not corrected for host reddening) and living-star mass of 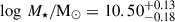 . The SED fit reveals no sign of recent star-formation activity. The formal 3σ limit is < 0.37 M⊙ yr−1. The absence of Hα emission in the Keck spectrum from +181 days allows us to tighten the limit further. We fitted a Gaussian line profile at the expected location of Hα and fixed its FWHM to the FWHM resolution of the LRIS 400/8500 grating for an
  -wide slit. This yields a flux limit 5.4 × 10⁻¹⁸ erg cm−2 s−1 at the 3σ confidence level. Using the Kennicutt (1998) relation between the Hα luminosity and star-formation rate (SFR) and the correction term from Madau & Dickinson (2014) to convert from a Salpeter to the Chabrier IMF, we infer an SFR limit of < 10−3 M⊙ yr−1.
Figure 7 shows the mass and SFR of SN 2020aeuh’s host and those of host galaxies of the SNe Ia-CSM from the ZTF (Kool et al. 2023; Sharma et al. 2023). The host of SN 2020aeuh is not only one of the more massive hosts, the absence of measurable star-formation activity is also uncommon for SN Ia-CSM host galaxies. This result also stands out considering that the Type Ia-CSM-He SN 2020eyjh occurred in a star-forming dwarf galaxy. This difference was seen in the comparison of the colours and masses of the hosts by Dimitriadis et al. (2025, their Fig. 10, lower left panel, in which SN 2020aeuh is the upper right orange triangle and SN 2020eyjh is the lower left triangle). The lack of measureable star-formation activity poses additional constraints on the progenitor channel for SN 2020aeuh.
 |
Fig. 7. Star-formation rate and stellar mass of the host galaxy of SN 2020aeuh in the context of host galaxies of SNe Ia-CSM from the ZTF. All hosts of SNe Ia-CSM are fairly typical of star-forming galaxies, as is demonstrated by their location with respect to the main sequence of star-forming galaxies (grey-shaded band, Elbaz et al. 2007). The host of SN 2020aeuh is an exception. It is among the more massive hosts, and the absence of measurable star-formation activity is uncommon of SN Ia-CSM host galaxies. |
4. Discussion
4.1. Late re-brightening
The existing sample of 28 SNe Ia-CSM (Sharma et al. 2023; Silverman et al. 2013a) all follow a similar photometric evolution that deviates significantly from the decline rates predicted for the radioactive decay of 56Ni (see Fig. 5 of Sharma et al. 2023). All these objects have a slow evolution, sometimes even reaching a prolonged plateau phase (e.g. SN 2020eyj).
SN 2020aeuh is the only Type Ia-CSM reported to exhibit a strong re-brightening. This unique characteristic is shown in Fig. 6, in which SN 2020aeuh is compared with the delayed SNe Ia-CSM PTF11kx and 2020eyj. All three objects deviate from the expected SN Ia decline rate after ∼25 d post peak, when the CSM interaction begins dominating the light curves. The CSM interaction is more pronounced in the g band (Fig. 6; upper panel), explaining the colour evolution towards the blue discussed in Sect. 3.3. The similarities between the other delayed SNe Ia-CSM and SN 2020aeuh end there, as the latter is clearly re-brightening once the CSM interaction begins to dominate the powering.
We can get an estimate of the radiated energy during the two phases where the different powering mechanisms dominate. Integrating the pseudobolometric light curve from first detection until ∼25 d post peak gives Erad, Ia ≈ 4.6 × 1049 erg for the radioactivity-dominated part of the evolution. When we integrate the second peak of the light curve (∼25 d post peak until the end of the evolution) we get Erad, CSM ≈ 1.1 × 1050 erg. Typically, the kinetic energy in SNe Ia is of the order of 1051 erg (Liu et al. 2023, and references therein), which means that during the late part of the evolution, the mechanism that powers the light curve (CSM interaction) is efficient at converting kinetic energy into radiated energy.
As was mentioned in Sect. 3.2, the first CSM-dominated spectrum was obtained at +81 days, only after it was realised that SN 2020aeuh was not a normal SN Ia. The difficulty of catching re-brightening objects was also highlighted for CCSNe by Sollerman et al. (2020), and SN 2020aeuh was in fact noted already in the compilation by Soraisam et al. (2022). Terwel et al. (2025) showed that we can discover SNe Ia-CSM emission by careful inspection and coaddition of late-time data. They explicitly note SN 2020aeuh as the only SN Ia-CSM in their sample with a re-brightening light curve. However, the need to react in real time to summon follow-up resources remains an issue for this kind of research. At the end of the day, the re-brightening of SN 2020aeuh was discovered semi-serendipitously.
4.2. Outside the optical regime
Ultraviolet (UV) signatures are expected during CSM interaction (e.g. Graham et al. 2019). SN 2020aeuh was imaged with the Hubble Space Telescope in the UV with WFC3/UVIS F275W, 480 days after peak brightness (59693 MJD), to search for late-time interaction. Such interaction would suggest the existence of additional CSM at even larger radii. The observations were carried out as part of a snapshot proposal (1200 s; GO-16657, P.I. C. Fremling), but no object was detected.
Mid-infrared (MIR) emission from the shock-heated dust (if present) has been interpreted as another proxy for CSM interaction. SN Ia-CSM 2018evt was detected in the MIR and proposed to show evidence of dust formation (Wang et al. 2024), and the compilation of Mo et al. (2025) showed that MIR detections by NEOWISE are not uncommon among the nearby SNe Ia-CSM. The image-subtraction pipeline, developed by De et al. (in prep.), did not yield a NEOWISE detection, neither during the period when SN 2020aeuh was optically visible, nor in the subsequent years after its optical fading.
Radio synchrotron emission arising at the shock front of ejecta-CSM interaction is another possible CSM-interaction signature. So far, the only SN Ia that has been detected at radio wavelengths is SN 2020eyj (Kool et al. 2023). Griffith et al. (2025) show that radio observations of a larger sample of SNe Ia-CSM did not yield additional detections. SN 2020aeuh was not included in the Griffith et al. (2025) sample owing to its large distance of almost 600 Mpc, and this is also what makes follow-up observations in other wavelength regimes insensitive for SN 2020aeuh.
4.3. Missing H and He, nomenclature
For stripped-envelope SNe, the sequence of stripping from SN Ib to SN Ic has an equivalence among the CSM-interacting transients. The interacting sub-classes of H-depleted SNe Ibn and He-depleted SNe Icn now have been proposed to be joined by the even more stripped Type Ien SN 2021yfj (Schulze et al. 2025).
Analogously, the family of SNe-Ia-CSM was augmented with the H-poor but He-rich SN 2020eyj (Kool et al. 2023), and in this paper by the H- and He-poor SN 2020aeuh. This could warrant a discussion of nomenclature along the lines of SNe Ia-CSM-II, b, c or SNe Ia-CSM-H, He, C/O. It is reminiscent of the discussion by Nomoto & Leung (2018), who introduced the putative SN Ia-He CSM class based on the potential He-star donor progenitor system. We discuss potential progenitor systems for SN 2020aeuh below (Sect. 4.6), but note here that given the complete lack of narrow H and He lines, the system could be considered the first SN Ia-CSM-C/O.
4.4. Spectral characteristics
There are several things to note when it comes to the late-time spectra of SN 2020aeuh. The pseudocontinuum is exceptionally smooth compared to the SN Ibn models of Dessart et al. (2022), in which the zigzag appearance of the iron forest reflects the low velocity of the cold dense shell (CDS). Furthermore, the Ca II NIR triplet in SN 2020aeuh is very broad, similar to other interacting SNe I (see Fig. 5). We note that the SN Ibn models by Dessart et al. (2022, see their footnote 2) were unable to reproduce this feature at all.
We estimated the offset between the bluest line of the Ca II NIR triplet (λrest = 8498 Å) and the wavelength at zero intensity of the feature (λZ.I. ≈ 8167 ± 25 Å) to be ∼11 689 ± 868 km s−1. This high velocity also matches the position of the Ca II H&K line, as is shown in Fig. 5.
Figure 5 shows a comparison of SN 2020aeuh during the interaction phase with other interacting Type I SNe. Regarding the Ca II NIR triplet, the comparison shows that SNe Ia-CSM have similarly large widths as seen for SN 2020aeuh, whereas the comparison Type Ibn and Icn SNe seem to have less broad triplets. When the broad Ca II doublet appears in SNe Ia-CSM (e.g. SNe 2020aekp and 2020eyj), the velocity offset is generally not as large as for the Ca NIR feature, contrary to the case for SN 2020aeuh. The O Iλ8446 could be present in those spectra and blended with the triplet, which would make the ∼12 000 km s−1 offset an overestimate.
The estimated high velocity for the calcium emission lines in SN 2020aeuh are more typical of ejecta than of a slower CDS, as envisioned in the models by Dessart et al. (2022) mentioned above. Velocities on that order also for the iron emission lines would explain the very smooth pseudocontinuum. The calcium lines must come from parts of the ejecta that are not swept up and decelerated by the reverse shock which forms during the interaction. One explanation that makes parts of the ejecta visible is the case of the photosphere receding deeper than the reverse shock. In that case, we can detect photons emitted at the outermost part of the freely expanding ejecta. This scenario would also explain the blueshift of the features, since the ejecta on the opposite side would be obscured. Dessart et al. (2016) explored this scenario in the context of Type IIn SNe, in which their ‘model A’ at late times has a flux contribution from the unshocked ejecta as the CDS gradually becomes less optically thick. Alternatively, geometrical effects and deviations from spherical symmetry can lead to the simultaneous viewing of the CDS and the ejecta.
Chugai et al. (2004) had to add a Ca-rich, optically thick zone in the shocked ejecta of their models of the Type Ia-CSM SN 2002ic, in order to reproduce the broad Ca NIR feature. In that scenario, the broadening of the calcium lines is an effect of the fragmented nature of the CDS due to Rayleigh-Taylor instabilities. They showed that the strength and width of these features require a large area ratio of the emitting region compared to the thin-shell approximation. This mechanism can also result in a slight blueshift if scattering in the ejecta is taken into account. Detailed spectral modelling is not the focus of the present investigation, where we instead attempt to understand the late-time light curve.
4.5. Light-curve modelling
The first peak of SN 2020aeuh is analogous to that of several well-studied SNe Ia (see the SNooPy fits with SN Ia templates in Sect. 3.3). As such, it can be explained as the typical light curve powered by radioactive decay of nickel, outlined in the classical models by Arnett (1982).
In order to understand the powering mechanism of the late-time re-brightening, we turn our attention to the interaction between ejecta and CSM. We first note that explaining the ∼50 d rise of the second peak simply by photon diffusion through optically thick CSM would imply a very high CSM mass; this is shown following Chevalier & Irwin (2011). Assuming steady, optically thick wind-like mass loss with ρ(r) = Dr−2, the time until breakout starts and the rise time are both given by the diffusion time,
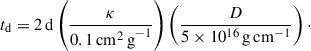 (2)
(2)
The fiducial value of κ = 0.1 cm2 g−1 (corresponding to the opacity of H-free ionised matter) gives D = 2.5 × 10¹⁸ g cm−1. Furthermore, since the shock-crossing time is RCSM/vsh ≈ td, the fiducial value of vsh = 104 km s−1 gives RCSM ≈ 4 × 1015 cm. Therefore, MCSM is estimated as MCSM = 4πDRCSM ≈ 70 M⊙. We consider this option to be unrealistic given that the CSM is also devoid of both H and He.
Recently, Moriya (2023) suggested that the long rise times often observed in SNe with CSM-interaction signatures could be attributed to the shock’s dynamical timescale instead of the diffusion timescale. In particular, they considered explosions in which the luminosity is dominated by the interaction of CSM having a power-law density structure (ρCSM ∝ r−s) and ejecta having a broken power-law density structure (ρej, inner ∝ r−δ and ρej, outer ∝ r−n). Such a configuration leads to an asymptotic formula for the luminosity evolution in the form of Equation (3), if one assumes that only the outer ejecta interact with the CSM and that a (constant) fraction of the kinetic energy is converted to radiation (see Moriya 2023, for a full derivation):
 (3)
(3)
Here, α = (6s − 15 + 2n − ns)/(n − s) and L1 is a constant depending on the parametrisation of the ejecta and CSM structures as well as the energy and mass in the explosion. Moriya (2023) noted that for flat CSM configurations (s < 1.5) and a range of fiducial values for n, α can take positive values. In such cases the luminosity would monotonically increase. Once the reverse shock enters the inner ejecta (which typically has a flatter density profile, e.g. Matzner & McKee 1999), α becomes negative and the luminosity declines. In this scenario, the rise time of the SN is dictated by the dynamical timescale of the shock. Chiba & Moriya (2024) generalised the formulation in Moriya (2023) by including the effects of the extent of the CSM and diffusion.
We used the Moriya (2023) prescription to fit the second peak of SN 2020aeuh, assuming the effect of diffusion to be negligible. The parameters of the models were constrained to be consistent with the fact that here we are dealing with the explosion of a white dwarf (the model has previously mostly been used for Type IIn SNe). The parameters used for the theoretical light curve are as follows (see Moriya 2023, for definitions and details of the models): ejecta density structure with n = 10 and δ = 0, Ekin = 1051 erg, Mej = 1.3 M⊙, and kinetic energy conversion efficiency ϵ = 0.3 (e.g. Fransson et al. 2014). Given that the model assumes the interaction to dominate the luminosity, we initialised this powering mechanism at 30 d (Sect. 4.1). This implies an evacuated region between the progenitor’s surface and the CSM. With an ejecta velocity of 12 000 km s−1, this gives RCSM, inner = 3.1 × 1015 cm. Similarly, assuming that the interaction ended 175−200 d after the explosion, based on the light-curve timescale, we have RCSM, outer = (9 − 10)×1015 cm.
We allowed the mass of the CSM, (MCSM) and the index of the CSM’s density structure (s) to be the free parameters. We numerically solved the momentum equation to compute the light curve (see Moriya 2023, for details) for each combination of the free parameters. The procedure was repeated for both RCSM, outer = 9 × 1015 cm and RCSM, outer = 1 × 1016 cm.
The best χ2 light-curve fit is shown in Fig. 8 (upper panel). Since the shape of the light curve is determined solely by the density profile, the choice of RCSM, outer is not affecting the light curve morphology. The inferred values are MCSM = 1.20 M⊙ for RCSM, outer = 9 × 1015 cm (MCSM = 1.86 M⊙ for RCSM, outer = 1 × 1016 cm). The inferred value of the CSM density slope is s = −1.02, regardless of the choice for RCSM, outer. The total optical depth of CSM τCSM when assuming κ = 0.1 cm2 g−1 is τCSM = 0.42 (0.53), consistent with the assumption of neglecting the effect of diffusion. The lower panel of Fig. 8 shows the corresponding 1−3σ confidence intervals.
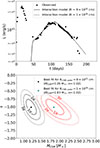 |
Fig. 8. Best-fitted second peak of SN 2020aeuh (upper panel) with RCSM, inner = 3.1 × 1015 cm, RCSM, outer = 9 × 1015 cm (solid), and RCSM, outer = 1 × 1016 cm (dashed). The choice of RCSM, outer is irrelevant to the shape of the light curve. The lower panel shows the confidence intervals that the χ2 fit yields for RCSM, outer = 9 × 1015 cm (black) and RCSM, outer = 1 × 1016 cm (red). |
It is possible that the interaction began earlier but had a negligible contribution to the light curve. We repeated the modelling, initialising the interaction at 10 d. With this assumption, the interaction terminating at t ≈ 175 (−200) d now corresponds to larger values of RCSM, outer = 10 (−11)×1015 cm. The obtained best-fit parameters for each value of RCSM, outer were MCSM = 1.38 (2.31) M⊙, with s = −2.23 in both cases. In other words, if earlier onset of interaction is assumed, the requirement for larger RCSM, outer and steeper s requires slightly larger values of MCSM.
We see that at least qualitatively this interaction model can explain the timescale and luminosity of the second peak, even if no fine tuning has been done to fit the details. The amount of mass in the CSM to sustain this prolonged interaction is relatively modest at ∼1 − 2 M⊙. An important assumption in this model is spherical symmetry, which could be inaccurate in the case of SN 2020aeuh. If the CSM is asymmetrically distributed (e.g. confined in a disc), then we can expect a lower MCSM. The unusual and conspicuous feature of this interpretation is the negative slope of the required CSM density structure. For a canonical value of the ejecta slope (n = 10), a steep enough rise to reproduce the luminosity evolution of the second peak requires a density that increases outwards. We discuss these implications below.
4.6. Progenitor scenarios
A key question for this system is what kind of information we can deduce for the progenitor given the long-lasting debate on the origin of Type Ia SNe, and in particular the nature of the binary system. There is a very extensive literature on this subject; here we briefly refer to Liu et al. (2023) and Ruiter & Seitenzahl (2025) for recent reviews. The two suggested scenarios are a single-degenerate system (SD) in which the exploding white dwarf (WD) accretes matter from a non-degenerate star through Roche-lobe overflow, or a double-degenerate (DD) scenario in which two WDs merge to trigger the thermonuclear explosion. We briefly discuss both of these below.
4.6.1. Single degenerate
Perhaps the most natural suggestion for a SN Ia progenitor system is accretion from a normal star onto the WD (Nomoto & Leung 2018). A long-standing issue with this proposal is the lack of detections of interaction signatures anticipated for such systems. As the SN Ia explosion interacts with the CSM from the companion wind, the expected signatures in the early-time light curve (Hayden et al. 2010), late-time spectra (Lundqvist et al. 2015), or at radio wavelengths (Chomiuk et al. 2016) have not been seen. As such, SNe Ia-CSM as a group is perhaps the best observational evidence that this channel exists (Silverman et al. 2013a; Sharma et al. 2023), since the interpretation has generally been that the H-rich CSM must come from the wind of the donor star. The radio detection of SN 2020eyj (Kool et al. 2023) is the best evidence to date of a non-degenerate He-star donor to a SN Ia. The clear spectroscopic He signatures in conjunction with the late-time CSM-driven light curve and the radio detection all point to significant amounts of helium-rich CSM as envisioned in such a single-degenerate system (Nomoto & Leung 2018).
The dramatic CSM-driven re-brightening of SN 2020aeuh could perhaps also be explained in such a scenario. However, the significant difference is the complete lack of H and He, with the implications that the CSM must come from a completely stripped progenitor, reminiscent of the WR stars suggested as progenitors for CC SNe Ic or Icn. To the best of our knowledge, no such suggested system exists in the literature for a SN Ia progenitor. The other unusual aspect for SN 2020aeuh is the fact that our modelling implies a density structure of the CSM that is not expected for a steady wind from any companion. To obtain a CSM that has an increasing density structure out to some radius requires a mass-loss mechanism that was more efficient in the past. To create the required CSM would requires a mass-loss rate that effectively decreased by a factor of 1000 over the few years prior to the explosion, when the CSM was produced. This calls for a more eruptive outflow, which also echoes the need for an earlier non-standard mass-loss mechanism to generate the H- and He-free progenitor in the first place.
An alternative scenario invokes inspiralling of the companion WD inside the envelope of an asymptotic giant branch (AGB) star, during a common-envelope (CE) phase (Paczynski 1976). Kashi & Soker (2011) suggested that some amount of the CE will not be ejected and fall back. The bound material will interact with the core-WD binary, and reduce its orbital separation on shorter timescales than the dynamical post-CE phase. This can lead to a merger and a SN Ia during the planetary-nebula phase, a progenitor system coined core-degenerate (CD; Kashi & Soker 2011). If the WD penetrates deep within the carbon layer and ejects it, it might explain the uncommon composition of the CSM of SN 2020aeuh. Still, the absence of H and He signatures would require an extensive stripping of the outer layers prior to the CE phase.
Regardless of the mechanism that leads to a thermonuclear explosion, the amount of MCSM points to a heavy non-degenerate companion. A star on the heavier end of intermediate-mass stars must have formed recently. The upper limit on the SFR estimated for the host (Sect. 3.6) seems to disfavour recent star formation. However the large distance to the host prevents more precise estimates of the SFR at the location of the explosion.
4.6.2. Double degenerate
Whereas strong CSM interaction would typically be interpreted as evidence of a non-degenerate binary, there are reasons to also mention the DD scenario for SN 2020aeuh. The CSM is apparently completely devoid of H and He, which is a highly unusual composition. The potential presence of C-O in the CSM makes the scenario of a companion WD an intriguing one. Moreover, the light-curve modelling (see Sect. 4.5) shows that the amount of material required could be less than the Chandrasekhar mass, MCh, which does not immediately rule out a DD scenario. However, a MCSM = 1.20 M⊙ scenario would basically require the complete disruption of a near-Chandrasekhar-mass companion WD prior to the explosion. The negative index density structure also points to a catastrophic mass-loss episode rather than a steady wind.
A C-O-rich CSM formed during the merger of two WDs has been invoked in the past to explain SN 2003fg-like SNe Ia (e.g. Dutta et al. 2022; Dimitriadis et al. 2022; Siebert et al. 2024). Those events, also coined super-Chandrasekhar, show absorption features of unburned carbon in their early spectra. Furthermore, some of the light curves show an early flux excess (Jiang et al. 2021; Dimitriadis et al. 2023; Srivastav et al. 2023), similar only to their related SN 2002es-like SNe (Hoogendam et al. 2024). While a C-O CSM could explain SN 2003fg-like events (e.g. Noebauer et al. 2016), neither the distance nor the amount of CSM is similar to that required for SN 2020aeuh.
A gravitational-wave-driven merger between two WDs is a relatively gentle process. During this inspiralling, the secondary WD might expel some material through tidal tail ejection Raskin & Kasen (2013). If the material is relatively nearby (≲1014 − 1016 cm), interaction with the ejecta could have observational signatures. The amount of CSM expected from such an interaction is hardly larger than 0.01 M⊙, which appears too low to explain the late-time light curve of SN 2020aeuh. Additionally, the unbound material in the tidal tail should have WD escape velocities which are ∼5000 km s−1 while the FWHM of the narrow lines in SN 2020aeuh is ≲1500 km s−1.
Dynamical encounters are more violent. These may occur in locations of large stellar densities such as globular clusters or galactic nuclei (see Lynden-Bell 1967; Meylan & Heggie 1997; Alexander 2005). Rosswog et al. (2009) explored the scenario of a near-central collision (Rperi ≲ (R1 + R2)/3) of two WDs that could occur in such an environment; here, R1 and R2 are the radii of the WDs and Rperi is the pericentre of the stellar centre of mass. They find that the light curves modelled from such collision-induced thermonuclear explosions can resemble observed SN Ia light curves.
However, encounters with larger initial pericentre distances are more common. If such a passage is close enough to raise tides on the stars, they become tidally spun up at the expense of orbital energy. With each passage the orbit becomes tighter, the stars spin up, and they eject increasingly larger amounts of mass. Eventually, the lighter star is disrupted and forms a disc – or, if the final impact is central enough, it triggers a version of the above described collision-induced thermonuclear explosion.
The secondary WD would provide (nearly exclusively) the amount of CSM required for SN 2020aeuh in such an encounter, so it would have to be above ∼0.5 M⊙. As an illustration of the overall dynamics of a parabolic fly-by, we show in Fig. 9 the grazing collision (Rperi = R1 + R2) of two CO-WDs with 0.5 and 0.8 M⊙ on an initially parabolic orbit. The simulation is performed with the MAGMA2 code (Rosswog 2020). In this illustrative example, the lighter WD suffers several close encounters, each time shedding a substantial amount of mass into space.
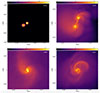 |
Fig. 9. Density maps of a sequence of fly-by encounters of a 0.5 M⊙ and a 0.8 M⊙ WD. The initial pericentre distance was Rperi = R1 + R2. The simulation was carried out with the MAGMA2 code (Rosswog 2020). |
Even in such encounters, it is hard to see how > 1 M⊙ can be produced or how the CSM would be detached from the progenitor to lead to a delayed SN Ia-CSM. However, this example serves as a proof of concept that such fly-bys can comfortably produce a CO-CSM of a few tenths of a solar mass. A more extensive exploration of the parameter space (masses, mass ratios, impact parameters) is outside the scope of this work.
5. Summary and conclusions
We have reported observations of SN 2020aeuh, which is a Type Ia-CSM with spectacular properties. After an initial phase where both the spectrum and the light curve reveal a thermonuclear SN Ia, the light curve re-brightens and a 100+ days long CSM-driven phase is entered. The two phases are well separated, providing evidence of a detatched dense shell of CSM surrounding the SN Ia explosion. Unlike any previous SN Ia-CSM, neither hydrogen nor helium features can be seen in the high-quality spectra of SN 2020aeuh during the interaction-dominated phase.
During the early phase of its evolution, SN 2020aeuh appeared as a slightly overluminous SN Ia (Sect. 3.3). Its photometric properties during the first peak placed it marginally within the width-luminosity relationship of normal SNe Ia (Phillips 1993), near the outlying subtypes of SN 2003fg-like, SN 1991T-like, and Ia-CSM SNe (see Fig. 1 of Taubenberger 2017). While its later evolution revealed it as a SN Ia-CSM, its classification spectrum is best matched to SN 1991T-like SNe. Furthermore, the H- and He-poor CSM is reminiscent of the postulated configuration for the progenitors of SN 2003fg-like SNe, albeit with vastly different properties (Sect. 4.6.2). SN 2020aeuh exploded in the outskirts of its host galaxy, similar to some SN 2003fg-like events (Khan et al. 2011). In contrast to other SNe Ia-CSM, the host of SN 2020aeuh is an early-type galaxy with a very low SFR (Sect. 3.6).
The re-brightening of SN 2020aeuh together with its spectral change uncovered its nature as a delayed SN Ia-CSM. Its unique late spectral appearance shows a few narrow lines, possibly of oxygen and carbon, and no evidence of hydrogen or helium. This makes SN 2020aeuh the first known Type Ia-CSM-C-O (Sect. 4.3). The estimated FWHM of the narrow lines is of the order of 103 km s−1 (Sect. 3.2), consistent with the narrow component of Hα in the Sharma et al. (2023) sample of SNe Ia-CSM. The nature of the broad calcium lines in the spectra of interacting SNe remains puzzling. Their estimated velocities in SN 2020aeuh are typical for fast-moving ejecta. Seeing the ejecta and the CDS simultaneously can be an effect of geometry or physical conditions of the CDS (Sect. 4.4).
To understand the powering mechanism responsible for the second peak, we fitted the pseudobolometric light curve with the CSM-interaction model from Moriya (2023). In this formalism, the timescale of the evolution is dictated by the dynamical timescale of the shock instead of diffusion. In the case of SN 2020aeuh, diffusion would require ∼70 M⊙ of CSM, which we regard as unfeasible for an H- and He-free composition. The best-fitted Moriya (2023) model instead yields MCSM ≈ 1 − 2 M⊙ (under a spherical symmetry assumption), with an unusual CSM structure with s ≲ −1 (Sect. 4.5). While such a density structure for the CSM is uncommon, the model follows adequately the light-curve morphology (Fig. 8). The amount of required CSM mass is in the regime in which neither the SD nor the DD progenitor scenario can be excluded.
SN 2020aeuh is a unique SN Ia-CSM that does not quite fit the picture of any suggested progenitor system for thermonuclear explosions (Sect. 4.6). The composition of the CSM could point towards a DD system, but the inferred masses call for a complete obliteration of a massive WD companion. Within the DD scenario, the case of multiple dynamical encounters can shed substantial amounts of material from the secondary WD (Sect. 4.6.2). However, both the MCSM we infer and the detached nature of the CSM are difficult to explain in this scenario. Perhaps a lower MCSM could be required in the case of asymmetric CSM. Additionally, the delay time between the stripping of the companion WD (either in the tidal-tail ejection or the fly-by encounter paradigms) and the explosion might account for the large radius of the CSM. Either way, a systematic study of the mechanisms that could produce some CSM in the DD scenario is still lacking. Regarding the SD (or CD) scenario, extensive stripping of the companion’s H and He layers is required, and detailed stellar-evolution scenarios leading up to such a configuration are hitherto missing (e.g. Liu et al. 2023). The remarkably low SFR of the host (Sect. 3.6) further weakens the non-degenerate cases. Altogether, the exotic appearance and properties of SN 2020aeuh pose crucial difficulties for the progenitor pathways of SNe Ia-CSM in particular and of SNe Ia in general.
Data Availability
All spectra are available at the WISeREP, via https://www.wiserep.org/object/17853. The entire photometry table (Table A.1) is available at the CDS via https://cdsarc.cds.unistra.fr/viz-bin/cat/J/A+A/704/A135.
Acknowledgments
We thank N. Sarin, A. Singh, S. Yang, B. van Baal, A. Gkini, S. Barmentloo, Y. Hu, and the Stockholm University Supernova Group for valuable feedback and discussions. This work has been enabled by support from the research project grant ‘Understanding the Dynamic Universe’ funded by the Knut and Alice Wallenberg under Dnr KAW 2018.0067. E.C.K. acknowledges support from the G.R.E.A.T. research environment funded by Vetenskapsrådet, the Swedish Research Council, under project 2016-06012, and support from The Wenner-Gren Foundations. S.R. has been supported by the Swedish Research Council (VR) under grant number 2020-05044 and by the research environment grant ‘Gravitational Radiation and Electromagnetic Astrophysical Transients’ (GREAT) funded by the Swedish Research Council (VR) under Dnr 2016-06012, by the Knut and Alice Wallenberg Foundation under grant Dnr. KAW 2019.0112, by Deutsche Forschungsgemeinschaft (DFG, German Research Foundation) under Gemany’s Excellence Strategy – EXC 2121 ‘Quantum Universe’ – 390833306 and by the European Research Council (ERC) Advanced Grant INSPIRATION under the European Union’s Horizon 2020 research and innovation programme (grant agreement No. 101053985). A.V.F.’s group at U.C. Berkeley received financial assistance from the Christopher R. Redlich Fund, as well as donations from Gary and Cynthia Bengier, Clark and Sharon Winslow, William Draper, Timothy and Melissa Draper, Briggs and Kathleen Wood, Sanford Robertson (T.G.B. is a Draper-Wood-Robertson Specialist in Astronomy, Y.Y. was a Bengier-Winslow-Robertson Fellow in Astronomy), and numerous other donors. Y.Y.’s research is partially supported by the Tsinghua University Dushi Program. Based in part on observations obtained with the 48-inch Samuel Oschin Telescope and the 60-inch Telescope at the Palomar Observatory as part of the Zwicky Transient Facility project. ZTF is supported by the U.S. National Science Foundation (NSF) under grant AST-2034437 and a collaboration including Caltech, IPAC, the Weizmann Institute for Science, the Oskar Klein Center at Stockholm University, the University of Maryland, Deutsches Elektronen-Synchrotron and Humboldt University, the TANGO Consortium of Taiwan, the University of Wisconsin at Milwaukee, Trinity College Dublin, Lawrence Livermore National Laboratories, and IN2P3, France. Operations are conducted by COO, IPAC, and UW. The SED Machine at Palomar Observatory is based upon work supported by the NSF under grant 1106171. We made use of the Fritz platform (van der Walt et al. 2019; Coughlin et al. 2023). The ZTF forced-photometry service was funded under the Heising-Simons Foundation grant #12540303 (PI M. Graham). This work is based in part on observations made with the Nordic Optical Telescope, operated by the Nordic Optical Telescope Scientific Association at the Observatorio del Roque de los Muchachos, La Palma, Spain, of the Instituto de Astrofisica de Canarias. The data presented here were obtained in part with ALFOSC, which is provided by the Instituto de Astrofisica de Andalucia (IAA-CSIC) under a joint agreement with the University of Copenhagen and NOTSA. Some of the data presented herein were obtained at the W. M. Keck Observatory, which is operated as a scientific partnership among the California Institute of Technology, the University of California, and NASA; the observatory was made possible by the generous financial support of the W. M. Keck Foundation. We thank WeiKang Zheng for assistance with the Keck observations. This work has made use of data from the Asteroid Terrestrial-impact Last Alert System (ATLAS) project. The Asteroid Terrestrial-impact Last Alert System (ATLAS) project is primarily funded to search for near-Earth objects through NASA grants NN12AR55G, 80NSSC18K0284, and 80NSSC18K1575; byproducts of the NEO search include images and catalogs from the survey area. This work was partially funded by Kepler/K2 grant J1944/80NSSC19K0112 and HST GO-15889, and STFC grants ST/T000198/1 and ST/S006109/1. The ATLAS science products have been made possible through the contributions of the University of Hawaii Institute for Astronomy, the Queen’s University Belfast, the Space Telescope Science Institute, the South African Astronomical Observatory, and The Millennium Institute of Astrophysics (MAS), Chile.
References
- Ahn, C. P., Alexandroff, R., Allende Prieto, C., et al. 2012, ApJS, 203, 21 [Google Scholar]
- Alexander, T. 2005, Phys. Rep., 419, 65 [CrossRef] [Google Scholar]
- Arnett, W. D. 1982, ApJ, 253, 785 [Google Scholar]
- Bellm, E. C., Kulkarni, S. R., Graham, M. J., et al. 2019, PASP, 131, 018002 [Google Scholar]
- Benetti, S., Cappellaro, E., Turatto, M., et al. 2006, ApJ, 653, L129 [NASA ADS] [CrossRef] [Google Scholar]
- Blagorodnova, N., Neill, J. D., Walters, R., et al. 2018, PASP, 130, 035003 [Google Scholar]
- Blondin, S., & Tonry, J. L. 2007, ApJ, 666, 1024 [NASA ADS] [CrossRef] [Google Scholar]
- Blondin, S., Matheson, T., Kirshner, R. P., et al. 2012, AJ, 143, 126 [NASA ADS] [CrossRef] [Google Scholar]
- Bora, Z., Vinkó, J., & Könyves-Tóth, R. 2022, PASP, 134, 054201 [NASA ADS] [CrossRef] [Google Scholar]
- Burns, C. R., Stritzinger, M., Phillips, M. M., et al. 2011, AJ, 141, 19 [Google Scholar]
- Byler, N., Dalcanton, J. J., Conroy, C., & Johnson, B. D. 2017, ApJ, 840, 44 [Google Scholar]
- Calzetti, D., Armus, L., Bohlin, R. C., et al. 2000, ApJ, 533, 682 [NASA ADS] [CrossRef] [Google Scholar]
- Cardelli, J. A., Clayton, G. C., & Mathis, J. S. 1989, ApJ, 345, 245 [Google Scholar]
- Chabrier, G. 2003, PASP, 115, 763 [Google Scholar]
- Chambers, K. C., Magnier, E. A., Metcalfe, N., et al. 2016, ArXiv e-prints [arXiv:1612.05560] [Google Scholar]
- Chevalier, R. A., & Irwin, C. M. 2011, ApJ, 729, L6 [Google Scholar]
- Chiba, R., & Moriya, T. J. 2024, ApJ, 973, 14 [Google Scholar]
- Chomiuk, L., Soderberg, A. M., Chevalier, R. A., et al. 2016, ApJ, 821, 119 [NASA ADS] [CrossRef] [Google Scholar]
- Chugai, N. N. 2009, MNRAS, 400, 866 [CrossRef] [Google Scholar]
- Chugai, N. N., Chevalier, R. A., & Lundqvist, P. 2004, MNRAS, 355, 627 [CrossRef] [Google Scholar]
- Coughlin, M. W., Bloom, J. S., Nir, G., et al. 2023, ApJS, 267, 31 [NASA ADS] [CrossRef] [Google Scholar]
- Davis, K. W., Taggart, K., Tinyanont, S., et al. 2023, MNRAS, 523, 2530 [NASA ADS] [CrossRef] [Google Scholar]
- Dekany, R., Smith, R. M., Riddle, R., et al. 2020, PASP, 132, 038001 [NASA ADS] [CrossRef] [Google Scholar]
- Dessart, L., Hillier, D. J., Audit, E., Livne, E., & Waldman, R. 2016, MNRAS, 458, 2094 [Google Scholar]
- Dessart, L., Hillier, D. J., & Kuncarayakti, H. 2022, A&A, 658, A130 [NASA ADS] [CrossRef] [EDP Sciences] [Google Scholar]
- Dilday, B., Howell, D. A., Cenko, S. B., et al. 2012, Science, 337, 942 [NASA ADS] [CrossRef] [Google Scholar]
- Dimitriadis, G., Foley, R. J., Arendse, N., et al. 2022, ApJ, 927, 78 [NASA ADS] [CrossRef] [Google Scholar]
- Dimitriadis, G., Maguire, K., Karambelkar, V. R., et al. 2023, MNRAS, 521, 1162 [NASA ADS] [CrossRef] [Google Scholar]
- Dimitriadis, G., Burgaz, U., Deckers, M., et al. 2025, A&A, 694, A10 [NASA ADS] [CrossRef] [EDP Sciences] [Google Scholar]
- Djupvik, A. A., & Andersen, J. 2010, Astrophys. Space Sci. Proc., 14, 211 [NASA ADS] [CrossRef] [Google Scholar]
- Dutta, A., Anupama, G. C., Chakradhari, N. K., & Sahu, D. K. 2022, ApJ, 938, L22 [Google Scholar]
- Elbaz, D., Daddi, E., Le Borgne, D., et al. 2007, A&A, 468, 33 [NASA ADS] [CrossRef] [EDP Sciences] [Google Scholar]
- Filippenko, A. V., Richmond, M. W., Matheson, T., et al. 1992, ApJ, 384, L15 [CrossRef] [Google Scholar]
- Foley, R. J., Smith, N., Ganeshalingam, M., et al. 2007, ApJ, 657, L105 [NASA ADS] [CrossRef] [Google Scholar]
- Fransson, C., Ergon, M., Challis, P. J., et al. 2014, ApJ, 797, 118 [Google Scholar]
- Fremling, C., Sollerman, J., Taddia, F., et al. 2016, A&A, 593, A68 [NASA ADS] [CrossRef] [EDP Sciences] [Google Scholar]
- Fremling, C., Miller, A. A., Sharma, Y., et al. 2020, ApJ, 895, 32 [NASA ADS] [CrossRef] [Google Scholar]
- Gal-Yam, A. 2017, in Observational and Physical Classification of Supernovae, eds. A. W. Alsabti, & P. Murdin, 195 [Google Scholar]
- Gal-Yam, A., Bruch, R., Schulze, S., et al. 2022, Nature, 601, 201 [NASA ADS] [CrossRef] [Google Scholar]
- Garavini, G., Folatelli, G., Goobar, A., et al. 2004, AJ, 128, 387 [NASA ADS] [CrossRef] [Google Scholar]
- Graham, M. L., Harris, C. E., Fox, O. D., et al. 2017, ApJ, 843, 102 [Google Scholar]
- Graham, M. L., Harris, C. E., Nugent, P. E., et al. 2019, ApJ, 871, 62 [NASA ADS] [CrossRef] [Google Scholar]
- Griffith, O., Showerman, G., Sarbadhicary, S. K., et al. 2025, ArXiv e-prints [arXiv:2506.19071] [Google Scholar]
- Hamuy, M., Phillips, M. M., Suntzeff, N. B., et al. 2003, Nature, 424, 651 [NASA ADS] [CrossRef] [Google Scholar]
- Hayden, B. T., Garnavich, P. M., Kessler, R., et al. 2010, ApJ, 712, 350 [Google Scholar]
- Hoeflich, P., Khokhlov, A., Wheeler, J. C., et al. 1996, ApJ, 472, L81 [NASA ADS] [CrossRef] [Google Scholar]
- Hoogendam, W. B., Shappee, B. J., Brown, P. J., et al. 2024, ApJ, 966, 139 [NASA ADS] [CrossRef] [Google Scholar]
- Hosseinzadeh, G., Arcavi, I., Valenti, S., et al. 2017, ApJ, 836, 158 [Google Scholar]
- Jiang, J.-A., Maeda, K., Kawabata, M., et al. 2021, ApJ, 923, L8 [NASA ADS] [CrossRef] [Google Scholar]
- Johnson, B. D., Leja, J., Conroy, C., & Speagle, J. S. 2021, ApJS, 254, 22 [NASA ADS] [CrossRef] [Google Scholar]
- Kashi, A., & Soker, N. 2011, MNRAS, 417, 1466 [NASA ADS] [CrossRef] [Google Scholar]
- Kennicutt, R. C. 1998, ARA&A, 36, 189 [NASA ADS] [CrossRef] [Google Scholar]
- Khan, R., Stanek, K. Z., Stoll, R., & Prieto, J. L. 2011, ApJ, 737, L24 [Google Scholar]
- Kool, E. C., Johansson, J., Sollerman, J., et al. 2023, Nature, 617, 477 [NASA ADS] [CrossRef] [Google Scholar]
- Lang, D. 2014, AJ, 147, 108 [Google Scholar]
- Leloudas, G., Hsiao, E. Y., Johansson, J., et al. 2015, A&A, 574, A61 [NASA ADS] [CrossRef] [EDP Sciences] [Google Scholar]
- Liu, Z.-W., Röpke, F. K., & Han, Z. 2023, RAA, 23, 082001 [NASA ADS] [Google Scholar]
- Lundqvist, P., Nyholm, A., Taddia, F., et al. 2015, A&A, 577, A39 [NASA ADS] [CrossRef] [EDP Sciences] [Google Scholar]
- Lyman, J. D., Bersier, D., & James, P. A. 2014, MNRAS, 437, 3848 [Google Scholar]
- Lynden-Bell, D. 1967, MNRAS, 136, 101 [Google Scholar]
- Madau, P., & Dickinson, M. 2014, ARA&A, 52, 415 [Google Scholar]
- Mainzer, A., Bauer, J., Cutri, R. M., et al. 2014, ApJ, 792, 30 [Google Scholar]
- Masci, F. J., Laher, R. R., Rusholme, B., et al. 2019, PASP, 131, 018003 [Google Scholar]
- Masci, F. J., Laher, R. R., Rusholme, B., et al. 2023, ArXiv e-prints [arXiv:2305.16279] [Google Scholar]
- Matzner, C. D., & McKee, C. F. 1999, ApJ, 510, 379 [Google Scholar]
- Meisner, A. M., Lang, D., & Schlegel, D. J. 2017, AJ, 153, 38 [Google Scholar]
- Meylan, G., & Heggie, D. C. 1997, A&ARv, 8, 1 [NASA ADS] [CrossRef] [Google Scholar]
- Miller, A. A., Yao, Y., Bulla, M., et al. 2020, ApJ, 902, 47 [NASA ADS] [CrossRef] [Google Scholar]
- Mo, G., De, K., Wiston, E., et al. 2025, ApJ, 980, L33 [Google Scholar]
- Modjaz, M., Blondin, S., Kirshner, R. P., et al. 2014, AJ, 147, 99 [Google Scholar]
- Moriya, T. J. 2023, MNRAS, 524, 5309 [Google Scholar]
- Nadyozhin, D. K. 1994, ApJS, 92, 527 [Google Scholar]
- Nicholl, M. 2018, Res. Notes AAS, 2, 230 [NASA ADS] [CrossRef] [Google Scholar]
- Noebauer, U. M., Taubenberger, S., Blinnikov, S., Sorokina, E., & Hillebrandt, W. 2016, MNRAS, 463, 2972 [NASA ADS] [CrossRef] [Google Scholar]
- Nomoto, K., & Leung, S.-C. 2018, Space Sci. Rev., 214, 67 [NASA ADS] [CrossRef] [Google Scholar]
- Nugent, P., Phillips, M., Baron, E., Branch, D., & Hauschildt, P. 1995, ApJ, 455, L147 [NASA ADS] [CrossRef] [Google Scholar]
- Nyholm, A., Sollerman, J., Tartaglia, L., et al. 2020, A&A, 637, A73 [NASA ADS] [CrossRef] [EDP Sciences] [Google Scholar]
- Oke, J. B., Cohen, J. G., Carr, M., et al. 1995, PASP, 107, 375 [Google Scholar]
- Paczynski, B. 1976, IAU Symp., 73, 75 [NASA ADS] [Google Scholar]
- Pastorello, A., Benetti, S., Brown, P. J., et al. 2015, MNRAS, 449, 1921 [Google Scholar]
- Perley, D. A. 2019, PASP, 131, 084503 [Google Scholar]
- Perley, D. A., Fremling, C., Sollerman, J., et al. 2020, ApJ, 904, 35 [NASA ADS] [CrossRef] [Google Scholar]
- Perley, D. A., Sollerman, J., Schulze, S., et al. 2022, ApJ, 927, 180 [NASA ADS] [CrossRef] [Google Scholar]
- Phillips, M. M. 1993, ApJ, 413, L105 [Google Scholar]
- Phillips, M. M., Ashall, C., Brown, P. J., et al. 2024, ApJS, 273, 16 [NASA ADS] [CrossRef] [Google Scholar]
- Prochaska, J., Hennawi, J., Westfall, K., et al. 2020, J. Open Source Softw., 5, 2308 [NASA ADS] [CrossRef] [Google Scholar]
- Raskin, C., & Kasen, D. 2013, ApJ, 772, 1 [NASA ADS] [CrossRef] [Google Scholar]
- Rigault, M., Neill, J. D., Blagorodnova, N., et al. 2019, A&A, 627, A115 [NASA ADS] [CrossRef] [EDP Sciences] [Google Scholar]
- Rigault, M., Smith, M., Goobar, A., et al. 2025, A&A, 694, A1 [NASA ADS] [CrossRef] [EDP Sciences] [Google Scholar]
- Rosswog, S. 2020, MNRAS, 498, 4230 [NASA ADS] [CrossRef] [Google Scholar]
- Rosswog, S., Kasen, D., Guillochon, J., & Ramirez-Ruiz, E. 2009, ApJ, 705, L128 [NASA ADS] [CrossRef] [Google Scholar]
- Ruiter, A. J., & Seitenzahl, I. R. 2025, A&ARv, 33, 1 [Google Scholar]
- Schlafly, E. F., & Finkbeiner, D. P. 2011, ApJ, 737, 103 [Google Scholar]
- Schlegel, E. M. 1990, MNRAS, 244, 269 [NASA ADS] [Google Scholar]
- Schulze, S., Yaron, O., Sollerman, J., et al. 2021, ApJS, 255, 29 [NASA ADS] [CrossRef] [Google Scholar]
- Schulze, S., Gal-Yam, A., Dessart, L., et al. 2025, Nature, 644, 634 [Google Scholar]
- Sharma, Y., Sollerman, J., Fremling, C., et al. 2023, ApJ, 948, 52 [NASA ADS] [CrossRef] [Google Scholar]
- Shen, K. J., Guillochon, J., & Foley, R. J. 2013, ApJ, 770, L35 [NASA ADS] [CrossRef] [Google Scholar]
- Shingles, L., Smith, K. W., Young, D. R., et al. 2021, Transient Name Server AstroNote, 7, 1 [NASA ADS] [Google Scholar]
- Siebert, M. R., Kwok, L. A., Johansson, J., et al. 2024, ApJ, 960, 88 [NASA ADS] [CrossRef] [Google Scholar]
- Silverman, J. M., Nugent, P. E., Gal-Yam, A., et al. 2013a, ApJS, 207, 3 [NASA ADS] [CrossRef] [Google Scholar]
- Silverman, J. M., Nugent, P. E., Gal-Yam, A., et al. 2013b, ApJ, 772, 125 [NASA ADS] [CrossRef] [Google Scholar]
- Smith, N. 2017, in Interacting Supernovae: Types IIn and Ibn, eds. A. W. Alsabti, & P. Murdin, 403 [Google Scholar]
- Smith, N., Mauerhan, J. C., Silverman, J. M., et al. 2012, MNRAS, 426, 1905 [NASA ADS] [CrossRef] [Google Scholar]
- Smith, K. W., Smartt, S. J., Young, D. R., et al. 2020, PASP, 132, 085002 [Google Scholar]
- Sollerman, J., Fransson, C., Barbarino, C., et al. 2020, A&A, 643, A79 [NASA ADS] [CrossRef] [EDP Sciences] [Google Scholar]
- Soraisam, M., Matheson, T., Lee, C.-H., et al. 2022, ApJ, 926, L11 [NASA ADS] [CrossRef] [Google Scholar]
- Srivastav, S., Smartt, S. J., Huber, M. E., et al. 2023, ApJ, 943, L20 [NASA ADS] [CrossRef] [Google Scholar]
- Stritzinger, M., Mazzali, P. A., Sollerman, J., & Benetti, S. 2006, A&A, 460, 793 [NASA ADS] [CrossRef] [EDP Sciences] [Google Scholar]
- Stritzinger, M., Taddia, F., Fransson, C., et al. 2012, ApJ, 756, 173 [NASA ADS] [CrossRef] [Google Scholar]
- Taubenberger, S. 2017, in Handbook of Supernovae, eds. A. W. Alsabti, & P. Murdin, 317 [Google Scholar]
- Terwel, J. H., Maguire, K., Dimitriadis, G., et al. 2025, A&A, 694, A11 [NASA ADS] [CrossRef] [EDP Sciences] [Google Scholar]
- Tonry, J. L., Denneau, L., Heinze, A. N., et al. 2018, PASP, 130, 064505 [Google Scholar]
- Tonry, J., Denneau, L., Heinze, A., et al. 2021, Transient Name Server Discovery Report, 2021-69, 1 [Google Scholar]
- van der Walt, S., Crellin-Quick, A., & Bloom, J. 2019, J. Open Source Softw., 4, 1247 [NASA ADS] [CrossRef] [Google Scholar]
- Wang, L., Hu, M., Wang, L., et al. 2024, Nat. Astron., 8, 504 [CrossRef] [Google Scholar]
- Weil, K. E., Subrayan, B. M., & Milisavljevic, D. 2021, Transient Name Server Classification Report, 2021-812, 1 [Google Scholar]
- Wood-Vasey, W. M., Wang, L., & Aldering, G. 2004, ApJ, 616, 339 [NASA ADS] [CrossRef] [Google Scholar]
- Woudt, P. A., Steeghs, D., Karovska, M., et al. 2009, ApJ, 706, 738 [Google Scholar]
- Wright, E. L., Eisenhardt, P. R. M., Mainzer, A. K., et al. 2010, AJ, 140, 1868 [Google Scholar]
- Wright, A. H., Robotham, A. S. G., Bourne, N., et al. 2016, MNRAS, 460, 765 [Google Scholar]
- Yaron, O., & Gal-Yam, A. 2012, PASP, 124, 668 [Google Scholar]
Appendix A: Photometry and spectroscopy
Optical photometry of SN 2020aeuh, in observed magnitudes. Phase is relative to ZTF first detection, in rest-frame days.
Log of spectroscopic observations of SN 2020aeuh.
Left: Host-galaxy photometry. Magnitudes in the AB system and not corrected for reddening. Right: Inferred host parameters from SED fitting with Prospector.
All Tables
Optical photometry of SN 2020aeuh, in observed magnitudes. Phase is relative to ZTF first detection, in rest-frame days.
Left: Host-galaxy photometry. Magnitudes in the AB system and not corrected for reddening. Right: Inferred host parameters from SED fitting with Prospector.
All Figures
|
Fig. 1. Field of SN 2020aeuh and its host galaxy. The colour image of the field is constructed from Pan-STARRS images in the gri bands (Chambers et al. 2016). The inset shows a negative image of the host galaxy, taken with P60 in the g-band filter at an epoch of 197.8 days. The position of SN 2020aeuh is indicated with red arrows. |
| In the text | |
|
Fig. 2. Light curves of SN 2020aeuh. They are corrected for MW extinction, with phases in rest-frame days since first detection. Early non-detections with 5σ upper limits are indicated by downward-facing empty triangles. Apparent magnitudes are provided on the left-hand axis and absolute magnitudes to the right. The photometry has been binned into one-night bins. The arrows on top indicate the epochs of spectroscopy. The lower panel shows the g − r colour evolution. |
| In the text | |
|
Fig. 3. Comparison of the classification spectrum of SN 2020aeuh (in black). A variety of SNe Ia from the literature is shown (see text for discussion and references). The locations of some common transitions are provided at the bottom. |
| In the text | |
|
Fig. 4. Spectral sequence of SN 2020aeuh at late phases. Our seven spectra between 81 and 181 days past first detection, when the SN is clearly dominated by CSM interaction, are displayed. The smoothed spectra (using a Savitzky–Golay filter) are shown in solid lines, while the original in semi-transparent. The spectral evolution is rather slow during these 100 days. The spectrum with best signal, at 99 days, is compared to spectra of other SNe in Fig. 5. |
| In the text | |
|
Fig. 5. Comparison of the spectrum of SN 2020aeuh at +99 days with a selection of other interacting Type I SNe. The shown Type Ia-CSM (in red) are SNe 2018evt, 2020aekp, 2020qxz (Sharma et al. 2023), and SN 2020eyj (Kool et al. 2023). Type Ibn (blue): SN 2006jc (Foley et al. 2007), SN 2019deh, and SN 2019iep. Type Ic (brown): SN 2019hgp (Gal-Yam et al. 2022) and SN 2021csp (Perley et al. 2022). All spectra have been shifted and multiplied by a numerical factor for visual purposes. Phases are relative to first detection. Dashed lines mark the calcium features. Solid lines indicate the calcium velocity offset estimated for SN 2020aeuh. |
| In the text | |
|
Fig. 6. g- (upper panel) and r-band (lower panel) light curves of the delayed SNe Ia-CSM PTF11kx (light blue), SN 2020eyj (dark blue), and SN 2020aeuh (black). The comparison light curves are corrected for the host-galaxy extinction inferred with SNooPy. The modelled light curves are overplotted. All three SNe evolve in a similar way up until ∼25 days after peak brightness, after which the light curves diverge, in particular in the g band. SN 2020aeuh shows a much more conspicuous late-time CSM interacting light curve that even increases in luminosity. |
| In the text | |
|
Fig. 7. Star-formation rate and stellar mass of the host galaxy of SN 2020aeuh in the context of host galaxies of SNe Ia-CSM from the ZTF. All hosts of SNe Ia-CSM are fairly typical of star-forming galaxies, as is demonstrated by their location with respect to the main sequence of star-forming galaxies (grey-shaded band, Elbaz et al. 2007). The host of SN 2020aeuh is an exception. It is among the more massive hosts, and the absence of measurable star-formation activity is uncommon of SN Ia-CSM host galaxies. |
| In the text | |
|
Fig. 8. Best-fitted second peak of SN 2020aeuh (upper panel) with RCSM, inner = 3.1 × 1015 cm, RCSM, outer = 9 × 1015 cm (solid), and RCSM, outer = 1 × 1016 cm (dashed). The choice of RCSM, outer is irrelevant to the shape of the light curve. The lower panel shows the confidence intervals that the χ2 fit yields for RCSM, outer = 9 × 1015 cm (black) and RCSM, outer = 1 × 1016 cm (red). |
| In the text | |
|
Fig. 9. Density maps of a sequence of fly-by encounters of a 0.5 M⊙ and a 0.8 M⊙ WD. The initial pericentre distance was Rperi = R1 + R2. The simulation was carried out with the MAGMA2 code (Rosswog 2020). |
| In the text | |
Current usage metrics show cumulative count of Article Views (full-text article views including HTML views, PDF and ePub downloads, according to the available data) and Abstracts Views on Vision4Press platform.
Data correspond to usage on the plateform after 2015. The current usage metrics is available 48-96 hours after online publication and is updated daily on week days.
Initial download of the metrics may take a while.