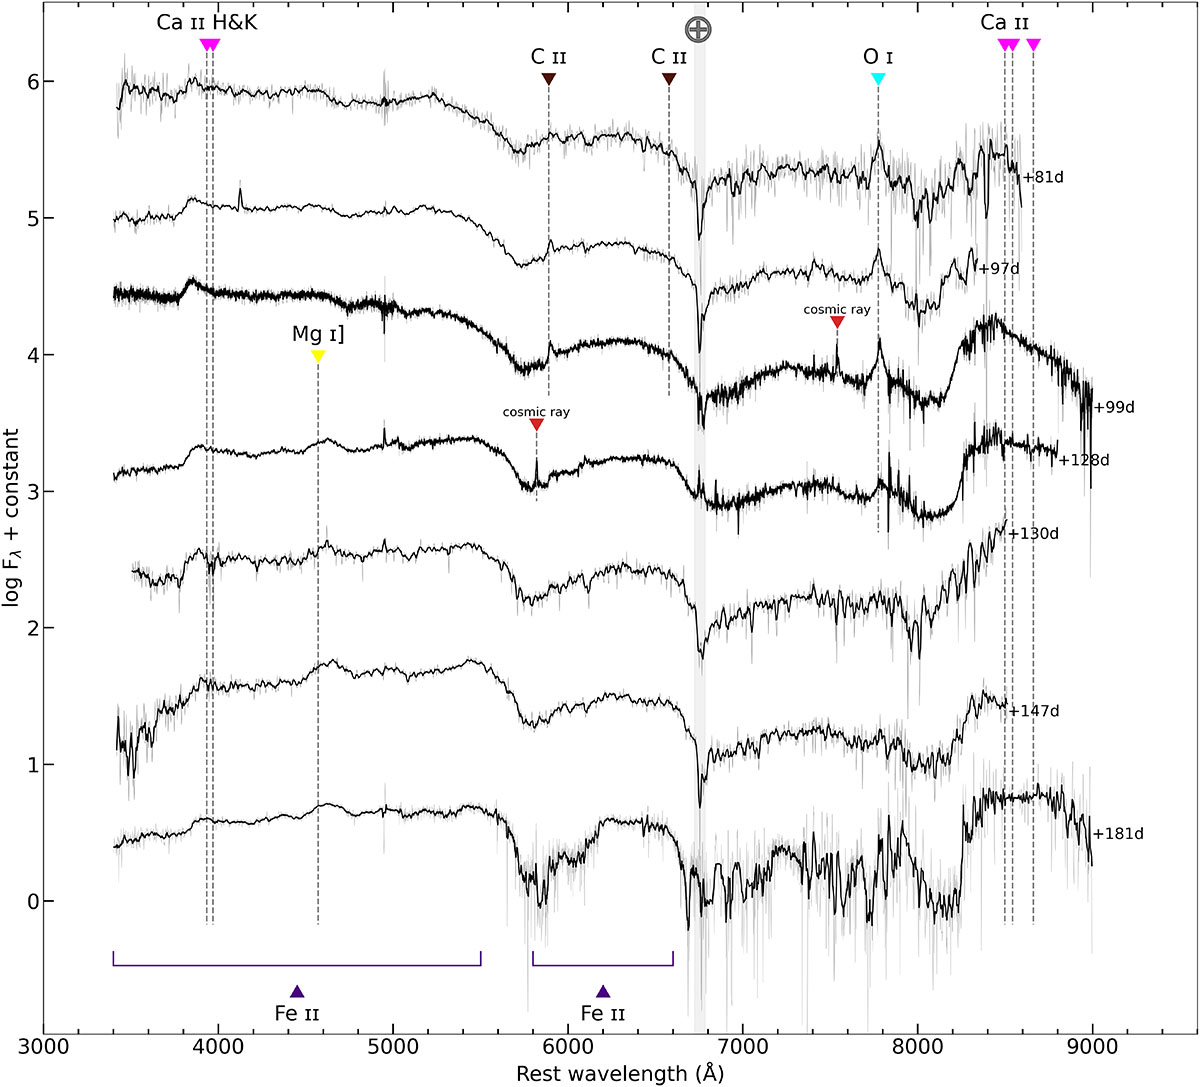
Fig. 4.
Download original image
Spectral sequence of SN 2020aeuh at late phases. Our seven spectra between 81 and 181 days past first detection, when the SN is clearly dominated by CSM interaction, are displayed. The smoothed spectra (using a Savitzky–Golay filter) are shown in solid lines, while the original in semi-transparent. The spectral evolution is rather slow during these 100 days. The spectrum with best signal, at 99 days, is compared to spectra of other SNe in Fig. 5.
Current usage metrics show cumulative count of Article Views (full-text article views including HTML views, PDF and ePub downloads, according to the available data) and Abstracts Views on Vision4Press platform.
Data correspond to usage on the plateform after 2015. The current usage metrics is available 48-96 hours after online publication and is updated daily on week days.
Initial download of the metrics may take a while.