Fig. 6.
Download original image
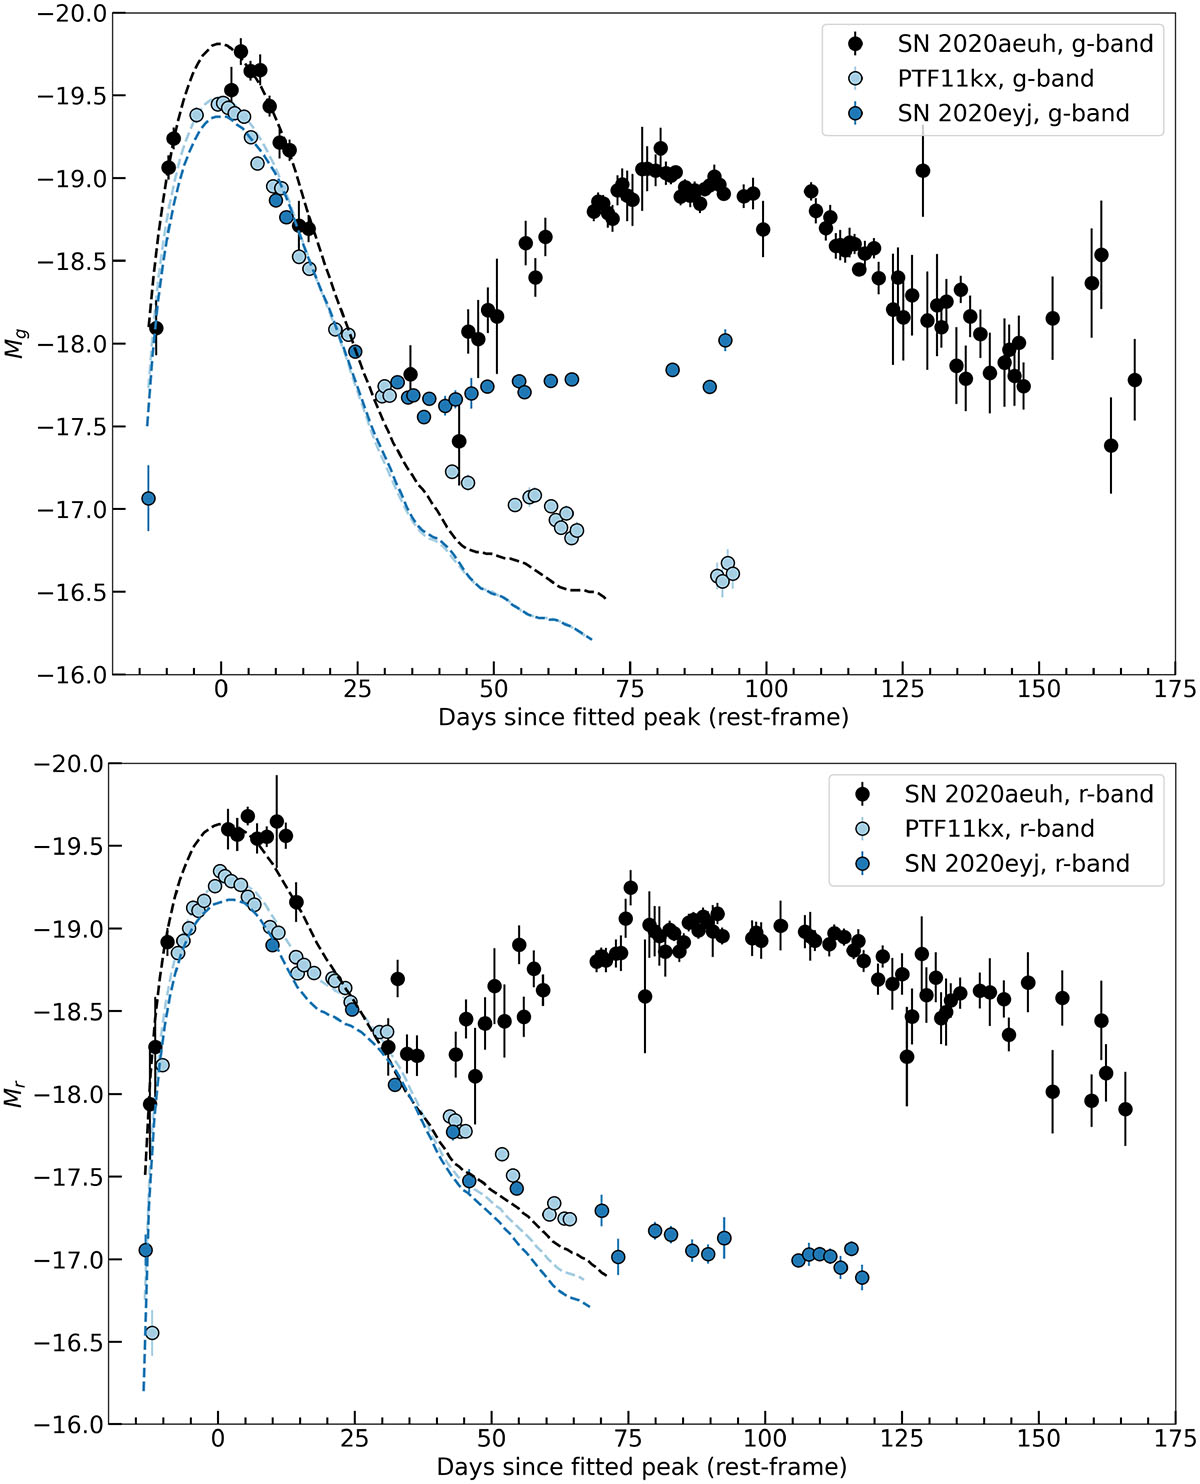
g- (upper panel) and r-band (lower panel) light curves of the delayed SNe Ia-CSM PTF11kx (light blue), SN 2020eyj (dark blue), and SN 2020aeuh (black). The comparison light curves are corrected for the host-galaxy extinction inferred with SNooPy. The modelled light curves are overplotted. All three SNe evolve in a similar way up until ∼25 days after peak brightness, after which the light curves diverge, in particular in the g band. SN 2020aeuh shows a much more conspicuous late-time CSM interacting light curve that even increases in luminosity.
Current usage metrics show cumulative count of Article Views (full-text article views including HTML views, PDF and ePub downloads, according to the available data) and Abstracts Views on Vision4Press platform.
Data correspond to usage on the plateform after 2015. The current usage metrics is available 48-96 hours after online publication and is updated daily on week days.
Initial download of the metrics may take a while.