Fig. 4
Download original image
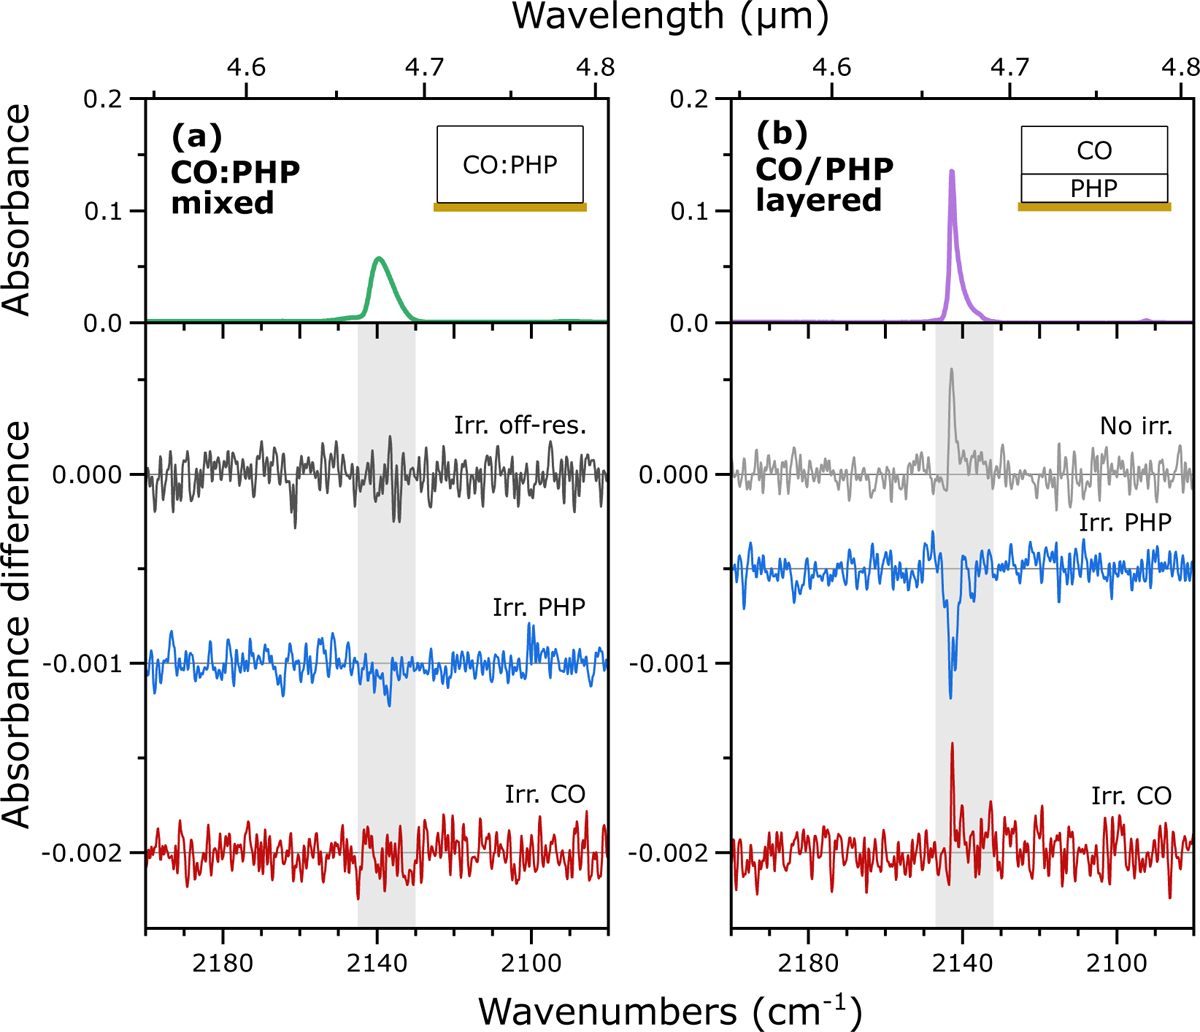
RAIR spectra (top) and difference spectra (bottom) for irradiation of the (a) CO:PHP mixed ice and (b) CO/PHP layered ice, focusing on the region around the CO stretching mode. The CO peak shape is different for the mixed and layered ices but represents the same total area and CO column density. The difference spectra represent the irradiations for which QMS data are shown in Figs. 2 and C.1, with the band irradiated denoted above each spectrum. The difference spectrum for a wait time of 1 min without irradiation for the layered ice (grey) indicates continuous CO deposition. Each difference spectrum has been baseline corrected by subtracting the mean value in the displayed range, excluding the shaded region around the CO band, and has been offset for clarity, represented by horizontal lines. The off-resonance irradiation energy was Eirr = 56 mJ.
Current usage metrics show cumulative count of Article Views (full-text article views including HTML views, PDF and ePub downloads, according to the available data) and Abstracts Views on Vision4Press platform.
Data correspond to usage on the plateform after 2015. The current usage metrics is available 48-96 hours after online publication and is updated daily on week days.
Initial download of the metrics may take a while.