Fig. 5.
Download original image
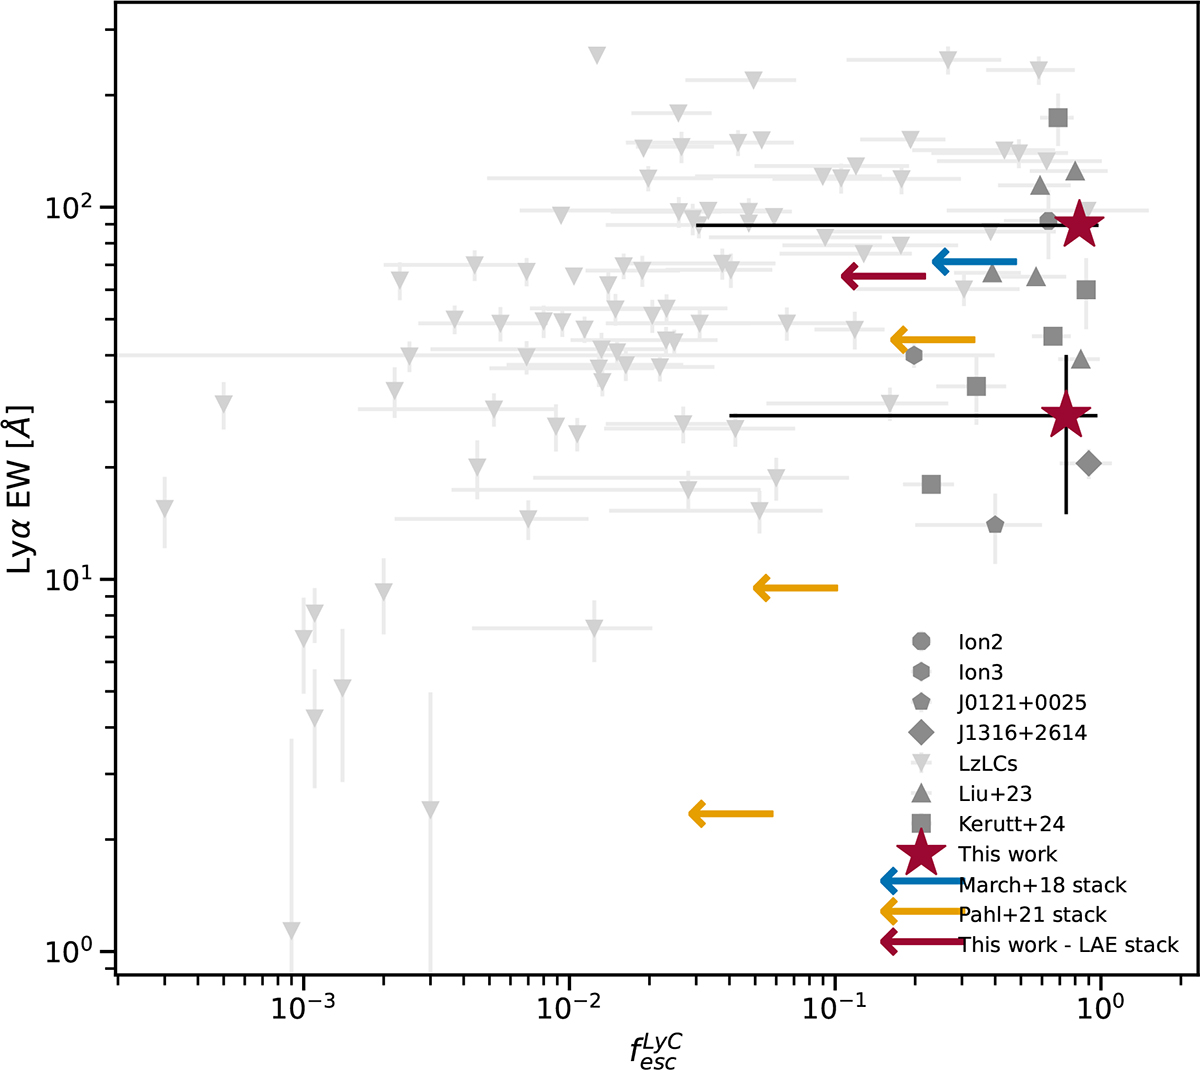
Lyα EW vs. fesc. The red stars represent the two candidate leakers in our sample. Additionally, we show the fesc limits/values for the stacks of all the LAEs. For comparison, known leakers with Lyα emission at z ∼ 0 (Flury et al. 2022a) are shown in light gray, while those at z > 2 (Vanzella et al. 2018, 2020; Marques-Chaves et al. 2021, 2022; Liu et al. 2023; Kerutt et al. 2024) are presented in dark gray. Two limits constrained by stacks are presented as blue and yellow arrows (Marchi et al. 2018; Pahl et al. 2021).
Current usage metrics show cumulative count of Article Views (full-text article views including HTML views, PDF and ePub downloads, according to the available data) and Abstracts Views on Vision4Press platform.
Data correspond to usage on the plateform after 2015. The current usage metrics is available 48-96 hours after online publication and is updated daily on week days.
Initial download of the metrics may take a while.