| Issue |
A&A
Volume 704, December 2025
|
|
|---|---|---|
| Article Number | A328 | |
| Number of page(s) | 12 | |
| Section | Extragalactic astronomy | |
| DOI | https://doi.org/10.1051/0004-6361/202556410 | |
| Published online | 18 December 2025 | |
A Lyman continuum analysis of ∼100 galaxies at zspec∼ 3 in the Abell 2744 cluster field
1
INAF – Osservatorio Astronomico di Roma, Via Frascati 33, 00078 Monteporzio Catone, Italy
2
Department of Astronomy, School of Physics, Peking University, Beijing 100871, China
3
Kavli Institute for Astronomy and Astrophysics, Peking University, Beijing 100871, China
4
Institute of Science and Technology Austria (ISTA), Am Campus 1, A-3400 Klosterneuburg, Austria
5
INAF – Osservatorio Astronomico di Padova, Vicolo Osservatorio 5, 35122 Padova, Italy
6
Center for Astrophysical Sciences, William H. Miller III Department of Physics and Astronomy, Johns Hopkins University, Baltimore, MD 21218, USA
7
School of Astronomy and Space Science, University of Chinese Academy of Sciences (UCAS), Beijing 100049, China
8
National Astronomical Observatories, Chinese Academy of Sciences, Beijing 100101, China
9
Institute for Frontiers in Astronomy and Astrophysics, Beijing Normal University, Beijing 102206, China
10
Dipartimento di Fisica, Università di Roma Sapienza, Città Universitaria di Roma – Sapienza, Piazzale Aldo Moro, 2, 00185 Roma, Italy
11
Department of Physics & Astronomy, University of California, Riverside, 900 University Avenue, Riverside, CA 92521, USA
12
IPAC, California Institute of Technology, 1200 E. California Blvd., Pasadena, CA 91125, USA
13
Space Telescope Science Institute, 3700 San Martin Drive, Baltimore, MD 21218, USA
14
University of Ljubljana, Faculty of Mathematics and Physics, Jadranska ulica 19, SI-1000 Ljubljana, Slovenia
15
Department of Physics and Astronomy, University of California Davis, 1 Shields Avenue, Davis, CA 95616, USA
16
INAF – Osservatorio di Astrofisica e Scienza dello Spazio di Bologna, Via Gobetti 93/3, I-40129 Bologna, Italy
17
Centre for Astrophysics and Supercomputing, Swinburne University of Technology, PO Box 218 Hawthorn, VIC 3122, Australia
18
School of Physics, The University of Melbourne, VIC 3010, Australia
19
Dipartimento di Fisica, Università degli Studi di Milano, Via Celoria 16, I-20133 Milano, Italy
★ Corresponding author: This email address is being protected from spambots. You need JavaScript enabled to view it.
Received:
15
July
2025
Accepted:
21
October
2025
Abstract
Identifying Lyman continuum (LyC) leakers at intermediate redshifts is crucial for understanding the properties of cosmic reionizers because the opacity of the intergalactic medium (IGM) prevents the direct detection of LyC emission from sources during the Epoch of Reionization (EoR). In this study, we confirm two new LyC candidate leakers at z ∼ 3 in the Abell 2744 cluster field, with absolute escape fractions (fesc) of 0.83−0.80+0.15 and 0.74−0.70+0.23, respectively. The LyC emission was detected using HST/WFC3/F275W and F336W imaging. These two candidate leakers appear to be faint (MUV = −17.61 ± 0.06 and −18.22 ± 0.10), exhibit blue UV continuum slopes (β = −2.43 ± 0.05 and −1.92 ± 0.09), have low masses (M★ ∼ 107.51 ± 0.03 and 107.17 ± 0.15 M⊙) and Lyα equivalent widths of 90 ± 3 Å and 28 ± 12 Å, respectively. These two LyC candidate leakers were detected in a catalog of 91 spectroscopically confirmed sources using public spectra from the JWST and/or MUSE. We also analyzed properties that were proposed as indirect indicators of LyC emission, such as Lyα, the O32 ratio, and M★. We created a galaxy subsample that was selected according to these properties, stacked the LyC observations of this subsample, and assessed the limits of the escape fractions in the stacks. We aim to enhance our understanding of LyC escape mechanisms and improve our predictions of the LyC fesc during the EoR by analyzing the individual candidates and the stacks in the context of the currently limited sample of known LyC leakers at z ∼ 3.
Key words: galaxies: evolution / galaxies: high-redshift / galaxies: star formation
© The Authors 2025
 Open Access article, published by EDP Sciences, under the terms of the Creative Commons Attribution License (https://creativecommons.org/licenses/by/4.0), which permits unrestricted use, distribution, and reproduction in any medium, provided the original work is properly cited.
This article is published in open access under the Subscribe to Open model. This email address is being protected from spambots. You need JavaScript enabled to view it. to support open access publication.
1. Introduction
The Epoch of Reionization (EoR) began as galaxies increased in number and UV brightness and emitted Lyman-continuum (LyC; λ < 912 Å) radiation that ionized the surrounding neutral intergalactic medium (IGM). The LyC photons produced by star-forming galaxies can account for the photon budget required to complete reionization only if a substantial fraction of them escapes from the interstellar and circumgalactic media (ISM and CGM) of the galaxies into the IGM. Recent surveys by the Hubble Space Telescope (HST) and the James Webb Space Telescope (JWST) have documented the density of star-forming galaxies in the EoR well. These studies suggested that star-forming galaxies and not Active Galactic Nuclei (AGNs) probably dominate the process of cosmic reionization by z ∼ 5 (e.g., Finkelstein et al. 2019; Dayal et al. 2020, 2025; Bosman et al. 2022; Jiang et al. 2025; Whitler et al. 2025), and this matches the Thomson optical depth of electron scattering that is observed in the cosmic microwave background (CMB, Planck Collaboration VI 2020).
At redshifts z ≥ 4.5, however, it is impossible to detect LyC photons escaping from galaxies because the IGM opacity is too high. The IGM absorption means that LyC leakage from galaxies at z ∼ 4 would only be detected with a likelihood of 20%, and this likelihood decreases and becomes zero at even higher redshifts (Inoue & Iwata 2008; Inoue et al. 2014).
Researchers have thus started to study lower-redshift LyC leakers and identify key ISM properties and physical conditions that facilitate LyC photon escape, and these objects can be thus considered as indirect tracers of LyC escape (e.g., Yamanaka et al. 2020; Izotov et al. 2018; Marchi et al. 2018; Verhamme et al. 2017). These properties can then also be identified in EoR galaxies to understand their role in cosmic reionization.
One of the most reliable indicators identified at z ≲ 4 is strong Lyα emission (e.g., Pahl et al. 2021; Gazagnes et al. 2020). Verhamme et al. (2017) proposed that a Lyα profile with a double peak and a narrow separation between the peaks might indicate significant LyC leakage because a smaller peak separation corresponds to a lower column density of neutral gas, which allows Lyα and LyC to escape (Rivera-Thorsen et al. 2019; Izotov et al. 2018; Vanzella et al. 2020; Verhamme et al. 2015; Henry et al. 2015). At z > 6.5, Lyα is attenuated by its resonant nature and the increasingly neutral IGM closer to the EoR, however (Pentericci et al. 2018; Mason et al. 2019; Jung et al. 2020; Ouchi et al. 2020; Bolan et al. 2022; Napolitano et al. 2024). This emission line can therefore not typically be employed to indicate LyC escape at this high redshift (e.g., Napolitano et al. 2024).
Another useful indicator is the [O III] λλ4959, 5007/ [O II] λ3727 (O32) line ratio. Nakajima & Ouchi (2014) first found evidence that high O32 values suggest partially incomplete H II regions that allow some LyC photons to escape (Jaskot & Oey 2013; Nakajima & Ouchi 2014; Marchi et al. 2018; Izotov et al. 2018). This correlation is characterized by significant scatter in low-redshift studies (e.g., Izotov et al. 2018; Nakajima et al. 2020; Flury et al. 2022a). In practice, while a high O32 flux ratio is necessary for a significant measurement of fesc, it is not sufficient by itself to identify a LyC leaker because factors such as viewing angles, metallicity, and ionization parameter variations may also play a role (e.g., Bassett et al. 2019; Katz et al. 2020). Beyond these strong-line diagnostics, recent low-redshift studies have explored weak [S II] emission, which emerged as a promising new indirect indicator of LyC escape (Wang et al. 2019, 2021; Roy et al. 2025).
Chisholm et al. (2022) recently proposed that the UV β slope serves as a reliable predictor of LyC fesc, with bluer β values generally linked to higher fesc. Choustikov et al. (2024) predicted a strong correlation between extremely blue β values (< − 2.5) and elevated specific star formation rates (sSFR), which indicates that the young stellar population with a steeper β slope dominates over older stars. While β is sensitive to dust, galaxies with very low E(B − V) values are also correlated well with fesc at lower and intermediate redshifts (Reddy et al. 2016; Saldana-Lopez et al. 2022). Based on these considerations, β is likely to be a useful indicator of fesc, although it is subject to significant scatter.
The Low redshift Lyman Continuum Survey (LzLCS+) analyzed the first statistical sample of 66 galaxies at z = 0.2 − 0.4 with either a detection or a very stringent limit on the LyC emission from HST-COS spectra (Flury et al. 2022a,b; Saldana-Lopez et al. 2022). Based on the complete spectroscopic and photometric information for all sources, the authors tested many promising indirect diagnostics to understand how they correlate with LyC emission. Using this large low-redshift sample, several authors (e.g., Chisholm et al. 2022; Mascia et al. 2023, 2024a; Lin et al. 2024; Jaskot et al. 2024a,b) derived multivariate predictions of LyC fesc based on a particular subset of indirect indicators, with the ultimate goal of applying these correlations to galaxies at z ≃ 6 − 8 to determine their contribution to reionization. The main limitation of this exercise is the assumption that the conditions that facilitate LyC escape at z ∼ 0.3 are the same as during the EoR, that is, 10 Gyr earlier. Moreover, the surveys often do not cover the same bands of the physical parameters as those of high-z galaxies.
It is therefore of paramount importance to first test the solidity of the indirect diagnostics in z ≃ 3 − 4 galaxies, where a direct detection of LyC is still possible because these galaxies are much closer in cosmic time to the EoR (just ∼1 Gyr) and because they are likely much better analogs of the cosmic reionizers. Currently, only a handful of galaxies with fesc ≥ 0.1 have been identified in this cosmic epoch (z ≃ 2 − 4; e.g., Ion2 in Vanzella et al. 2015, 2018, 2020; Fletcher et al. 2019; Ji et al. 2020; Marques-Chaves et al. 2022), and some of the studies constrained the limits from stacks (Grazian et al. 2016; Pahl et al. 2021; Mestric et al. 2021). Recent efforts have continued to expand this sample: Wang et al. (2025) identified five potential LyC leakers using WFC3/F275W imaging. Liu et al. (2023) added five individual LyC leakers with escape fractions ranging from 0.4 to 0.8. Jung et al. (2024) placed upper limits on the absolute escape fraction (fesc, abs) between 3% and 15% for galaxies at 1.3 ≤ z ≤ 3. Despite this progress, the number of confirmed leakers remains small, and crucially, we still lack comprehensive information on their indirect diagnostics. Apart from the Lyα emission, which is strongly linked to the LyC emission at z ≃ 3 as well (e.g., Izotov et al. 2017; Verhamme et al. 2017; Marchi et al. 2018; Roy et al. 2023), only a limited number of sources have a complete census of rest-frame optical diagnostics such as [O III], [O II], Hβ and MgII emission. Although the near-IR spectroscopy of the JWST has recently enabled access to these features for an increasing number of sources (Roy et al. 2023; Prieto-Lyon et al. 2023; Llerena et al. 2024), additional data are still required to establish robust correlations and to calibrate indirect diagnostics at higher redshifts where a direct LyC detection is not possible.
The aim of this work is to search for and study new intermediate-redshift LyC leakers in the Abell 2744 field, taking advantage of deep HST imaging obtained with the WFC3/UVIS F275W and F336W filters, which capture the redshifted LyC emission from galaxies at z ∼ 3, and of a very rich optical and near-IR spectroscopic dataset, ranging from ground-based Multi Unit Spectroscopic Explorer (MUSE) observations to JWST spectroscopy. This dataset obtained a wide range coverage of wavelengths and enabled us to investigate the correlation between multiple properties and LyC escape at intermediate redshifts.
The paper is organized as follows: In Sect. 2 we outline the sample selection process. Sect. 3 describes the NIRISS extraction of the sources, the measurement of key emission lines, and the direct calculation of fesc values. In Sect. 4 we present the main properties of the two candidate leakers and the upper limits for subsamples of the sources; Sect. 5 discusses the relation between the measured fesc and potential indirect indicators of LyC escape. Section 6 summarizes our key conclusions. Throughout this work, we assume a flat ΛCDM cosmology with H0 = 67.7 km s−1 Mpc−1 and Ωm = 0.307 (Planck Collaboration VI 2020) and the Chabrier (2003) initial mass function. All magnitudes are expressed in the AB system (Oke & Gunn 1983).
2. Observations and sample selection
The Hubble Frontier Field cluster Abell 2744 (hereafter A2744) is an ideal field for studying LyC emission. This is partly due to the lensing magnification of the cluster, which averages a factor of 3.5 at z = 3 (Prieto-Lyon et al. 2023; Bergamini et al. 2023a). This magnification enables the detection of fainter galaxies (MUV ≈ −18, Smail et al. 1997), which are considered analogs of cosmic reionizers.
The field was observed by the HST program 13389 (PI B. Siana), which provided WFC3/UVIS filter observations in the F336W and F275W bands (8 orbits each, Alavi et al. 2016). These filters cover LyC emission for galaxies at 3.06 ≲ z ≲ 4 and 2.4 ≲ z ≲ 3.05, respectively. Deep JWST near-IR spectra were obtained through the GLASS-JWST-ERS program (JWST-ERS-1324: PI T. Treu) using NIRISS and NIRSpec high-resolution observations (e.g., Boyett et al. 2022; Prieto-Lyon et al. 2023; Mascia et al. 2024b; Watson et al. 2025), the UNCOVER program (Bezanson et al. 2024; Price et al. 2025), and DDT NIRSpec prism observations (PID 2756, PI: W. Chen). Additionally, VLT-MUSE observations of the region provide UV rest-frame diagnostics at z ∼ 3, including data on the presence, strength, and shape of Lyα emission (Richard et al. 2021; Bergamini et al. 2023a). In Fig. 1 we present the footprints of the GLASS-JWST-ERS and DDT programs, along with the MUSE and WFC3/UVIS filter pointings.
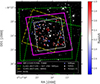 |
Fig. 1. LyC emitter candidates in the A2744 field, detected with NIRSpec (stars), NIRISS (squares), and MUSE (circles). The blue symbols represent galaxies detectable in WFC3/UVIS F275W at LyC wavelengths, and red indicates galaxies for which the LyC is redshifted to the WFC3/UVIS F336W bandpass. We also show the footprints of HST WFC3/UVIS F275W and F336W pointings, the GLASS-JWST-ERS and DDT 2756 observations, and VLT-MUSE observations (Richard et al. 2021) in the A2744 cluster field. They are superimposed on the JWST NIRCam F150W image from the UNCOVER program. |
In the following sections, we provide detailed descriptions of the available observational dataset.
2.1. HST and JWST imaging
We used images obtained with HST WFC3/UVIS F275W (2435–3032 Å) and F336W (3096–3639 Å) from the HST program PID13389 (PI: B. Siana), centered at RA = 3.5832679, Dec = − 30.3880082. The observations were carried out over a total of eight orbits per filter (Alavi et al. 2016). The Lyman limit for galaxies at z > 2.4 falls just above the red end of the F275W filter and above the F336W filter for those at z > 3.06. Thus, these two filters are ideally suited for observing LyC emission without contamination from nonionizing photons for galaxies in the ranges 2.4 ≤ z < 3.06 and 3.06 ≤ z ≤ 4, respectively. This setup allowed us to observe the LyC emission up to ∼29.6 and ∼30.2 AB magnitude (S/N ∼ 2) for the two filters, respectively.
In addition, this field also has multiple bands of observations from the HST archive, including HST F435W, F606W, F775W, F814W, F105W, F125W, F140W, and F160W filters (Merlin et al. 2016, 2024), and new JWST/NIRCam imaging in filters F115W, F150W, F200W, F277W, F356W, F410M, and F444W from GLASS-JWST (ERS 1324, PI: Treu, Treu et al. 2023), and UNCOVER (GO 2561, PI: Labbé, Bezanson et al. 2024; DDT 2756, PI: Chen; and GO 3990, PI: Morishita). These datasets enabled us to infer accurate physical properties of the galaxies (e.g., stellar mass, star formation rate (SFR), and β slope), and to derive quantities such as fesc. The analyses of this work are mainly based on these datasets. We used F606W in particular as the nonionizing band for a comparison to the ionizing flux. The images for the photometry were all PSF-matched to the F444W filter, except for the HST WFC3 bands, which have a broader FWHM. They were matched to F160W. The detailed photometry process can be found in Merlin et al. (2022), Paris et al. (2023), Merlin et al. (2024).
2.2. MUSE spectroscopic observations
Richard et al. (2021) presented integral-field spectroscopic observations of 12 massive clusters, conducted using the Multi Unit Spectroscopic Explorer (MUSE). Observations of the A2744 cluster were carried out as part of the MUSE Guaranteed Time Observations (GTO) survey under PIDs 094.A-0115, 095.A-0181, and 096.A-0496. These observations cover the wavelength range from 4750 to 9350 Å (as rest-frame UV for z ∼ 3), with a resolution varying from 2000 to 4000. The total exposure time for the A2744 cluster is 20 hours. The released data include a comprehensive redshift catalog of galaxies, confirmed by either emission lines, such as Lyα, or continuum features, spanning a wide redshift range from z = 0 to z = 6. Quality flags are also provided to assess the reliability of the redshift determinations.
2.3. JWST spectroscopic observations
The GLASS-JWST ERS program provided high-resolution NIRSpec spectra in grating mode with a resolution of approximately 2000–3000, covering a wavelength range from 1 to 5.14 μm. The total exposure time was 4.9 hours. Additionally, the JWST-DDT program (PID 2756, PI: W. Chen) obtained continuous wavelength coverage from 0.6 to 5.3 μm using the prism configuration, which has a resolution of approximately 30–300 (Jakobsen et al. 2022; Treu et al. 2023; Mascia et al. 2024b). The exposure time for the JWST-DDT observation was 1.23 hours. Together, these two programs yielded a total of approximately 200 unique sources with secure spectroscopic redshifts ranging from 0 to 10. Detailed information of the source selection, data reduction, and analysis can be found in Treu et al. (2023), Mascia et al. (2024b).
As part of the GLASS-JWST ERS program, additional observations were carried out using the JWST/NIRISS WFSS mode, which enables the detection of strong emission line galaxies within the field of view without the need for preselected targets. These observations provide low-resolution (R ∼ 150) spectra covering wavelengths from 1.0 to 2.2 μm, obtained using the F115W, F150W, and F200W blocking filters with a total integration time of 18 hours. The data reduction process is described in Treu et al. (2023). Boyett et al. (2022) presented an initial redshift catalog of 76 star-forming galaxies at 1 < z < 3.4, where the [O III] doublet is observable within the NIRISS wavelength range. This dataset also overlaps with the MUSE observations mentioned above. We further incorporated archival data from the UNCOVER survey (Bezanson et al. 2024; Price et al. 2025) to expand the sample of high-redshift sources with robust spectroscopic confirmations.
2.4. Sample selection
We assembled our sample by selecting sources in the redshift range of 2.4 ≤ zspec ≤ 4.0 from the combined MUSE, NIRSpec, and NIRISS spectroscopic catalogs, requiring overlap with the field of view of the HST UV observations. A total of 98 galaxies were identified. We selected 16 galaxies from the public GLASS-JWST, UNCOVER, and DDT NIRSpec observations (Treu et al. 2023), with some sources analyzed by Roy et al. (2023) and Prieto-Lyon et al. (2023), 8 galaxies in the same redshift range were identified from the NIRISS spectra (Boyett et al. 2022), and the remaining 74 galaxies were obtained from the compilation of redshifts by the VLT-MUSE instrument (Richard et al. 2021; Bergamini et al. 2023b). While all JWST-derived redshifts are assigned high-quality flags, we restricted the MUSE sample to galaxies with quality flags 2 or 3, corresponding to ‘solid’ or ‘secure’ sources.
Our final sample consisted of 91 sources with secure spectroscopically confirmed redshifts. Of these, 26 lie within the 2.4 ≤ zspec < 3.06 range (corresponding to LyC flux in the WFC3/UVIS F275W filter), while 65 fall within the 3.06 ≤ zspec ≤ 4.0 range (corresponding to LyC flux in the WFC3/UVIS F336W filter). The redshift distribution is shown in Fig. 2.
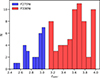 |
Fig. 2. Redshift distribution of the 91 spectroscopically confirmed sources in the A2744 field for which we searched for LyC emission. The blue distribution represents the sources where LyC is located in the UVIS/F275W filter, while the red distribution represents those that might be detectable in the F336W filter. |
3. Method
3.1. NIRISS spectral reextraction
To enable the measurement of rest-frame optical emission lines, we reextracted the NIRISS grism spectra for all galaxies in our spectroscopic sample. The footprints of MUSE and NIRISS are different (see Fig. 1), and this was therefore only possible for the 71 sources (out of a total of 91) within the NIRISS footprint.
The JWST-NIRISS spectra were reextracted following a similar method to that detailed in Roberts-Borsani et al. (2022) and Boyett et al. (2022). We summarize the differences below. We used the latest reference files (jwst_1123.pmap, which includes in-flight calibrations), and version 1.11 of the software Grism Redshift & Line (GRIZLI, Brammer 2019) to reduce and process the raw data. A flux-weighted stack was constructed from the direct NIRISS images at a 30 mas pixel scale, and it was used to generate a source segmentation map. For each detected source, GRIZLI was used to model the dispersion of a simple flat continuum in each of the three filters and two position angles, thereby generating a contamination model for the full  field of view. Because of the uncertainties associated with modeling the contamination of nearby sources, we assumed a factor of 0.2 for down-weighting contaminated pixels (see Roberts-Borsani et al. 2022, for further details).
To extract the galaxies, we modeled all 2D grism exposures for an individual source simultaneously, avoiding any additional uncertainties from stacking, such as cross-dispersion offsets, while maintaining the same signal-to-noise ratio (S/N). We created a set of templates using the flexible stellar population synthesis (FSPS) models of Conroy et al. (2018), including a dedicated set of individual emission line templates, allowing for varying line ratios. We also used the ancillary data provided by the dedicated imaging in this field to normalize the dispersed flux in each of the NIRISS filters and to constrain the overall shape of the continuum. For each galaxy, we therefore derived the best-fitting linear combination of templates that matched the observed data when dispersed onto the sky, through non-negative least squares. Because the spectral resolution of JWST-NIRISS is low (R ≈ 150), we allowed the redshift to vary by only 1% relative to the original zspec from the catalogs (see the previous section) to account for small errors in the wavelength calibration.
The 1D spectrum of each source was then optimally extracted following Horne (1986), using the position and morphology of the source in the direct image as a reference.
3.2. HST/UVIS photometry
We performed photometric measurements on the F275W and F336W images for sources at redshifts lower and higher than 3.06, respectively, centering on the positions retrieved from the redshift catalog for each object. The zeropoints were obtained from the HST WFC3/UVIS photometric documentation1. We smoothed the images to match the point-spread function (PSF) of F444W filter according to Paris et al. (2023). We applied a larger aperture size ( ) to measure the global flux for the LyC candidates, which allowed us to estimate the global escape fraction when the exact location of the LyC-leaking path was unclear (Grazian et al. 2016). The local background was subtracted for each source using a median background map constructed with PHOTUTILS.BACKGROUND2D. Then we selected sources with an S/N greater than 2 in our sample. To ensure a reliable S/N, we analyzed the noise level on a
  cutout image around each target by masking the central region and nearby bright sources, then randomly placed 300 apertures of the same size in the cut.
Subsequently, we visually inspected the thumbnails of these sources for any possible small offsets in the LyC images. Our focus was (fesc), which is a key parameter for assessing LyC leakage in early galaxies, and it was therefore also important to measure the nonionizing flux using the F606W filter for comparison. The F275W and F336W bands lack bright point sources, and we therefore used the enriched energy circle aperture correction for WFC32. For the F606W filter, we followed the method of Merlin et al. (2022). The final photometric results are listed in Table 1.
Photometric results and the physical properties parameters estimated by the best-fit SED model of the two candidates.
3.3. UV stacking
Since most of our objects showed no detection in the band probing the LyC, we performed stacks to impose more stringent constraints on the upper limit of the LyC escape fraction. The stacking procedure averages and smooths out the LyC emission from all individuals in each subgroup. To do this, we created  image stamps for each object in either the F275W or F336W bands, depending on the redshift of the source. The central positions were determined by the centers of the spectroscopic observations.
We separated the sources into several subgroups based on different criteria. Initially, we divided the sample into two groups simply according to their redshifts and availability of appropriate filter coverage for LyC detection. The objects with 2.4 < z ≤ 3.06 belong to the lower-redshift group, where LyC falls within the F275W filter, while the higher-redshift group (3.06 < z ≤ 4.0) would have LyC detected by the F336W filter. Additionally, we subdivided the sources based on other properties, such as the strength of Lyα emission and the O32 ratio. The details of these additional criteria are discussed in Sect. 5.
To create the stacks, we proceeded as follows: After adopting the local background correction on the cutout images, we summed the image stamps for all objects in each subgroup. The flux of each stack was then divided by the number of stamps in the subgroup to normalize it to the average flux level of an individual image. To reduce the impact of outliers, we applied a 3σ clipping to exclude the brightest and faintest pixels during the stacking process. We also tested the stacking process without clipping and found that the results did not change significantly, indicating that we did not miss any potential detections. These steps were performed for the F275W, F336W, and F606W bands.
We then measured the flux, analyzed the noise levels (see Sect. 3.2), and calculated the value at the 2σ dispersion level as the upper limit of the stacked images. The results are discussed in Sect. 4.3.
3.4. The escape fraction (fesc) measurement
To estimate the escape fraction, fesc, we calculated the ratio of the flux of nonionizing photons at wavelengths λ < 912 Å to the flux at λ = 1500 Å rest frame. The escape fraction is defined as
 (1)
(1)
where fLyC, obs/fUV, obs is the observed flux ratio of ionizing and nonionizing radiation, and LUV, intr/LLyC, intr is the intrinsic luminosity ratio. The parameter AUV represents the dust attenuation in the nonionizing continuum, calculated using the Calzetti et al. (2000) law, while τIGM is the IGM transmission, which is typically evaluated to be about 800–900 Å.
We employed two methods to estimate fesc. The first method assumes fixed values for the intrinsic luminosity ratio and dust attenuation across a sample of galaxies, while the observed flux ratio is directly calculated from photometric measurements in the appropriate filters for LyC and the nonionizing continuum. The intrinsic luminosity ratio, LUV, intr/LLyC, intr, is derived from standard stellar population models (Bruzual & Charlot 2003; Grazian et al. 2017; Rivera-Thorsen et al. 2022). Depending on different assumptions about burst ages, initial mass functions (IMF), and metallicities, this ratio generally ranges from 3 to 7 (e.g., Siana et al. 2007, 2010; Naidu et al. 2018; Rivera-Thorsen et al. 2022). In this first approach, we applied a fixed intrinsic ratio of LUV, intr/LLyC, intr = 3 and a dust attenuation value of AUV = 0.2, which are often considered valid for young low-mass galaxies (Steidel et al. 2001; Grazian et al. 2016; Marchi et al. 2018).
We used the model from Inoue et al. (2014) to calculate the IGM transmission (T = e−τIGM) at the wavelengths where LyC flux was detected for specific redshifts. The CGM absorption might be low because of a low density or potential gaps in the CGM when LyC escape occurs. We therefore treated the transmission as a combined effect of the IGM and CGM.
The second method estimates fesc by directly modeling the spectral energy distribution (SED) of each source, taking into account the observed LyC flux. This approach is described in detail in Sect. 4.2.
4. Results
4.1. Two new candidate LyC leakers
Out of 91 sources in the sample, the S/N is greater than 2 for only 2 sources in either of the UV bands: MUSE4010 at z = 2.999 in the F275W filter, and MUSE11806 at z = 3.236 in the F336W filter. We visually inspected the multiband HST and JWST images and cross-referenced the redshifts with MUSE observations to exclude lower-redshift interlopers. We also matched sources with S/N > 2 detected in F444W (Merlin et al. 2024), but found no contaminant within a radius of  , corresponding to our photometric aperture.
Both candidates show slight offsets between the center of the LyC and nonionizing radiation measuring  for MUSE4010 and
  for MUSE11806. Similar findings have been discussed in previous studies of low and high redshifts (e.g., Micheva et al. 2017; Liu et al. 2023; Komarova et al. 2024) and suggest that clumpy and asymmetric structures in the galaxies might facilitate LyC escape by creating channels or low-density regions (Heckman et al. 2011; Borthakur et al. 2014; Saldana-Lopez et al. 2022).
For MUSE4010, LyC is detected in the F275W filter, corresponding to a rest-frame wavelength of approximately 800 Å at its redshift. Using the IGM absorption model from Inoue et al. (2014), we averaged the transmission over the 800–900 Å rest-frame range and found the IGM transmission to be TIGM = 0.36 ± 0.3. Under the fixed assumption model, we estimated the escape fraction to be  , indicating a significant case of LyC leakage, similar to the cases reported in previous studies at z ∼ 3 (e.g., Vanzella et al. 2012; Saxena et al. 2024). The errors were propagated through standard linear propagation, assuming uncorrelated variables. The detection of LyC flux at high redshift might indicate low-density conditions or voids in the ISM that facilitate LyC escape. The IGM conditions at z ∼ 3 are highly stochastic, however, and vary depending on the line of sight. In the case of MUSE4010, it is possible that the galaxy encountered an exceptionally transparent pathway, thus significantly reducing the impact of IGM absorption.
MUSE11806 shows a more compact morphology. Its IGM transmission was calculated using the 880–910 Å rest-frame range, resulting in a transmission value of TIGM = 0.45 ± 0.33. This wavelength range selection accounts for the fact that the F336W filter used for MUSE11806 is located closer to the Lyman limit than the F275W filter employed for MUSE4010. The estimated escape fraction for this galaxy is  . It is worth noting that the intrinsic luminosity ratio can vary depending on the stellar population model used, typically falling below 7 for high-redshift star-forming galaxies (Vanzella et al. 2010). For example, when we assume an intrinsic luminosity ratio of L1500/L900 = 5, the escape fraction increases to fesc ∼ 1.
The results of our fesc measurements are summarized in Table 1. The uncertainties in fesc account for the photometric errors and variations in IGM absorption, while other parameters in Eq. (1) are adopted from models without additional error contributions (see Fig. 3).
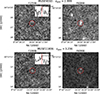 |
Fig. 3. Smoothed ionizing images (F275W or F336W) and nonionizing images (F606W) of the two LyC candidates. The red circles indicate the apertures with |

4.2. LyC fesc and physical properties from the SED fitting
To determine the physical properties of LyC candidate leakers and obtain a second estimate of their fesc, we employed SED modeling. We combined photometric data from various optical and near-infrared bands, including HST filters F435W, F444W, F606W, F775W, and F814W, along with the JWST filters F105W, F115W, F150W, F200W, F277W, F356W, and F410W.
For the SED fitting, we used the program Code Investigating GALaxy Emission (CIGALE; Boquien et al. 2019; Burgarella et al. 2005) with a double exponential star formation history. The dust attenuation law in CIGALE follows Calzetti et al. (2000), incorporating a power-law attenuation curve and a UV bump to modify the slope. We used the BC03 model (Bruzual & Charlot 2003), with the Salpeter IMF and setting the metallicity to a low value of Z = 0.004. Additionally, we included the IGM absorption model from Inoue et al. (2014), as described in Sect. 3.4. When integrating LyC observations into SED models, it is essential to consider that the distribution of neutral hydrogen and dust in the IGM and ISM is spatially complex and highly dependent on the line of sight. As a result, the sources from which we detected escaping LyC photons might reside in an overionized environment with higher IGM transmission (as discussed in Sect. 4.1). These conditions also increase the likelihood of a reduced dust density, facilitating the passage of LyC photons. In Fig. 4 we present the best-fit model spectra for the two LyC candidate leakers, while Table 1 lists their estimated physical properties. The SED analysis revealed that both LyC candidates are low-mass galaxies, with stellar masses (M★) below 108 M⊙, and their UV slope is relatively blue (β ∼ −2).
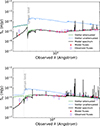 |
Fig. 4. SED fitting results of the two objects. The purple circles show the observed flux, and the red dots show the model fluxes. The black curve shows the best-fit spectrum. The unattenuated and attenuated stellar spectra are also shown with the solid green and dashed blue line, respectively. |
From the SED fitting, we derived alternative measurements of the escape fractions (fesc, SED) of 0.91 ± 0.04 for MUSE4010 and 0.67 ± 0.1 for MUSE11806, which are consistent with the fesc estimates derived using the general assumptions, as discussed in Sect. 3.4. It is important to mention that the SED fitting partially relies on the assumption of star formation history, dust extinction law, and other parameters, which may not fully describe the complexity of the galaxy. It can lead to uncertainties and limitations of the fesc estimation. For example, the average IGM model can underpredict the true transmission probability along the lines of sight with lower neutral hydrogen column densities; this effect might partially explain why the modeled LyC flux for the two sources is systematically lower than the observed value (see Table 2).
Photometric results and fesc upper limits of the stacks.
4.3. Constraint on the LyC emission from stacks
In addition to the two individual candidate LyC emitters (LCEs), the other sources in our sample show no significant signal (with S/N < 2) in the LyC bands. To better understand the ionizing contribution of the general galaxy population, we established a global estimate for fesc from the entire sample of undetected sources. We applied the stacking method (described in Sect. 3.3) to two subgroups: the lower-redshift sources (for which the LyC emission would fall in the F275W band) and the higher-redshift sources (for which the LyC emission would fall in the F336W band).
In the lower-redshift stack, we combined data from 26 galaxies, but found no significant flux in the stack, measuring a magnitude limit of 29.92 (S/N ∼ 2). For the higher-redshift subgroup, we stacked 65 galaxies, but still found no significant detection that would allow us to establish an even more constraining upper limit of 31.39 because of the larger sample size. The estimated 2σ upper limits of the escape fractions for the two subgroups are 0.06 and 0.04, respectively.
These results indicate that most of our galaxies exhibit significantly low fesc (< 0.1), which is consistent with previous findings. For instance, Steidel et al. (2018) reported an fesc lower than 0.09, derived from the composite spectra of a sample of star-forming galaxies observed through long-exposure spectroscopy with the Keck telescope. Wang et al. (2025) estimated fesc ∼ 0.03 as 2σ limit for sample of 28 galaxies in 2.5 ≤ z ≤ 3.0. Tight constrains on large samples were also derived by Grazian et al. (2017), who measured a stringent upper limit of < 0.02 for the relative escape fraction from bright galaxies (L > L*), while for the faint population (L = 0.2L*), the limit to the escape fraction is ≲0.1 (see also Boutsia et al. 2011). These findings suggest that star-forming galaxies have low escape fractions on average.
The tight constraints we obtained from stacks thus indicate that most of our galaxies have low fesc, with the detection of just two possible individual candidate LyC emitters with high fesc. This implies that only a small fraction of star-forming galaxies at most meet the conditions for a very high escape fraction. In previous works, a bimodal distribution of the fesc values has been suggested (Nakajima et al. 2020; Kreilgaard et al. 2024), that is, a (large) fraction of galaxies have a zero or a very low escape fraction, while a (small) fraction of galaxies have higher escape fractions. This might also correspond to line-of-sight effects: When the line of sight coincides with a low-density channel in the surrounding hydrogen, the galaxy is observed as a high LyC leaker, while in most cases, galaxies are observed through an unfavorable line of sight. In this sense, the bimodal distribution might be the result of an ionization-bounded scenario with a small number of highly ionized low-density channels through which the LyC photons can escape (Gazagnes et al. 2020). Alternatively, the same bimodality might be the result of variability in the LyC production and escape that is present in many simulations (Mauerhofer et al. 2021; Trebitsch et al. 2017). All the above issues highlight the complexity of LyC escape mechanisms and the potential impact of this small number of star-forming galaxies on cosmic reionization.
5. Discussion
To deepen our understanding of the conditions enabling LyC emission during the EoR, it is crucial to investigate the dependences of the LyC escape fraction on the other galaxy properties that might serve as indirect tracers.
Studies such as those by Flury et al. (2022b) have demonstrated the effectiveness of these indirect indicators at low redshift (z ∼ 0.3) for a galaxy sample of almost 100 sources. By examining similar correlations at z ∼ 3, we aim to understand if the well-tested diagnostics at low redshift are still valid also at cosmic noon. We remark that the validity of the same diagnostics at cosmic noon would endorse their suitability in the EoR as well. The primary obstacle arises from increased intergalactic medium (IGM) absorption at z ∼ 2 − 4, which complicates the interpretation of intermediate-strength leakers and limits detections to strong leakers (fesc ≥ 0.2).
The next sections explore the relations between fesc and promising indicators such as the Lyα emission, the O32 emission line ratio, and other physical properties of our galaxy sample.
5.1. Lyα emission and O32 ratio as predictors of high fesc
As mentioned in the introduction, among the best indirect indicators of LyC leakage, the Lyα recombination emission line stands out due to its high sensitivity to the environmental conditions of the ISM inside the galaxy along the line of sight.
Many models (Verhamme et al. 2015, 2017; Dijkstra et al. 2014) predict a tight connection between the escape of Lyα and LyC photons: For example, the characteristic Lyα asymmetric profile (e.g., double peak) is related to low optical depth regions in the ISM, which permit the escape of Lyα and LyC photons. Observations of Lyα emissions in some LyC emitters have indeed confirmed the presence of these double-peak profiles (or even triple peak) and demonstrated the connection with LyC leakage (Vanzella et al. 2018; Rivera-Thorsen et al. 2019). A broad relation between Lyα strength and LyC emission has also been observed by several authors using stacked spectroscopy (e.g., Pahl et al. 2021; Marchi et al. 2017). We note, however, that Citro et al. (2025) recently challenged previous studies based on local samples by suggesting that the LyC – Lyα relation might evolve with redshift.
In the majority of our sources (59 out of 91), including our two candidate leakers, Lyα is in emission according to the catalog of Richard et al. (2021), and 14 of them exhibit high EW (EW > 40 Å). We therefore analyzed the correlation between Lyα EW and the measured fesc values for the two candidate leakers in our sample and by producing stacks of strong LAE.
The two candidate leakers have Lyα EWs of 90 ± 3 Å and 28 ± 12 Å, respectively, and in particular, MUSE4010, which has the highest fesc, also has a very high Lyα EW, thus aligning with the tight link between the two quantities. We then produced a stack of the 13 remaining strong LAEs (i.e., without MUSE4010), having a median Lyα EW of 64 Å. The stack was performed in only one band because all these LAEs are at z ≥ 3.1 and their LyC emission would fall in the F336W filter. The stack showed no signal of LyC flux, and we place a 2σ upper limit on fesc < 0.16.
We compared these results with other known LyC leakers from z = 0 to z = 4 with measured Lyα EWs. Figure 5 illustrates the relation between Lyα EW and fesc for our two candidate leakers and our stack together with the results in the literature for individual detections (Vanzella et al. 2018, 2020; Marques-Chaves et al. 2021; Flury et al. 2022a; Liu et al. 2023; Kerutt et al. 2024). The EW and fesc derived for our two candidate leakers and for the stack of strong LAEs are similar to other confirmed LyC leakers at intermediate redshift. When we consider the median fesc of the LzLCS+ sources within our Lyα range (approximately between 40 and 250 Å), we would anticipate that our sources should have an average fesc ∼ 0.11. This is slightly below our measured limit of 0.15, meaning that we would need somewhat deeper UV data to detect the mean LyC emission.
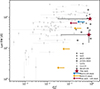 |
Fig. 5. Lyα EW vs. fesc. The red stars represent the two candidate leakers in our sample. Additionally, we show the fesc limits/values for the stacks of all the LAEs. For comparison, known leakers with Lyα emission at z ∼ 0 (Flury et al. 2022a) are shown in light gray, while those at z > 2 (Vanzella et al. 2018, 2020; Marques-Chaves et al. 2021, 2022; Liu et al. 2023; Kerutt et al. 2024) are presented in dark gray. Two limits constrained by stacks are presented as blue and yellow arrows (Marchi et al. 2018; Pahl et al. 2021). |
In general, we note that a high Lyα EW always corresponds to a moderate or high fesc; on the other hand, objects with low Lyα EW can exhibit a broad range of fesc properties.
Similarly to Lyα, the O32 emission line ratio has been extensively studied as an indicator of LyC fesc because it is associated with density-bounded HII regions in galaxies, which might facilitate LyC leakage (Izotov et al. 2018; Jaskot & Oey 2013; Nakajima & Ouchi 2014; Marchi et al. 2018; Rutkowski et al. 2017). For instance, Ion2 stands out as one of the strongest known high-redshift leakers with fesc > 0.5 and O32 > 10 (de Barros et al. 2016; Vanzella et al. 2016, 2020). A high O32 ratio appears to be a necessary but not sufficient condition for significant LyC radiation to escape the galaxy, however (Nakajima et al. 2020). Naidu et al. (2018) identified a sample of strong [O III] emitters with an average fesc < 0.1, highlighting uncertainties in using O32 as an indirect indicator. The uncertainty of O32 is primarily caused by its sensitivity to metallicity and ionization parameter (Sawant et al. 2021; Bassett et al. 2019; Katz et al. 2020). Flury et al. (2022a) proposed O32 ≥5 as a threshold to identify potential LyC leakers. Their findings included sources with high O32 ratios that only exhibit upper limits in fesc, suggesting once again that O32 alone probably does not reliably predict LyC escape because the escape conditions vary. This aligns with findings at z ∼ 3.5 by Naidu et al. (2018) that galaxies with high O32 do not always leak LyC photons. An evolutionary sequence of fesc is therefore suggested to meet the requirements that star-forming galaxies drive reionization.
We attempted to measure the O32 ratio for all the galaxies in our sample. Of the 16 sources with available NIRSpec spectra, one source lacked the [O III] and [O II] emission lines, and in two others, the lines fell outside the observed wavelength range, resulting in 13 galaxies for which O32 measurements were possible. From the NIRISS data (see also Sect. 3.1), we reextracted spectra for 71 sources, but only 12 of them showed at least one of the two emission lines with S/N > 5. This is primarily because the majority of our sources are located in the central portion of the field, where spectra are heavily contaminated by cluster galaxies (see Fig. 1). Unfortunately, our two candidate leakers are also located in a region that is heavily contaminated by cluster galaxies. This prevented us from obtaining reliable NIRISS spectra.
In total, we obtained reliable measurements (or limits) of O32 for 25 galaxies. At least one line is detected in all these galaxies, typically the strongest [O III]Ẇe employed a Gaussian profile fitting to determine the flux of each measurable emission line. The errors of the line flux were propagated from the initial photon statistics and fitting process to determine O32.
In Fig. 6 we show the O32 ratio for our 25 sources, plotted versus their MUV, corrected for magnification using the model from Bergamini et al. (2023a).
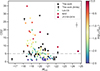 |
Fig. 6. O32 line ratio vs. MUV. The candidates in our sample with JWST spectra showing detectable emission lines are represented by black stars when both lines are detected, and they are represented with arrows when we have the [O III] measurement and [O II] is just an upper limit. The known leakers at z ∼ 0 and z ∼ 3 (Flury et al. 2022b; Vanzella et al. 2020; Marques-Chaves et al. 2022) are shown color-coded as a function of their measured fesc. The gray line (O32 = 5) indicates the threshold for LCEs proposed by Flury et al. (2022b). The typical error is shown below the legend. |
Additionally, we show individual detections of LyC leakers from the literature covering redshifts from z = 0 to z = 3, illustrating the range of O32 ratios as a function of MUV, with colors indicating their respective fesc values. The O32 values of our sample agree well with the distribution of previous data.
Adopting the threshold from Flury et al. (2022a), we selected the 14 sources showing O32 > 5, and we then stacked the UV data following the method detailed in Sect. 3.3 to detect or set a limit on their LyC emission. Since the LyC of these sources fall within either the F275W or F336W filters, we performed a two-step stacking. We first computed the median flux in each filter separately and then combined the results. We obtained a nondetection of the LyC flux, corresponding to an upper limit of fesc < 0.06, assuming again Lν(1500)/Lν(900) = 3 (Steidel et al. 2001; Grazian et al. 2016), and an average E(B − V) value of 0.2. We repeated the same exercise performed for the Lyα EWs by considering the median fesc of the LzLCS+ sources within our O32 range (approximately between 5 and 20; see Fig. 6). We predict an average fesc ∼ 0.08 for our sources. Thus, the expected LyC magnitude is again consistent with the upper limit obtained directly from the stack of sources with high O32, implying that our UV data are currently not deep enough to probe LyC flux in these small samples. At z ∼ 3, only two known leakers with measured O32 values are currently known (Marques-Chaves et al. 2022; Vanzella et al. 2020). The O32 ratio of these systems is similar to that of our 14 strong O32 galaxies, but their fesc is far higher. One reason might be that they are both significantly brighter in terms of MUV or in low-transparency sight lines, which limits the significance of our comparison.
5.2. Physical properties of the candidate LyC leakers
It is crucial to investigate the physical properties of LyC emitters for understanding the mechanisms enabling the escape of ionizing radiation from galaxies and their role in the reionization of the universe.
The debate over which galaxy mass regime primarily drives reionization is ongoing. Low-mass galaxies (M* ∼ 109 M⊙), with their weaker gravitational potentials, are more prone to removal of obscuring material by stellar winds and supernovae (SNe), thereby enhancing the escape fraction of LyC photons (e.g., Razoumov & Sommer-Larsen 2010; Wise et al. 2014; Paardekooper et al. 2015; Robertson 2022). In contrast, more massive galaxies possess the gas reservoirs necessary to sustain high star formation rate (SFR) densities. These galaxies experience less negative feedback from stellar winds and SNe, allowing for more substantial star formation and, consequently, greater LyC photon production (Wyithe & Loeb 2013).
Observations of local LyC emission (e.g., Izotov et al. 2018; Flury et al. 2022a,b) tend to support the dwarf-galaxy scenario indicated by radiation hydrodynamical simulations (e.g., Trebitsch et al. 2017), as do some comprehensive models that include massive galaxies, active galactic nuclei (AGNs), and dwarf galaxies (e.g., Dayal et al. 2020).
In the LzLCS+ sample (Flury et al. 2022a,b), the strongest leakers have the lowest stellar masses, but still span a rather wide range from M* = 107 to almost 1010 M⊙; they tend to be the most compact sources, with UV half-light radii re ranging from 0.3 to 2 kpc. finally, their ΣSFR and sSFR values suggest highly concentrated star formation regions. Chisholm et al. (2022) also identified the slope β as one of the properties that is highly correlated with fesc because it is linked with dust and metallicity in the environment.
Specifically, galaxies with β = −2.11, −2.35, −2.60 show a population-averaged fesc = 0.05, 0.10, 0.20, respectively. Currently, with few and sparse detections of LCEs at z ∼ 3 compared to the LzLCS+ sample, it is unclear whether the same trends are also valid at intermediate redshift.
In Fig. 7 we show various physical properties of our two new z = 3 candidate LyC leakers compared to the LzLCS+ sample and to the known leakers at intermediate redshifts for which we have measured properties (Vanzella et al. 2016, 2018, 2020; Marques-Chaves et al. 2022; Kerutt et al. 2024; Jung et al. 2024). The properties of the two new candidates are comparable to those of known LyC leakers with similar fesc at low and intermediate redshifts. Specifically, they have blue UV β slopes, low stellar masses, and faint MUV. The intrinsic UV half-light radii of the sources, measured in the JWST/NIRCam F090W, corrected for lensing magnification (μ = 2.38 and 2.15, Bergamini et al. 2023a), are 1.00 kpc and 0.62 kpc, respectively. These values confirm the compact nature of the systems, consistent with expectations for LyC emitting galaxies (Flury et al. 2022b).
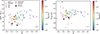 |
Fig. 7. Location of our two LyC candidate leakers (stars) in the β vs. stellar mass (left) and β vs. MUV (right) diagrams, compared to known leakers at z ∼ 0.3 (Flury et al. 2022b) and z > 2 (Vanzella et al. 2016, 2018, 2020; Marques-Chaves et al. 2022; Kerutt et al. 2024; Jung et al. 2024). The sources are color-coded based on their log10fesc values. A typical error bar is shown in the bottom right corner of each figure. |
We note again that the scatter shown between LyC emission and physical properties (as also noted when discussing Lyα and O32) is large and underscores the complexity and diversity of the LyC escape process across different epochs. For this reason, several studies have employed a multivariate approach to model the relation between fesc and the physical properties of the sources, in order to effectively infer fesc for sources during the EoR where the direct detection of LyC flux is impossible (e.g., Jaskot et al. 2024a,b; Mascia et al. 2023, 2024a; Choustikov et al. 2024; Lin et al. 2024). Currently, these predictions are essentially calibrated using the LzLCS+ sample since, as evident from Fig. 7, confirmed LyC leakers at z = 3 are scarce, and most of them exhibit higher fesc than their low-redshift counterparts (see also Fig. 5, where the offset between low- and high-redshift leakers is apparent). The reason is the higher IGM opacity at high redshift, which implies that the strong leakers alone are easily detectable. It might also be explained by a redshift-dependent evolution in LyC escape physics. Models suggest that the specific star formation rate (sSFR) increases with redshift, and so does fesc, while outflows may play a key role in the decrease in the β slope with redshift (Ferrara et al. 2025). Substantial scatter in the data limits our ability to robustly quantify these differences or extrapolate low-z trends, however. Additional observations and confirmed LyC emitters at cosmic noon are thus essential to establish robust conclusions through a comparison with low-redshift samples.
6. Summary and conclusions
We searched for new LyC candidate leakers in a sample of 91 spectroscopically confirmed star-forming galaxies in the A2744 cluster field. The sample includes galaxies with spectra obtained from JWST/NIRSpec, JWST/NIRISS WFSS, and VLT/MUSE observations. We searched for LyC flux in the HST/F275W and HST/F336W filters, corresponding to the rest-frame 800–900 Å for galaxies at 2.4 < z < 3.06 and 3.06 < z < 4, respectively. Additionally, we performed an SED fitting using multiband observations from HST and JWST/NIRCam to estimate the physical properties of these galaxies.
We identified two new z ∼ 3 candidate LyC leakers, with LyC flux showing S/N > 2, and we derived their fesc using two approaches: the direct calculation and SED model fitting. The escape fractions of the two identified candidate leakers are greater than 0.2, with MUSE4010 showing an especially high escape fraction of approximately 0.9, consistently between the two methods. For the rest of the nondetections (i.e., 89 objects with S/N < 2 in the UV bands), we employed a stacking of the UV bands, but found no significant signal, thereby constraining the upper limit of LyC escape for the lower- and higher-redshift groups to be fesc ≤ 0.058. These results are consistent with previous findings in the literature from stacking analysises (e.g., Vanzella et al. 2015; Rutkowski et al. 2017; Liu et al. 2023; Kerutt et al. 2024), which suggests that only a small fraction of star-forming galaxies have conditions leading to a conspicuous escape of ionizing photons, whereas the general population has much lower fesc values. Precise fesc estimates remain sensitive to assumptions about stellar population, dust attenuation, and IGM absorption. This highlights the uncertainties in these calculations, especially at intermediate redshift.
We also explored the properties that were proposed to be the best indirect tracers of LyC escape. Particularly, we investigated the relation between fesc, Lyα EW, O32 ratio, stellar mass, MUV, and β. The two new candidate leakers are indeed Lyα emitters, have blue UV slopes, have low masses, and are faint sources, and they are very compact in the UV. Unfortunately, we were unable to measure their O32 ratio from the NIRISS spectra because the sensitivity was limited. We also analyzed the spectral stacks of the strong Lyα emitters and the sources with a high O32 ratio, but only obtained a nondetection, with less stringent upper limits on the fesc. This is probably due to the current observational limitations of our UV data.
The question of which specific types of galaxies drove reionization remains an open topic of debate. Our observations, combined with those of existing LCEs at z ∼ 3 and lower redshifts, reinforce the evidence that properties such as stellar mass, β, and MUV show consistent correlations with fesc at different redshifts. These relations are very scattered, however, because LyC escape is a complex process, with multiple pathways and mechanisms enabling ionizing photon leakage at different epochs and for diverse galaxy populations (Jaskot et al. 2019; Flury et al. 2022b), and it might be strongly affected by the geometric distribution and line-of-sight effects. To further refine our understanding of LyC escape mechanisms and determine any possible evolution with cosmic time, deeper observations and larger samples at cosmic noon (z = 2 − 4) are required that also probe different fields to mitigate the IGM transmission variations. We remark that it would also be extremely important to detect galaxies with more modest LyC escape fractions at this intermediate redshift. This is essential to confirm potential correlations between LyC escape and galaxy properties. In this way, we would be able to construct robust predictions of LyC escape from multivariate diagnostics and apply them confidently during the epoch of reionization.
Acknowledgments
We acknowledge support from the National Science Foundation of China – 12225301, INAF Large grant “Spectroscopic survey with JWST” jand from PRIN 2022 MUR project 2022CB3PJ3 – First Light And Galaxy aSsembly (FLAGS) funded by the European Union – Next Generation EU, and Postgraduate Scholarship Program under the grant of China Scholarship Council. P.W. and B.V. acknowledge support from the INAF Mini Grant ‘1.05.24.07.01 RSN1: Spatially Resolved Near-IR Emission of Intermediate-Redshift Jellyfish Galaxies’ (PI Watson). We acknowledge A. Acebron, C. Grillo, and P. Rosati for their fundamental contribution to the strong lensing analysis and results. We also extend our gratitude to the JWST and HST teams for their efforts in designing, building, and operating these transformative missions.
References
- Alavi, A., Siana, B., Richard, J., et al. 2016, ApJ, 832, 56 [Google Scholar]
- Bassett, R., Ryan-Weber, E. V., Cooke, J., et al. 2019, MNRAS, 483, 5223 [Google Scholar]
- Bergamini, P., Acebron, A., Grillo, C., et al. 2023b, A&A, 670, A60 [NASA ADS] [CrossRef] [EDP Sciences] [Google Scholar]
- Bergamini, P., Acebron, A., Grillo, C., et al. 2023a, ApJ, 952, 84 [NASA ADS] [CrossRef] [Google Scholar]
- Bezanson, R., Labbe, I., Whitaker, K. E., et al. 2024, ApJ, 974, 92 [NASA ADS] [CrossRef] [Google Scholar]
- Bolan, P., Lemaux, B. C., Mason, C., et al. 2022, MNRAS, 517, 3263 [Google Scholar]
- Boquien, M., Burgarella, D., Roehlly, Y., et al. 2019, A&A, 622, A103 [NASA ADS] [CrossRef] [EDP Sciences] [Google Scholar]
- Borthakur, S., Heckman, T. M., Leitherer, C., & Overzier, R. A. 2014, Science, 346, 216 [Google Scholar]
- Bosman, S. E. I., Davies, F. B., Becker, G. D., et al. 2022, MNRAS, 514, 55 [NASA ADS] [CrossRef] [Google Scholar]
- Boutsia, K., Grazian, A., Giallongo, E., et al. 2011, ApJ, 736, 41 [NASA ADS] [CrossRef] [Google Scholar]
- Boyett, K., Mascia, S., Pentericci, L., et al. 2022, ApJ, 940, L52 [NASA ADS] [CrossRef] [Google Scholar]
- Brammer, G. 2019, Astrophysics Source Code Library [record ascl:1905.001] [Google Scholar]
- Bruzual, G., & Charlot, S. 2003, MNRAS, 344, 1000 [NASA ADS] [CrossRef] [Google Scholar]
- Burgarella, D., Buat, V., & Iglesias-Páramo, J. 2005, MNRAS, 360, 1413 [NASA ADS] [CrossRef] [Google Scholar]
- Calzetti, D., Armus, L., Bohlin, R. C., et al. 2000, ApJ, 533, 682 [NASA ADS] [CrossRef] [Google Scholar]
- Chabrier, G. 2003, PASP, 115, 763 [Google Scholar]
- Chisholm, J., Saldana-Lopez, A., Flury, S., et al. 2022, MNRAS, 517, 5104 [CrossRef] [Google Scholar]
- Choustikov, N., Katz, H., Saxena, A., et al. 2024, MNRAS, 529, 3751 [NASA ADS] [CrossRef] [Google Scholar]
- Citro, A., Scarlata, C. M., Mantha, K. B., et al. 2025, ApJ, 986, 184 [Google Scholar]
- Conroy, C., Villaume, A., van Dokkum, P. G., & Lind, K. 2018, ApJ, 854, 139 [Google Scholar]
- Dayal, P., Volonteri, M., Choudhury, T. R., et al. 2020, MNRAS, 495, 3065 [Google Scholar]
- Dayal, P., Volonteri, M., Greene, J. E., et al. 2025, A&A, 697, A211 [NASA ADS] [CrossRef] [EDP Sciences] [Google Scholar]
- de Barros, S., Vanzella, E., Amorín, R., et al. 2016, A&A, 585, A51 [NASA ADS] [CrossRef] [EDP Sciences] [Google Scholar]
- Dijkstra, M., Wyithe, S., Haiman, Z., Mesinger, A., & Pentericci, L. 2014, MNRAS, 440, 3309 [CrossRef] [Google Scholar]
- Ferrara, A., Giavalisco, M., Pentericci, L., et al. 2025, Open J. Astrophys., 8, 125 [Google Scholar]
- Finkelstein, S. L., D’Aloisio, A., Paardekooper, J.-P., et al. 2019, ApJ, 879, 36 [Google Scholar]
- Fletcher, T. J., Tang, M., Robertson, B. E., et al. 2019, ApJ, 878, 87 [Google Scholar]
- Flury, S. R., Jaskot, A. E., Ferguson, H. C., et al. 2022a, ApJS, 260, 1 [NASA ADS] [CrossRef] [Google Scholar]
- Flury, S. R., Jaskot, A. E., Ferguson, H. C., et al. 2022b, ApJ, 930, 126 [NASA ADS] [CrossRef] [Google Scholar]
- Gazagnes, S., Chisholm, J., Schaerer, D., Verhamme, A., & Izotov, Y. 2020, A&A, 639, A85 [NASA ADS] [CrossRef] [EDP Sciences] [Google Scholar]
- Grazian, A., Giallongo, E., Gerbasi, R., et al. 2016, A&A, 585, A48 [NASA ADS] [CrossRef] [EDP Sciences] [Google Scholar]
- Grazian, A., Giallongo, E., Paris, D., et al. 2017, A&A, 602, A18 [NASA ADS] [CrossRef] [EDP Sciences] [Google Scholar]
- Heckman, T. M., Borthakur, S., Overzier, R., et al. 2011, ApJ, 730, 5 [Google Scholar]
- Henry, A., Scarlata, C., Martin, C. L., & Erb, D. 2015, ApJ, 809, 19 [Google Scholar]
- Horne, K. 1986, PASP, 98, 609 [Google Scholar]
- Inoue, A. K., & Iwata, I. 2008, MNRAS, 387, 1681 [Google Scholar]
- Inoue, A. K., Shimizu, I., Iwata, I., & Tanaka, M. 2014, MNRAS, 442, 1805 [NASA ADS] [CrossRef] [Google Scholar]
- Izotov, Y. I., Guseva, N. G., Fricke, K. J., Henkel, C., & Schaerer, D. 2017, MNRAS, 467, 4118 [NASA ADS] [CrossRef] [Google Scholar]
- Izotov, Y. I., Worseck, G., Schaerer, D., et al. 2018, MNRAS, 478, 4851 [Google Scholar]
- Jakobsen, P., Ferruit, P., Alves de Oliveira, C., et al. 2022, A&A, 661, A80 [NASA ADS] [CrossRef] [EDP Sciences] [Google Scholar]
- Jaskot, A. E., & Oey, M. S. 2013, ApJ, 766, 91 [Google Scholar]
- Jaskot, A. E., Dowd, T., Oey, M. S., Scarlata, C., & McKinney, J. 2019, ApJ, 885, 96 [Google Scholar]
- Jaskot, A. E., Silveyra, A. C., Plantinga, A., et al. 2024a, ApJ, 972, 92 [NASA ADS] [CrossRef] [Google Scholar]
- Jaskot, A. E., Silveyra, A. C., Plantinga, A., et al. 2024b, ApJ, 973, 111 [NASA ADS] [CrossRef] [Google Scholar]
- Ji, Z., Giavalisco, M., Vanzella, E., et al. 2020, ApJ, 888, 109 [Google Scholar]
- Jiang, D., Jiang, L., Sun, S., Liu, W., & Fu, S. 2025, Nat. Astron. [arXiv:2502.03683] [Google Scholar]
- Jung, I., Finkelstein, S. L., Dickinson, M., et al. 2020, ApJ, 904, 144 [NASA ADS] [CrossRef] [Google Scholar]
- Jung, I., Ferguson, H. C., Hayes, M. J., et al. 2024, ApJ, 971, 175 [NASA ADS] [CrossRef] [Google Scholar]
- Katz, H., Ďurovčíková, D., Kimm, T., et al. 2020, MNRAS, 498, 164 [Google Scholar]
- Kerutt, J., Oesch, P. A., Wisotzki, L., et al. 2024, A&A, 684, A42 [NASA ADS] [CrossRef] [EDP Sciences] [Google Scholar]
- Komarova, L., Oey, M. S., Hernandez, S., et al. 2024, ApJ, 967, 117 [Google Scholar]
- Kreilgaard, K. C., Mason, C. A., Cullen, F., Begley, R., & McLure, R. J. 2024, A&A, 692, A57 [NASA ADS] [CrossRef] [EDP Sciences] [Google Scholar]
- Lin, Y.-H., Scarlata, C., Williams, H., et al. 2024, MNRAS, 527, 4173 [Google Scholar]
- Liu, Y., Jiang, L., Windhorst, R. A., Guo, Y., & Zheng, Z.-Y. 2023, ApJ, 958, 22 [NASA ADS] [CrossRef] [Google Scholar]
- Llerena, M., Amorín, R., Pentericci, L., et al. 2024, A&A, 691, A59 [NASA ADS] [CrossRef] [EDP Sciences] [Google Scholar]
- Marchi, F., Pentericci, L., Guaita, L., et al. 2017, A&A, 601, A73 [NASA ADS] [CrossRef] [EDP Sciences] [Google Scholar]
- Marchi, F., Pentericci, L., Guaita, L., et al. 2018, A&A, 614, A11 [NASA ADS] [CrossRef] [EDP Sciences] [Google Scholar]
- Marques-Chaves, R., Schaerer, D., Álvarez-Márquez, J., et al. 2021, MNRAS, 507, 524 [NASA ADS] [CrossRef] [Google Scholar]
- Marques-Chaves, R., Schaerer, D., Álvarez-Márquez, J., et al. 2022, MNRAS, 517, 2972 [CrossRef] [Google Scholar]
- Mascia, S., Pentericci, L., Calabrò, A., et al. 2023, A&A, 672, A155 [NASA ADS] [CrossRef] [EDP Sciences] [Google Scholar]
- Mascia, S., Pentericci, L., Calabrò, A., et al. 2024a, A&A, 685, A3 [NASA ADS] [CrossRef] [EDP Sciences] [Google Scholar]
- Mascia, S., Roberts-Borsani, G., Treu, T., et al. 2024b, A&A, 690, A2 [NASA ADS] [CrossRef] [EDP Sciences] [Google Scholar]
- Mason, C. A., Fontana, A., Treu, T., et al. 2019, MNRAS, 485, 3947 [NASA ADS] [CrossRef] [Google Scholar]
- Mauerhofer, V., Verhamme, A., Blaizot, J., et al. 2021, A&A, 646, A80 [NASA ADS] [CrossRef] [EDP Sciences] [Google Scholar]
- Merlin, E., Amorín, R., Castellano, M., et al. 2016, A&A, 590, A30 [NASA ADS] [CrossRef] [EDP Sciences] [Google Scholar]
- Merlin, E., Bonchi, A., Paris, D., et al. 2022, ApJ, 938, L14 [NASA ADS] [CrossRef] [Google Scholar]
- Merlin, E., Santini, P., Paris, D., et al. 2024, A&A, 691, A240 [NASA ADS] [CrossRef] [EDP Sciences] [Google Scholar]
- Mestric, U., Ryan-Weber, E. V., Cooke, J., et al. 2021, MNRAS, 508, 4443 [CrossRef] [Google Scholar]
- Micheva, G., Iwata, I., Inoue, A. K., et al. 2017, MNRAS, 465, 316 [NASA ADS] [CrossRef] [Google Scholar]
- Naidu, R. P., Forrest, B., Oesch, P. A., Tran, K.-V. H., & Holden, B. P. 2018, MNRAS, 478, 791 [NASA ADS] [CrossRef] [Google Scholar]
- Nakajima, K., & Ouchi, M. 2014, MNRAS, 442, 900 [Google Scholar]
- Nakajima, K., Ellis, R. S., Robertson, B. E., Tang, M., & Stark, D. P. 2020, ApJ, 889, 161 [NASA ADS] [CrossRef] [Google Scholar]
- Napolitano, L., Pentericci, L., Santini, P., et al. 2024, A&A, 688, A106 [NASA ADS] [CrossRef] [EDP Sciences] [Google Scholar]
- Oke, J. B., & Gunn, J. E. 1983, ApJ, 266, 713 [NASA ADS] [CrossRef] [Google Scholar]
- Ouchi, M., Ono, Y., & Shibuya, T. 2020, ARA&A, 58, 617 [Google Scholar]
- Paardekooper, J.-P., Khochfar, S., & Dalla Vecchia, C. 2015, MNRAS, 451, 2544 [Google Scholar]
- Pahl, A. J., Shapley, A., Steidel, C. C., Chen, Y., & Reddy, N. A. 2021, MNRAS, 505, 2447 [NASA ADS] [CrossRef] [Google Scholar]
- Paris, D., Merlin, E., Fontana, A., et al. 2023, ApJ, 952, 20 [CrossRef] [Google Scholar]
- Pentericci, L., Vanzella, E., Castellano, M., et al. 2018, A&A, 619, A147 [NASA ADS] [CrossRef] [EDP Sciences] [Google Scholar]
- Planck Collaboration VI. 2020, A&A, 641, A6 [NASA ADS] [CrossRef] [EDP Sciences] [Google Scholar]
- Price, S. H., Bezanson, R., Labbe, I., et al. 2025, ApJ, 982, 51 [Google Scholar]
- Prieto-Lyon, G., Mason, C., Mascia, S., et al. 2023, ApJ, 956, 136 [NASA ADS] [CrossRef] [Google Scholar]
- Razoumov, A. O., & Sommer-Larsen, J. 2010, ApJ, 710, 1239 [Google Scholar]
- Reddy, N. A., Steidel, C. C., Pettini, M., Bogosavljević, M., & Shapley, A. E. 2016, ApJ, 828, 108 [Google Scholar]
- Richard, J., Claeyssens, A., Lagattuta, D., et al. 2021, A&A, 646, A83 [EDP Sciences] [Google Scholar]
- Rivera-Thorsen, T. E., Dahle, H., Chisholm, J., et al. 2019, Science, 366, 738 [Google Scholar]
- Rivera-Thorsen, T. E., Hayes, M., & Melinder, J. 2022, A&A, 666, A145 [NASA ADS] [CrossRef] [EDP Sciences] [Google Scholar]
- Roberts-Borsani, G., Morishita, T., Treu, T., et al. 2022, ApJ, 938, L13 [NASA ADS] [CrossRef] [Google Scholar]
- Robertson, B. E. 2022, ARA&A, 60, 121 [NASA ADS] [CrossRef] [Google Scholar]
- Roy, N., Henry, A., Treu, T., et al. 2023, ApJ, 952, L14 [NASA ADS] [CrossRef] [Google Scholar]
- Roy, N., Heckman, T., Henry, A., et al. 2025, ApJ, 992, 91 [Google Scholar]
- Rutkowski, M. J., Scarlata, C., Henry, A., et al. 2017, ApJ, 841, L27 [NASA ADS] [CrossRef] [Google Scholar]
- Saldana-Lopez, A., Schaerer, D., Chisholm, J., et al. 2022, A&A, 663, A59 [NASA ADS] [CrossRef] [EDP Sciences] [Google Scholar]
- Sawant, A. N., Pellegrini, E. W., Oey, M. S., López-Hernández, J., & Micheva, G. 2021, ApJ, 923, 78 [Google Scholar]
- Saxena, A., Bunker, A. J., Jones, G. C., et al. 2024, A&A, 684, A84 [NASA ADS] [CrossRef] [EDP Sciences] [Google Scholar]
- Siana, B., Teplitz, H. I., Colbert, J., et al. 2007, ApJ, 668, 62 [Google Scholar]
- Siana, B., Teplitz, H. I., Ferguson, H. C., et al. 2010, ApJ, 723, 241 [NASA ADS] [CrossRef] [Google Scholar]
- Smail, I., Ivison, R. J., & Blain, A. W. 1997, ApJ, 490, L5 [NASA ADS] [CrossRef] [Google Scholar]
- Steidel, C. C., Pettini, M., & Adelberger, K. L. 2001, ApJ, 546, 665 [Google Scholar]
- Steidel, C. C., Bogosavljević, M., Shapley, A. E., et al. 2018, ApJ, 869, 123 [Google Scholar]
- Trebitsch, M., Blaizot, J., Rosdahl, J., Devriendt, J., & Slyz, A. 2017, MNRAS, 470, 224 [Google Scholar]
- Treu, T., Calabrò, A., Castellano, M., et al. 2023, ApJ, 942, L28 [CrossRef] [Google Scholar]
- Vanzella, E., Siana, B., Cristiani, S., & Nonino, M. 2010, MNRAS, 404, 1672 [NASA ADS] [Google Scholar]
- Vanzella, E., Guo, Y., Giavalisco, M., et al. 2012, ApJ, 751, 70 [NASA ADS] [CrossRef] [Google Scholar]
- Vanzella, E., de Barros, S., Castellano, M., et al. 2015, A&A, 576, A116 [NASA ADS] [CrossRef] [EDP Sciences] [Google Scholar]
- Vanzella, E., de Barros, S., Vasei, K., et al. 2016, ApJ, 825, 41 [NASA ADS] [CrossRef] [Google Scholar]
- Vanzella, E., Nonino, M., Cupani, G., et al. 2018, MNRAS, 476, L15 [Google Scholar]
- Vanzella, E., Caminha, G. B., Calura, F., et al. 2020, MNRAS, 491, 1093 [Google Scholar]
- Verhamme, A., Orlitová, I., Schaerer, D., & Hayes, M. 2015, A&A, 578, A7 [NASA ADS] [CrossRef] [EDP Sciences] [Google Scholar]
- Verhamme, A., Orlitová, I., Schaerer, D., et al. 2017, A&A, 597, A13 [NASA ADS] [CrossRef] [EDP Sciences] [Google Scholar]
- Wang, B., Heckman, T. M., Leitherer, C., et al. 2019, ApJ, 885, 57 [NASA ADS] [CrossRef] [Google Scholar]
- Wang, B., Heckman, T. M., Amorín, R., et al. 2021, ApJ, 916, 3 [NASA ADS] [CrossRef] [Google Scholar]
- Wang, X., Teplitz, H. I., Smith, B. M., et al. 2025, ApJ, 980, 74 [Google Scholar]
- Watson, P. J., Vulcani, B., Treu, T., et al. 2025, A&A, 699, A225 [NASA ADS] [CrossRef] [EDP Sciences] [Google Scholar]
- Whitler, L., Stark, D. P., Topping, M. W., et al. 2025, ApJ, accepted [arXiv:2501.00984] [Google Scholar]
- Wise, J. H., Demchenko, V. G., Halicek, M. T., et al. 2014, MNRAS, 442, 2560 [NASA ADS] [CrossRef] [Google Scholar]
- Wyithe, J. S. B., & Loeb, A. 2013, MNRAS, 428, 2741 [Google Scholar]
- Yamanaka, S., Inoue, A. K., Yamada, T., et al. 2020, MNRAS, 498, 3095 [NASA ADS] [CrossRef] [Google Scholar]
All Tables
Photometric results and the physical properties parameters estimated by the best-fit SED model of the two candidates.
All Figures
|
Fig. 1. LyC emitter candidates in the A2744 field, detected with NIRSpec (stars), NIRISS (squares), and MUSE (circles). The blue symbols represent galaxies detectable in WFC3/UVIS F275W at LyC wavelengths, and red indicates galaxies for which the LyC is redshifted to the WFC3/UVIS F336W bandpass. We also show the footprints of HST WFC3/UVIS F275W and F336W pointings, the GLASS-JWST-ERS and DDT 2756 observations, and VLT-MUSE observations (Richard et al. 2021) in the A2744 cluster field. They are superimposed on the JWST NIRCam F150W image from the UNCOVER program. |
| In the text | |
|
Fig. 2. Redshift distribution of the 91 spectroscopically confirmed sources in the A2744 field for which we searched for LyC emission. The blue distribution represents the sources where LyC is located in the UVIS/F275W filter, while the red distribution represents those that might be detectable in the F336W filter. |
| In the text | |
|
Fig. 3. Smoothed ionizing images (F275W or F336W) and nonionizing images (F606W) of the two LyC candidates. The red circles indicate the apertures with |
| In the text | |
|
Fig. 4. SED fitting results of the two objects. The purple circles show the observed flux, and the red dots show the model fluxes. The black curve shows the best-fit spectrum. The unattenuated and attenuated stellar spectra are also shown with the solid green and dashed blue line, respectively. |
| In the text | |
|
Fig. 5. Lyα EW vs. fesc. The red stars represent the two candidate leakers in our sample. Additionally, we show the fesc limits/values for the stacks of all the LAEs. For comparison, known leakers with Lyα emission at z ∼ 0 (Flury et al. 2022a) are shown in light gray, while those at z > 2 (Vanzella et al. 2018, 2020; Marques-Chaves et al. 2021, 2022; Liu et al. 2023; Kerutt et al. 2024) are presented in dark gray. Two limits constrained by stacks are presented as blue and yellow arrows (Marchi et al. 2018; Pahl et al. 2021). |
| In the text | |
|
Fig. 6. O32 line ratio vs. MUV. The candidates in our sample with JWST spectra showing detectable emission lines are represented by black stars when both lines are detected, and they are represented with arrows when we have the [O III] measurement and [O II] is just an upper limit. The known leakers at z ∼ 0 and z ∼ 3 (Flury et al. 2022b; Vanzella et al. 2020; Marques-Chaves et al. 2022) are shown color-coded as a function of their measured fesc. The gray line (O32 = 5) indicates the threshold for LCEs proposed by Flury et al. (2022b). The typical error is shown below the legend. |
| In the text | |
|
Fig. 7. Location of our two LyC candidate leakers (stars) in the β vs. stellar mass (left) and β vs. MUV (right) diagrams, compared to known leakers at z ∼ 0.3 (Flury et al. 2022b) and z > 2 (Vanzella et al. 2016, 2018, 2020; Marques-Chaves et al. 2022; Kerutt et al. 2024; Jung et al. 2024). The sources are color-coded based on their log10fesc values. A typical error bar is shown in the bottom right corner of each figure. |
| In the text | |
Current usage metrics show cumulative count of Article Views (full-text article views including HTML views, PDF and ePub downloads, according to the available data) and Abstracts Views on Vision4Press platform.
Data correspond to usage on the plateform after 2015. The current usage metrics is available 48-96 hours after online publication and is updated daily on week days.
Initial download of the metrics may take a while.