Fig. 6.
Download original image
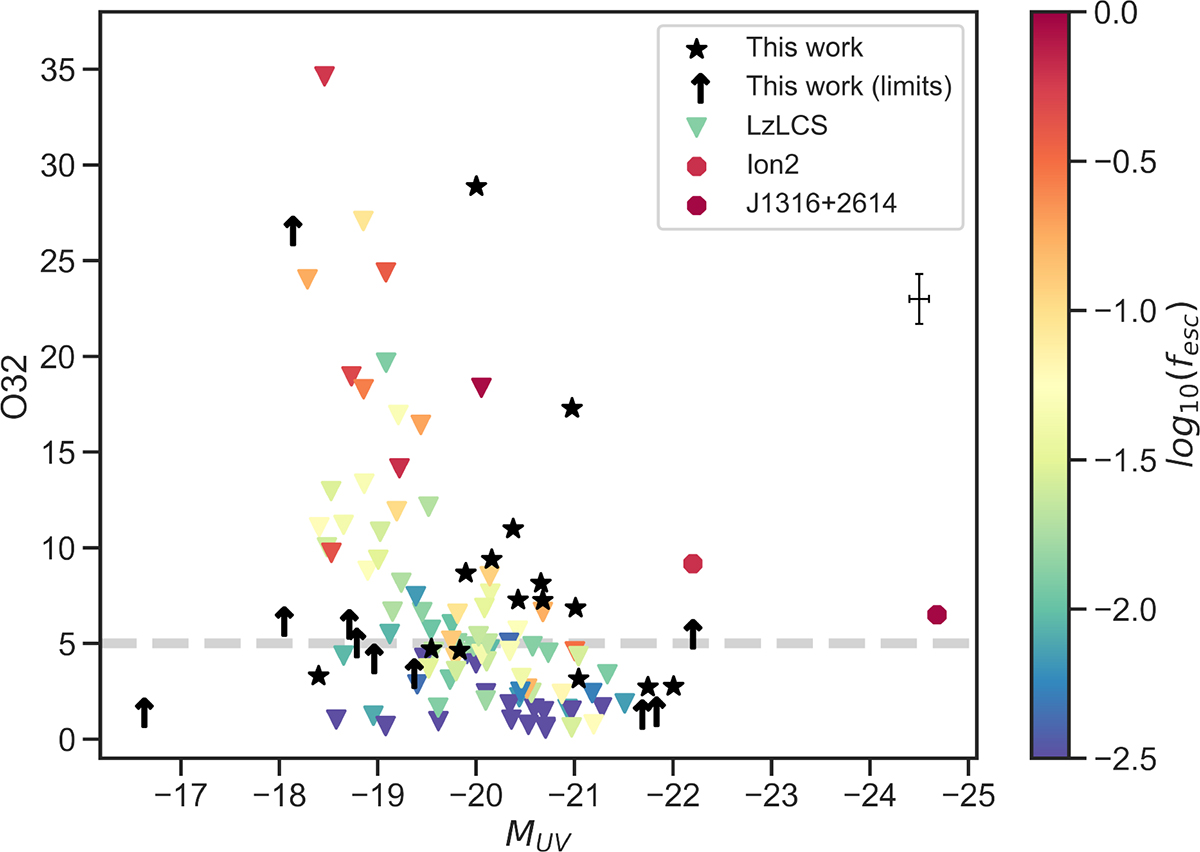
O32 line ratio vs. MUV. The candidates in our sample with JWST spectra showing detectable emission lines are represented by black stars when both lines are detected, and they are represented with arrows when we have the [O III] measurement and [O II] is just an upper limit. The known leakers at z ∼ 0 and z ∼ 3 (Flury et al. 2022b; Vanzella et al. 2020; Marques-Chaves et al. 2022) are shown color-coded as a function of their measured fesc. The gray line (O32 = 5) indicates the threshold for LCEs proposed by Flury et al. (2022b). The typical error is shown below the legend.
Current usage metrics show cumulative count of Article Views (full-text article views including HTML views, PDF and ePub downloads, according to the available data) and Abstracts Views on Vision4Press platform.
Data correspond to usage on the plateform after 2015. The current usage metrics is available 48-96 hours after online publication and is updated daily on week days.
Initial download of the metrics may take a while.