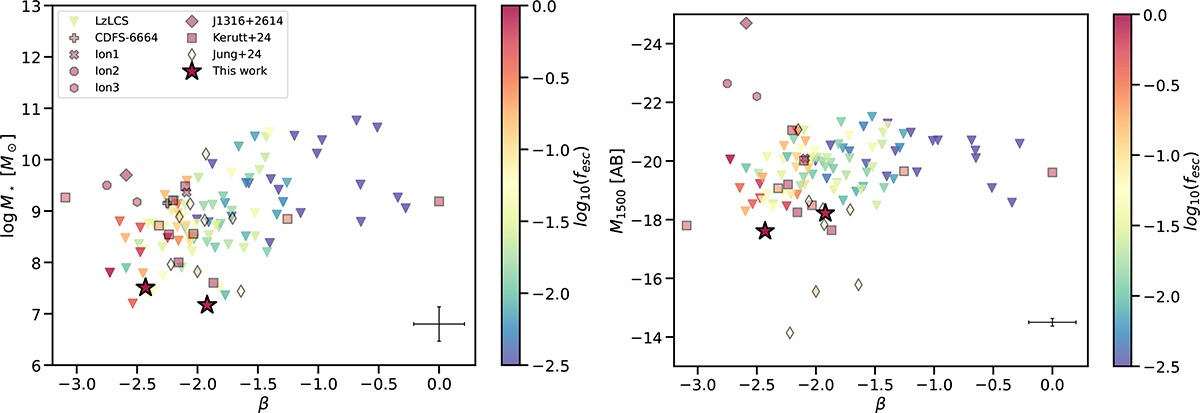
Fig. 7.
Download original image
Location of our two LyC candidate leakers (stars) in the β vs. stellar mass (left) and β vs. MUV (right) diagrams, compared to known leakers at z ∼ 0.3 (Flury et al. 2022b) and z > 2 (Vanzella et al. 2016, 2018, 2020; Marques-Chaves et al. 2022; Kerutt et al. 2024; Jung et al. 2024). The sources are color-coded based on their log10fesc values. A typical error bar is shown in the bottom right corner of each figure.
Current usage metrics show cumulative count of Article Views (full-text article views including HTML views, PDF and ePub downloads, according to the available data) and Abstracts Views on Vision4Press platform.
Data correspond to usage on the plateform after 2015. The current usage metrics is available 48-96 hours after online publication and is updated daily on week days.
Initial download of the metrics may take a while.