Fig. 4
Download original image
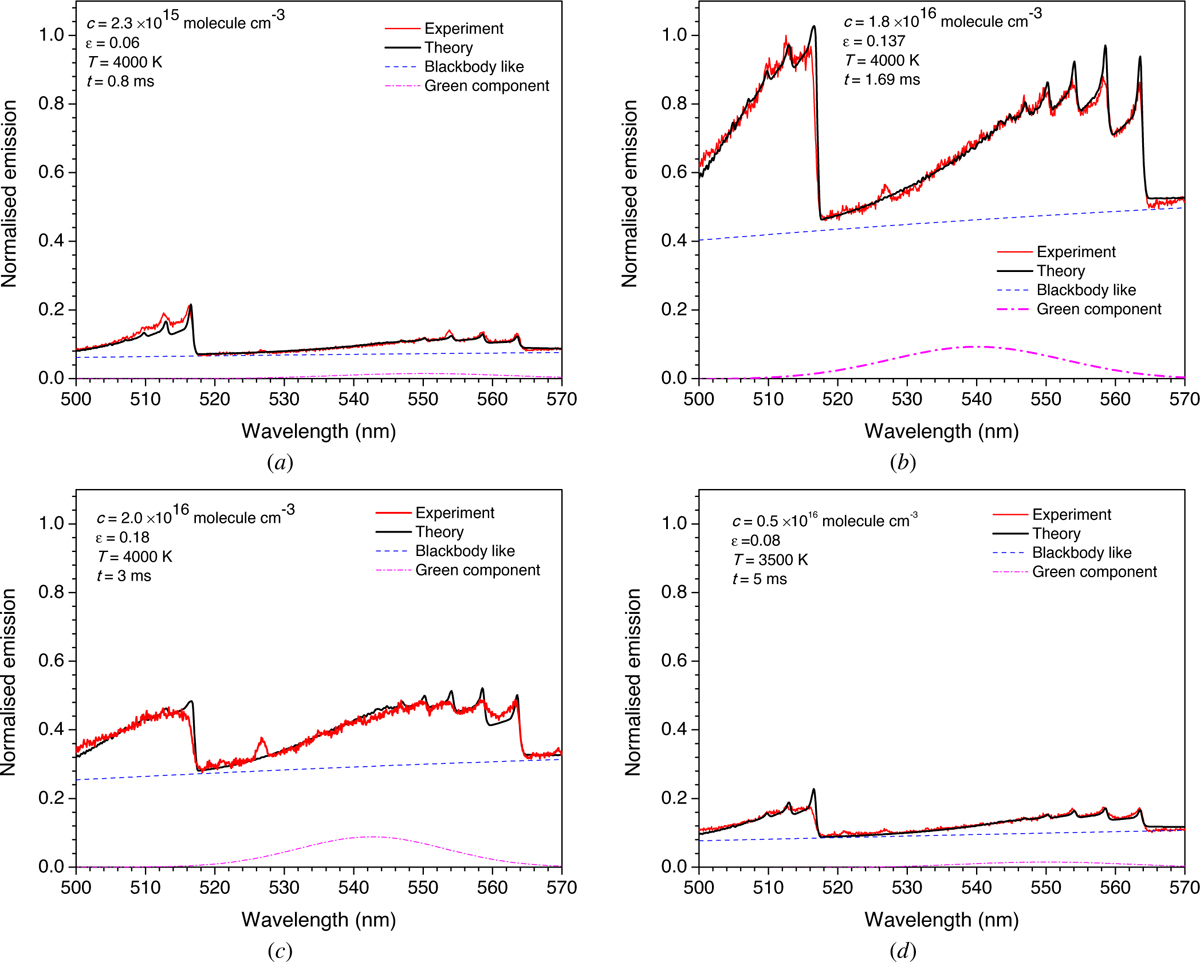
Calculated spectra (black) compared to experimental optical emission spectra (red) of shock-induced coronene. Self-absorption was taken into account in the simulations. Adjusted values for ϵ, [C2] and Tgas: (a) 0.06, 2.3×10¹⁵ molecule cm−3, 4000 K; (b) 0.137, 1.8×10¹⁶ molecule cm−3, 4000 K; (c) 0.18, 2×10¹⁶ molecule cm−3, 4000 K and (d) 0.08, 5×10¹⁵ molecule cm−3, 3500 K. Contamination by iron (Fe I) (527 nm) was also identified.
Current usage metrics show cumulative count of Article Views (full-text article views including HTML views, PDF and ePub downloads, according to the available data) and Abstracts Views on Vision4Press platform.
Data correspond to usage on the plateform after 2015. The current usage metrics is available 48-96 hours after online publication and is updated daily on week days.
Initial download of the metrics may take a while.