| Issue |
A&A
Volume 704, December 2025
|
|
|---|---|---|
| Article Number | A345 | |
| Number of page(s) | 22 | |
| Section | Interstellar and circumstellar matter | |
| DOI | https://doi.org/10.1051/0004-6361/202556417 | |
| Published online | 23 December 2025 | |
Shock-induced evolution: Tracing the fate of coronene in astrophysical environments
1
Institut de Physique de Rennes, UMR CNRS 6251, Université de Rennes,
Campus de Beaulieu,
35042
Rennes Cedex,
France
2
Department of Inorganic and Physical Chemistry, Indian Institute of Science,
Bangalore,
India
3
Laboratoire de Chimie et Physique Quantiques, IRSAMC, Université Paul Sabatier,
118 Route de Narbonne,
31062
Toulouse Cedex,
France
4
Department of Chemistry, GITAM School of Science, GITAM Deemed-to-be-University,
Bangalore,
India
5
Institut des Sciences Moléculaires d’Orsay, CNRS, Université Paris-Saclay, ISMO,
91405
Orsay,
France
6
Université Grenoble Alpes/UMR CNRS 5588, Laboratoire Interdisciplinaire de Physique,
38041
Grenoble,
France
7
Department of Chemistry, School of Advanced Sciences, Vellore Institute of Technology,
Vellore,
India
8
IRAP, Université de Toulouse, CNRS, CNES,
31028
Toulouse Cedex 4,
France
9
Department of Materials Engineering, Indian Institute of Science,
Bangalore,
India
10
Department of Aerospace Engineering, Indian Institute of Science,
Bangalore,
India
11
Interdisciplinary Centre for Energy Research, Indian Institute of Science,
Bangalore,
India
★ Corresponding author: This email address is being protected from spambots. You need JavaScript enabled to view it.
Received:
15
July
2025
Accepted:
29
September
2025
Abstract
Context. Polycyclic aromatic hydrocarbons (PAHs) are considered ubiquitous in the interstellar medium. There is now solid evidence for their presence. The mechanisms that lead to their formation and their destruction, remain debated, however. Of the processes that drive their evolution, the shock-induced alteration of PAHs has received little attention.
Aims. Our objective is to explore the gaseous volatiles and solid residues generated by shock-processing of coronene C24H12, which is a prototypical compact PAH with seven aromatic rings.
Methods. A pressure-driven shock tube was employed to sublimate and heat coronene up to 4000 K. The time evolution of the shock products was probed in situ by optical emission spectroscopy on a microsecond timescale. Solid residues were collected and analyzed ex situ by a variety of methods, including infrared microspectroscopy, Raman spectroscopy, X-ray diffraction, transmission electron microscopy, and laser desorption laser ionization mass spectrometry. The experiments were supported by molecular dynamics (MD) simulations.
Results. The experiments revealed a dominant dehydrogenation pathway for coronene under shock conditions. In situ spectroscopy confirmed the presence of C2 radicals and a broad continuum emission attributed to large carbon clusters (Cn) and small, weakly hydro-genated hydrocarbons (CnHx). The ex situ analysis of solid residues indicates the formation of graphitic and graphenic nanostructures, including carbon nano-onions, nanotubes, and nanoribbons in the cooling phase. Laser desorption laser ionization mass spectrometry analysis validates the carbonization of the shock products, while MD simulations support the dehydrogenation and fragmentation processes of the rapid-heating phase.
Conclusions. Shock waves drive the transformation of PAHs into small hydrocarbons and carbon clusters that recombine in the cooling phase into graphene-like structures. This affects the carbon life cycle of the interstellar medium. The identification of CnHx species as potential carriers of the broad green emission seen in the laboratory suggests a possible link to the λ5450 diffuse interstellar band. This study underscores the value of shock tubes as a tool for simulating astrophysical environments and investigating the chemical evolution of large molecules and small particles in space.
Key words: astrochemistry / molecular processes / shock waves / methods: laboratory: molecular / methods: laboratory: solid state
© The Authors 2025
 Open Access article, published by EDP Sciences, under the terms of the Creative Commons Attribution License (https://creativecommons.org/licenses/by/4.0), which permits unrestricted use, distribution, and reproduction in any medium, provided the original work is properly cited.
This article is published in open access under the Subscribe to Open model. This email address is being protected from spambots. You need JavaScript enabled to view it. to support open access publication.
1 Introduction
The recent discovery through radio observations in the cold and dense interstellar cloud TMC-1 of two isomers of cyanon-apthalene (C10H7CN, McGuire et al. 2021), of indene (C9H8, Burkhardt et al. 2021; Cernicharo et al. 2021), of isomers of cyano-acenaphtylene (C12H8, Cernicharo et al. 2024), of isomers of cyano-pyrene (C16H9CN, Wenzel et al. 2024; Wenzel et al. 2025b), and of cyano-coronene (C24H11CN, Wenzel et al. 2025a) has brought decisive proof that polycyclic aromatic hydrocarbons (PAHs) are present in the interstellar medium (ISM). This comes some 40 years after the formulation of the PAH hypothesis (Leger & Puget 1984; Allamandola et al. 1985). These large molecules resulting from the fusion of aromatic rings have been proposed to cause the mid-infrared (IR) emission features that are commonly observed in a wide variety of astrophysical regions at 3.3, 6.2, 7.7, 8.6, 11.3, and 12.7 µm. Upon absorption of ultraviolet (UV) photons, PAH molecules become highly vibrationally excited and subsequently relax through emission of IR photons at specific wavelengths. Astronomical observations suggest that PAHs are abundant and widespread in photodissociation regions associated with massive star-forming regions, planetary nebulae, and protoplanetary disks (Verstraete et al. 1996; Genzel et al. 1998; Hony et al. 2001; Peeters et al. 2002; Habart et al. 2024; Peeters et al. 2024; Chown et al. 2024). The dominant viewpoint is that large PAHs cause this IR emission. Photostability studies suggest a lower limit of about 50 carbon atoms (e.g., Montillaud et al. 2013), whereas a more recent spectral study indicates sizes in the range of 40–55 carbon atoms (Lemmens et al. 2023). A large fraction of carbon, up to 10%, might be locked up in these species (Tielens 2008).
The omnipresence of PAHs in space has also caused researchers to consider them as potential carriers of diffuse interstellar bands (DIBs) (see, e.g., Salama et al. 2011). DIBs are ubiquitous absorption features seen in lines of sight crossing diffuse interstellar clouds and spanning the near-UV to near-IR range (Herbig 1995; Elyajouri et al. 2018; Ebenbichler et al. 2022; Lallement et al. 2024; Cox et al. 2017; Omont 2024). Despite many attempts to link DIBs and PAHs, no decisive matches with cold gas-phase laboratory spectral signatures have been found (e.g., Romanini et al. 1999; Pino et al. 1999; Biennier et al. 2003; Staicu et al. 2006; Daly et al. 2023). As of today, only four DIBs have been assigned, all to C+60. They include the λ9577 and λ9632 strong DIBs (Campbell et al. 2015; Campbell & Maier 2017; Lallement et al. 2018; Cordiner et al. 2019). Among the other candidates, carbon chains appear to be promising (Zack & Maier 2014; Buntine et al. 2021), although previous tentative assignments to DIBs have also been inconclusive (see, e.g., Linnartz et al. 2010).
While considerable effort has been devoted to measuring the spectral signature of PAHs or derivatives, many studies have sought to explore their physicochemical properties. Beyond their formation pathways, which still elude us, many gaps persist in our understanding of how PAHs evolve and are altered. UV irradiation, cosmic-ray bombardment, and shocks count among the key drivers of PAH destruction.
The processing of PAHs in the ISM is largely driven by UV irradiation, which can affect their size, hydrogenation, and ionization states (Allain et al. 1996; Montillaud et al. 2013; Andrews et al. 2016). In the laboratory, a number of studies have focused on the first steps of dissociation under the interaction with a single vacuum-UV photon (Jochims et al. 1994; Zhen et al. 2016; West et al. 2018; Wenzel et al. 2020), showing the loss of H/H2 and C2H2 fragments for standard PAHs. Other hydrocarbon fragments (e.g., CH3) were reported for superhydrogenated PAHs (West et al. 2014; Diedhiou et al. 2020; Marciniak et al. 2021). More complete fragmentation patterns were obtained in studies using nanosecond laser irradiation at a particular wavelength (Zhen et al. 2014; Hrodmarsson et al. 2022, 2023; Panchagnula et al. 2024) or continuous irradiation with an Xe lamp (Ekern et al. 1998; Joblin 2003). Although these conditions do not mimic the irradiation conditions in astrophysical environments, these experiments revealed the most stable fragments upon photoprocessing. In particular, pure carbon clusters ![Mathematical equation: $[{\rm{C}}_{11}^ + - {\rm{C}}_{15}^ + ]$](/articles/aa/full_html/2025/12/aa56417-25/aa56417-25-eq1.png) appeared as major fragments in the photoprocessing of PAHs, including coronene and dibenzopyrene (C24H12), isoviolanthrene (C34H18), and dicoronylene (C48H20) (Joblin 2003; Hrodmarsson et al. 2022, 2023). This can easily be explained by dissociation proceeding through H/H2 loss until formation of a pure carbon backbone (e.g., the coronene cation,
appeared as major fragments in the photoprocessing of PAHs, including coronene and dibenzopyrene (C24H12), isoviolanthrene (C34H18), and dicoronylene (C48H20) (Joblin 2003; Hrodmarsson et al. 2022, 2023). This can easily be explained by dissociation proceeding through H/H2 loss until formation of a pure carbon backbone (e.g., the coronene cation,  , leads to the formation of
  , which further dissociates into smaller clusters). When large PAHs have lost all hydrogen, they can isomerize into buckminsterfullerene C60 (Zhen et al. 2014). This highlights the significance of top-down synthesis pathways for chemical complexity in space via the sequential removal of hydrogen units and subsequent losses of C2 units (Berné & Tielens 2012; Berné et al. 2015).
Cosmic rays participate in the processing of PAHs especially in the densest phases in which photons do not penetrate. Collisions can lead to carbon atom ejection, with a consequent disruption and destruction of the molecular target. A few laboratory studies have been conducted to investigate this high-energy interaction. Chabot et al. (2019) examined the lifetime of free-flying PAHs after their interaction with heavy cosmic rays, for instance, with the help of theoretical calculations that were supported by a few validation measurements. Cosmic-ray bombardment of PAHs was also modeled by Micelotta et al. (2011). One of the conclusions of that study was that direct processing from cosmic rays was, counterintuitively, important in weakly shielded environments.
Shock waves are ubiquitous in space. They are driven by events such as supernova explosions, outflows from forming stars, cloud-cloud collisions, or stellar winds. Their propagation leads to a sudden compression, heating, and particle acceleration. They are considered to actively participate in the physical and chemical evolution of the interstellar medium. Shocks can increase the PAH abundance by breaking down large grains through collisions with fast atoms or ions, but they also decrease it by destroying them directly.
In the high-energy range (several keV), the energy transfer is dominated by the interaction of the incoming projectile ion with the electron cloud of the target. Laboratory experiments on the collision of multiply charged ions with small- to medium-size PAHs, conducted with heavy ion accelerators and tabletop experiments, have shown substantial fragmentation with the domination of –H, –H2, and –C2H2 losses as well as the formation and growth of multiply charged fragments (e.g., Postma et al. 2009; Ławicki et al. 2011; Champeaux et al. 2014; Delaunay et al. 2015). The formation of molecular hydrogen (H2) is a critical initial fragmentation step for internal PAH temperatures over approximately 2200 K, regardless of the excitation method that is employed (ions, photons, electrons, etc.) (Chen et al. 2015).
Studies performed with the help of ion storage rings operating at lower energies in the center of mass (∼100 eV) (in which nuclear interactions dominate) showed that in collisions of anthracene (C14H10), perylene (C20H12), and coronene (C24H12) cations with He, nonstatistical processes, leading to -CHx loss or -C atom loss, for example, become increasingly important as the PAH size increases (Gatchell et al. 2014; Stockett et al. 2014, 2015; Gatchell et al. 2021). The prediction is that these mechanisms will strongly dominate the fragmentation pathways for large enough PAHs. The fate of PAHs in shock-dominated regions was explored through modeling by Micelotta et al. (2010), who examined the effects of energetic (0.01–1 keV) ions (H, He, and C) and electron collisions on PAHs in interstellar shock waves. They reported that 50 carbon atoms PAHs were significantly disrupted in ionic collisions for shock velocities below 75 km s−1, mainly by sputtering during nuclear interaction.
The effect of shock waves on carbon dust analogs or building blocks can complementarily be explored with the help of shock tubes in the same spirit as in our pioneering work (Biennier et al. 2017; Chakraborty et al. 2024) and analogous studies on amorphous carbon nanodust, for example (Roy et al. 2022). This tool gives access to a high-energy regime in which statistical processes are thought to dominate. In the current work, we investigate the stability of coronene (C24H12), an emblematic PAH, against shocks by combining laboratory experiments and theoretical calculations. One of the long-term goals that is being pursued is to contribute to a better understanding of the life cycle of carbon in space.
The manuscript is organized as follows: We describe the experimental method for studying the in situ chemical evolution of coronene in Section 2 and the associated emission spectroscopy results follow in Section 3. Molecular dynamics (MD) simulations (Section 4) were carried out to help us understand the destruction processes. Ex situ analyses of the solid residues were conducted (Section 5) in parallel using laser desorption laser ionization mass spectrometry, X-ray diffraction, and Raman and infrared spectroscopy to obtain some insight into the chemical structure of the shock products. Microscopy was finally employed to shed some light into the physical transformations of the sample. The paper concludes with a discussion of the findings (Section 6) and of the astrophysical implications (Section 7).
2 Pressure-driven shock tube
2.1 Working principle
High-enthalpy shock-tube experiments can be used to examine aerodynamic and chemical kinetic phenomena. The bursting-diaphragm technique in a single-pulse shock tube is frequently employed for studying high-temperature and pressure processes related to homogeneous or heterogeneous gas dynamics. A shock tube is made of two sections, separated by a thin diaphragm. The driver section is filled at high pressure (P4) with a low-density gas, usually helium. In contrast, the driven section is emptied and filled at a lower pressure (P1) with the test gas mixture to be studied. When the diaphragm bursts by raising the driver-gas pressure, the driver gas rushes out into the driven section where it produces a shock wave. Upon reaching the end of the tube, the incident shock wave is reflected into the gas that has already undergone heating due to the passage of the incident wave. Consequently, the gas experiences further temperature, pressure, and density elevations.
The advantages of a shock tube are that the slice of shock-heated gas is very uniform, and the boundary layer at the tube wall is thin, resulting in negligible wall effects. The heating process occurs on the microsecond timescale and initially takes the form of high translational energy, which is then converted by collisions into rotational, vibrational, and electronic forms. In experimental chemical kinetics and spectroscopy studies, the rate parameters are functions of pressure and temperature. The experimental gas can be heated to the required temperature and pressure by varying the thickness and grooving of the diaphragm.
2.2 Material Shock Tube facility
For this work, we employed the Material Shock Tube (MST) at the Laboratory for Hypersonic and Shock Wave Research at the Indian Institute of Science, Bangalore. This facility was designed to study how shock waves interact with solids and gases in ways that are relevant to astrophysical conditions. It is equipped with a sample chamber (Fig. 1), which is the centerpiece of the instrument. The MST comprises a stainless-steel tube with a 54 mm internal diameter and 25 mm wall thickness. The driver section is 2.1 m long, while the driven section extends 4.75 m before the pneumatic ball valve. The driver section’s length can be modified to provide the appropriate reaction time behind the reflected shock wave, achieving about ∼2 ms of dwell time (Fig. 2). The sample chamber includes the driven section after the ball valve, the sample holder, the extension part, the optical chamber, and the end flange. The sample chamber, the optical flange with lens holders, and the end flange were made from aluminum to avoid surface contamination that can show up in the case of stainless steel. A dump tank with a diameter of 100 mm and length of 2 m was connected near the diaphragm station in the driven section at an angle of 45◦ to the shock tube. The advantage of the dump tank is that it ensures the shock tube operates with a single-pulse nature, thereby eliminating multiple reflections within the tube. More details of the mechanism of the ball valve and the dump tank can be found in the work of Singh et al. (2016). The experiment used an aluminum diaphragm of 1–2 mm thickness and variable grooving for bursting.
The pressure trace (Fig. 2) exhibits a two-stage pressure rise: first, due to the incident shock wave in the driven section, and second, upon reflection from the end flange. The subsequent gradual pressure decay results from the expansion wave. The time intervals between the rising fronts of the pressure trace from the incident shock were utilized to calculate the incident shock velocity and Mach number. The temperature and pressure behind the reflected shock waves were calculated from the Mach number using the standard one-dimensional normal shock equations from the Wisconsin Gas Dynamics Calculator1.
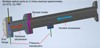 |
Fig. 1 Schematic representation of the sample chamber of the MST facility we used to study the in situ chemical and physical evolution of interstellar dust analogs. |
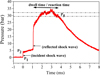 |
Fig. 2 Pressure evolution vs. time in the MST facility sample chamber (460 mm from the end flange). |
2.3 Chemicals and gases
The coronene C24H12, (mol. wt. = 300.36 u) powder was purchased from Tokyo Chemical Industry Co., Ltd., with >98% purity. The stainless-steel built sample holder placed in the sample chamber was loaded with 6 to 30 mg of sample, ready for shock wave exposure. Ultra-high-purity helium (99.999%) as the driver gas and argon (99.9999%) as the driven gas were used for all the experiments. The purpose of using argon was to maximize the P4/P1 ratio (argon is∼10 times heavier than helium) so as to obtain higher Mach number and uniform thermalization of the gas and solid sample mixture.
A small turbomolecular pump was used to evacuate the driven section down to 10−6 mbar before filling it up with argon. Depending on the required temperature (T5), the driven section was filled slowly with 0.14–0.47 bar of argon via a moisture trap cylinder (Silica gel beads) to avoid sample disruption. The driver portion was emptied using a rotary vacuum pump down to a pressure of 10−3 mbar before being filled with helium. The bursting pressure on the driver section side varied from 50 to 90 bar depending on the diaphragm properties.
2.4 Data acquisition system
Data acquisition (DAQ) was handled by a National Instruments (NI USB-6356) card and a digital storage oscilloscope (Tektronix TBS 2000B series). The DAQ recorded the output of 3 PCB pressure transducers (PT1, PT2, and PT3 sensors model 113B24 with 5 mV/psi) through PCB signal conditioners with amplification (model 441A42) as well as static pressure gauges and indicators. The DAQ was connected to a dedicated personal computer. A GUI-based NI LabVIEW software monitored the whole system. The pressure sensors were flush mounted on the shock tube and were connected to the DAQ system by low noise coaxial cables via a signal conditioning box acquired from PCB Piezotronics, Inc. The NI-DAQ and the oscilloscope were triggered by the PCB sensor mounted in the shock-tube-driven section to obtain the pressure profiles and the monochromator photomultiplier tube (PMT) signal. The NI-DAQ card triggered the STS-UV spectrometer and the high-speed line scan camera by sending a 5 V TTL pulse.
3 In situ optical emission spectroscopy
An optical chamber was specifically designed to perform in situ optical emission spectroscopy (OES) in the shock tube. The emission from the shock tube was captured radially 15 mm from the end flange. A pressure transducer was installed at the same position to get accurate pressure information simultaneously. A first port was connected to an Acton VM-502 vacuum monochromator from Princeton Instruments with a 200 µm diameter optical fiber to acquire time-resolved emission at a single wavelength. The monochromator covered the 200–600 nm wavelength range and was equipped with a DA-780-VUV PMT. A second port was connected to a STS-UV Ocean Optics mini-spectrometer with the help of a 50 µm diameter fiber. The optical emission spectra resulted of integrated signals over 10 ms covering the whole shock process. Finally, a third port was connected through a 1000 µm diameter optic fiber to a new home-built time-resolved spectrometer which included a refurbished manual monochromator and a high-speed camera. The spectrometer dispersed the emission from the shock-heated reaction mixture, and a CMOS line camera recorded the temporal data of the spectrally resolved emission. The refurbished monochromator was utilized to collect a small wavelength window of light from the emission in the shock tube and supply it to the camera. It was composed of a Newport 77298 grating assembly, ruled with 1200 line/mm, 360 nm blaze, to operate in the 200–1000 nm wavelength region. The opening slit was finely adjusted with a width that could vary from 4 µm to 3 mm and a height between 2 and 12 mm. The design was based on the Ebert-Fastie concept, employing a single large spherical mirror to collimate light entering the input port and focus diffracted light from the grating at the output port. A resolution of up to 0.1 nm was achieved. The central wavelength was chosen by manipulating a manual wavelength selector. The exit slit was removed and replaced by a line scan monochrome camera (Alkeria NECTA N4K-7), featuring a sensor with a resolution of 1(H) × 4096(W) with a pixel size of 3.5 µm × 3.5 µm. The maximum time resolution that could be attained was 10.6 µs. Most of the analysis is based on the information-rich time-resolved spectral measurements.
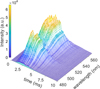 |
Fig. 3 Optical emission (color-coded) vs. wavelength (x-axis) and time (y-axis) from C24H12 exposed to a shock wave characterized by a temperature Tg of 4291 K. |
3.1 Spectral acquisition, treatment, and analysis
The transient wavelength-resolved emission measurements were collected onto the array of CMOS sensors under a frame acquisition mode. A 42.3 µs resolution was selected to acquire the timed data from the CMOS line camera. The choice of the camera’s frame rate was based on factors such as the readout intensity, readout noise, and dark noise during very short integration times. The recording sequence comprises a matrix of time and wavelength data, as shown in Fig. 3.
The wavelength calibration was achieved using emission lines from Hg, Ne and Na for the experiments in the 400–650 nm spectral range. The He-Ne laser (632.8 nm) and green solid-state laser (532 nm) lines were used to derive an instrument resolution of 0.8 nm. The CMOS sensor quantum efficiency of more than 0.5 in the 450–650 nm spectral range was taken into account in the intensity calibration of the spectrum. A spectral coverage of almost 100 nm was achieved. The intensity calibration was done via a halogen lamp of known intensity. The raw spectra exhibit fringes due to optical etaloning. The removal procedure started with the measurement of blackbody emission of a halogen lamp as a source, ensuring that the spectrum exclusively contained features related to the fringes of the lamp and instrument. We subsequently divided the halogen emission spectra by the fast Fourier transform (FFT) of the same spectrum to obtain a scaling factor. We then employed this scaling factor for each pixel on the CMOS sensor to multiply each freshly obtained spectrum by the instrument, yielding fringe-free spectra. Custom-written Lab-View and MATLAB programs were used to acquire the imaging data and handle the task of image processing, such as averaging and background subtraction. The processed spectra from 0 to 10 ms are displayed in Fig. 3.
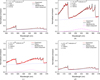 |
Fig. 4 Calculated spectra (black) compared to experimental optical emission spectra (red) of shock-induced coronene. Self-absorption was taken into account in the simulations. Adjusted values for ϵ, [C2] and Tgas: (a) 0.06, 2.3×10¹⁵ molecule cm−3, 4000 K; (b) 0.137, 1.8×10¹⁶ molecule cm−3, 4000 K; (c) 0.18, 2×10¹⁶ molecule cm−3, 4000 K and (d) 0.08, 5×10¹⁵ molecule cm−3, 3500 K. Contamination by iron (Fe I) (527 nm) was also identified. |
3.2 Major C2 emission, spectral components, and dynamical aspects
A selection of spectra recorded at different times behind the reflected shock were extracted from Fig. 3 and are displayed in Fig. 4 along with simulated spectra. Specific time stamps were chosen to highlight the evolution of the spectral profile at different intervals behind the shockwave. The interpretation of coronene shock-induced emission components was supported by parallel experiments on corannulene (C20H10), fullerene (C60) and ethylene (C2H4); a sample of which are displayed in the Appendix.
As expected for carbon-rich species, the in situ shock exposure of coronene generated significant amount of C2 radicals, which display a characteristic signature. Figure C.1 gathers integrated emission spectra recorded under various experimental conditions. These spectra clearly show that shock-processed coronene produces C2 features alongside a broad continuum in the UV-visible region. Dicarbon C2 has been detected in a variety of astronomical objects, while on Earth, it causes the green-blue glow associated with hydrocarbon flames (Schmidt 2021). A detailed discussion of the electronic transitions in the C2 radical was presented in our previous work (Chakraborty et al. 2024). The observed emission arises from transitions between the excited state (d3Πg) and the low-lying electronic state (a3Πu), and is commonly referred to as the Swan bands. Because of the C2 high abundance generated behind the shock-wave in our laboratory experiments, its vibrationally resolved bands were strongly affected by self-absorption (Georges et al. 2019). The C2 emission appears superimposed to a broad underlying continuum (Fig. 4) that was also observed in our previous work. To deepen our understanding of the physical processes involved, the emission spectra of the C2 radical were simulated under local thermodynamic equilibrium (LTE) conditions using the ExoCross package developed by Yurchenko et al. (2018). The methodology for deriving the temperature from the C2 emission spectrum, which accounts for self-absorption, was outlined in the preceding study on shock processing of C60 (Chakraborty et al. 2024).
The time evolution of the emission spectrum is displayed in Fig. 3 and covers a wavelength range of∼90 nm. The experimental spectra were normalized with respect to the highest intensity observed, for example, at 1.69 ms in the case exposed. A closer examination reveals that the blackbody contribution is minimal for times shorter than 1 ms. However, beyond 3 ms, the blackbody relative contribution becomes more significant. As illustrated in Fig. 4b, the blackbody contribution accounts for 40% of the highest signal observed at 1.69 ms. This behavior is intriguing and contrasts with our previous study on fullerene C60 (Chakraborty et al. 2024), where the blackbody contribution did not exceed 10% of the entire signal. In that case, the blackbody emission was due to the formation of various carbon clusters while in the case of coronene, contribution from carbon clusters and hydrocarbons is expected. This hypothesis is further discussed in Secs. 3.3–3.4.
The dynamics of the C2 emission can be extracted from OES data. As displayed on Fig. 5, the difference in signals at 516 and 520 nm, indicates that C2 is generated just behind the shock before fading out, while the continuum emission is significantly more extended.
Notably, our work enables an accurate determination of the gas temperature from the C2 emission spectra, providing improved precision compared to estimates derived from the Rankine-Hugoniot shock equations. We note that the gas temperature was found to be constant between 0.8 and 3 ms after which it began to fall (Fig. 4). Additionally, our study gives us direct access to the concentration of C2 which turns out to vary in the 1014– 2×10¹⁶ molecule cm−3 range. The higher limit, which corresponds to a mass fraction of 7% with respect to the coronene initial amount, is fully consistent with MD simulations (Sect. 4). The other spectral components are introduced hereafter in decreasing order of significance.
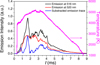 |
Fig. 5 Time-resolved optical emission from shock products recorded at 516 nm and 520 nm at 15 mm from the end flange with temperature derived from the pressure trace measurement considering an isentropic compression process T = c Pγ−1/γ with c a constant term. |
3.3 Blackbody-like emission component
Optical emission spectra systematically and clearly expose a broad continuum whose intensity slightly increases with longer wavelength (Fig. 4). We tentatively attribute it to two components, the first and more prominent one spanning hundreds of nm – from 400 nm and peaking beyond 650 nm, as observed in integrated OES measurements (300–650 nm). This continuum can be easily reproduced by a blackbody-like source and is assigned to the collective emission of carbon Cn and hydrocarbon CnHx clusters. The contribution of blackbody-like emitters varies throughout time, dependent upon the concentration of the large carbon-rich clusters. Section 4 can be referred to for more details on the formation of such clusters. Some arguments to support the claim that carbon clusters cause this emission were provided in our previous study (Chakraborty et al. 2024).
We discuss hereafter further observations that would lead to include as well hydrocarbon species to the pool of emitters. Additional shock experiments, performed with ethylene, corannulene, fullerene and a fullerene/hydrogen mix (Appendixes A and B), show that the ratio of the blackbody-like emission over the total emission reported at 516 nm, fB, markedly increases with the hydrocarbons H/C ratio, and the supply of hydrogen gas (Table B.1). For coronene C24H12, fB is about 0.62, more than four times higher than for fullerene C60 which is around 0.15. The addition of large amounts of hydrogen H2 to an initial mixture containing C60 at the level of H/C∼ 360 leads to almost a doubling of fB. These two findings suggest that the emitters contain hydrogen. No easy path to derive the exact amount of H which ends up in the emitters was found, however.
The blackbody-like emission fraction fB does not show a clear dependence with the number of carbon atoms of the sample as it increases going from ethylene to corannulene and coronene before dropping for fullerene. One of the more robust findings is that the incorporation of H strongly expands the variety of emitting species.
3.4 Green emission component
The spectra, displayed in Fig. 4 reveal another broad emission feature peaking in the 540–550 nm region and approximately 25 nm wide. This green component was estimated from the emission spectrum when other components were subtracted. At its maximum, it represents a significant fraction of the emission in the green, about the same as C2 and typically a third of the blackbody-like component. This green emission component was also observed in the optical signature of shock-products of PAHs such as corannulene C20H10, and hydrocarbons such as ethylene C2H4 (Fig. A.1). In the latter case, shock products, generated in the heating phase observed by OES, result from bottom-up chemical processes. But most importantly, this green component was not discerned in fullerene dissociation experiments while it showed up in mixtures of fullerene and hydrogen. In the former case, only blackbody radiation was seen and attributed to carbon clusters Cn as discussed in Sect. 3.3. We interpret this as a clear proof that the emitter contains C and H (Sect. 6.3). Notably the emission intensity of the green component in C60/H2 mixtures was found to be lower than that of PAHs (coronene and corannulene) and ethylene. This could be caused by the reduced presence of CnHx clusters. The molecular source of the broad component is challenging to ascertain with existing experimental techniques. Most likely hydrocarbon emitters are discussed in Sect. 6 with support from the results from MD simulations and the input from other laboratory works.
3.5 Minor contribution of CH
The CH radical has well-known emission features at 431 nm (A2∆–X2Π), 390 nm (B2Σ−–X2Π), and 314 nm (C2Σ+–X2Π) through some of which, it is commonly detected in combustion flames (Gaydon 2012) and in diffuse clouds. Noticeably, CH can be employed as a C-shock tracer (Xu & Li 2016). In our laboratory experiments, a weak CH emission feature was observed at 431 nm in the STS integrated spectra and in the time-resolved spectra. It is superimposed on a broad underlying continuum. The CH emission was observed through time-resolved spectra just behind the shockwave for a millisecond or so, then overshadowed by the underlying blackbody continuum. MD simulations, discussed in Sect. 4, also indicate the presence of CH species in smaller quantities at temperatures above 3500 K. CH fragments arise either from CH-loss in intermediate species or from the reaction of H atoms with C2 ejected during coronene dissociation. Although DFT calculations show CH-loss is a minor pathway compared to H-loss, it can become competitive at higher internal energies (Panchagnula et al. 2024). The faintness of the emission feature prevents us to investigate its time dependence. A recent study by Sundararajan et al. (2024) shows the presence of other dissociation channels (e.g., CH loss) in the case of PAHs containing pentagonal rings.
3.6 Absence of C3 emission
One of the surprising findings of this current study is the absence of C3 emission. C3 has been detected in many astrophysical objects including comets in visible emission, circumstellar shells of carbon-rich stars by IR measurements (Hinkle et al. 1988) and dense interstellar clouds in the millimeter-wave region (Cernicharo et al. 2000). C3 has been identified in the laboratory, along with C2, for instance, in carbon plasmas (Nemes et al. 2007) through its Swings bands at 405.1 nm which correspond to transitions in the  system. Notably the oscillator strength for this transition is similar to the d3Πg–a3Πu transition for C2 (Fairbairn 1966; Rousselot et al. 2001).
MD simulations, detailed in Sect. 4, predict the formation of C3 behind the shock. They point to a significant production of C3 above 3500 K mostly generated through the dissociation of larger Cn or CnH fragments. This is in line with collision induced dissociation (CID) and photodissociation studies which found that C3 is an important fragment of carbon chain and ring targets (von Helden et al. 1993, and references therein).
Several leads have been explored that could explain the absence of C3 emission ; not to be confused with the absence of C3. The first avenue examined relates to collisional relaxation. The compressed reaction zone behind the reflected shock wave contains vaporized PAHs and rare gas atoms at high temperatures (∼4000 K) and pressure (∼30 bar), in contrast to various previous C3 spectroscopic investigations that were generally performed at lower temperatures and pressures. Laser-induced fluorescence (LIF) studies demonstrated that the population of the A1Πu state can drop considerably due to collisions with surrounding rare gas atoms (Sasaki et al. 2002). This is not the case for C2 which seems much more immune to collisional quenching, although the pressure range explored remains limited. The current experimental conditions therefore support a major role played by collisional quenching, leading to a reduction in the strength of C3 emission signal. Secondly, the triatomic nature of C3, compared to diatomic C2, leads to an increased number of potential energy levels for electron occupancy, hence resulting in a greater dilution between states. Additionally, C3 could be generated in one of the triplet states, either in an a3Πu or b3Πg excited state. The duration for spin-forbidden decay to the ground state is 20 ms (Weltner & McLeod 1964), much larger than the emission timescale accessible in the experiment. The combination of all these findings provide a reasonable explanation to the intriguing absence of the spectral signature of C3 (von Helden et al. 1993).
3.7 Elusive C2H contribution
The ethynyl radical, C2H plays a crucial role in the carbon chemistry of astrophysical environments. It can also serve as a proxy for C2, which is undetectable in the millimeter wave frequency range due to the absence of a permanent electric dipole moment (Schmidt & Ziurys 2017). Besides, the ethynyl radical C2H is a key intermediate in various combustion relevant reactions, including pyrolysis and oxidation processes of hydrocarbons, and is an important intermediate of the thermal decomposition of acetylene at elevated temperatures. It plays a key role in the formation and destruction of carbon compounds, including carbon chain molecules CnH as demonstrated by reaction mechanisms identified during the pyrolysis of acetylene (Kiefer et al. 1992; Kruse & Roth 1997). Dispersed fluorescence spectra (continuum emission) of the A2Π– X2Σ+ system of the C2H radical within the wavelength range of 400 to 750 nm have been measured in acetylene pyrolysis experiments (Boyé et al. 2002).
MD simulations of coronene breakdown behind the shock, fully detailed in Sect. 4, suggest that C2H species are produced in significant quantities, comparatively to C2 at temperatures below 3000 K. Despite the expected presence of C2H, its emission signature is not observed. The most likely hypothesis is that the C2H broad features cannot be distinguished in the laboratory experiments because of other underlying constituents in the observable window (500–570 nm) at elevated shock-tube temperature and pressure. Because of the lack of oscillator strength values, we were unable to provide an upper limit relative to C2.
4 Molecular dynamics simulations
In order to decipher isomerization reactions and dissociation processes undergone by PAHs in different charge states after either photon absorption or collision, a number of theoretical studies have been previously carried out in synergy with experiments (see, e.g., Simon & Rapacioli 2018). In the present work, MD simulations of the dissociation of C24H12 were performed to help in the interpretation of the results and to gain some insights into the key dynamical processes. They were run on-the-fly using a DFTB potential (Porezag et al. 1995). Previous works using a similar approach were performed to investigate PAH dissociation (Simon et al. 2017, Simon et al. 2018; Rapacioli et al. 2018; Banhatti et al. 2022). In these works, extensive MD simulations with the electronic structure described at the self-consistent-charge density functional tight binding level of theory (Elstner et al. 1998) (MD/SCC-DFTB) were run, with a time limitation of one nanosecond. Branching ratios and dissociation rates as a function of energy were obtained, leading to a satisfactory agreement with experimental results (Simon et al. 2017). MD/SCC-DFTB simulations were also used to decipher unimolecular dissociation mechanisms (Banhatti et al. 2022) and to interpret and complement CID experiments for energetic H+ colliding with pyrene C16H10, allowing us to reproduce most features of the mass spectrum (Simon et al. 2018). Loss of H was shown to occur at short times (a few picoseconds) while formation of small carbon clusters was observed at longer times (Simon et al. 2018).
We used a similar approach as in Chakraborty et al. (2024). Born-Oppenheimer molecular dynamics (BOMD) simulations with a DFTB potential (Porezag et al. 1995) were run in the canonical ensemble. On-the-fly simulations were run up to 12 ns with a computation of the DFTB energy and gradient every 0.2 fs, for temperatures ranging from 2500 to 4000 K with a step of 250 K. A Stochastic Velocity-Rescaling thermostat (Bussi et al. 2007) with a relaxation time τ of 100 ps was used. We are aware that this relaxation time is an upper limit of all considered clusters. Smaller values for τ were also tested (50 and 10 ps) for the pool of simulations at 3500 K. In order to model confinement effects, a repulsive rigid spherical potential centered on the cluster center of mass was added (r0 = 60 Å ). The influence of r0 on the simulation results was investigated increasing this radius to 2r0 and 3r0 (120 and 180 Å ) for the 3500 K case. For a given temperature, a set of 36 simulations with random velocities were run and the fragment size distributions were analyzed as a function of time. The stoichiometries of the fragments were retrieved every 100 ps. Convergence is not expected to be reached with only 36 simulations but trends are provided. All simulations were performed with the deMonNano code (Rapacioli et al. 2023).
The mass fraction contents of the different fragments as a function of time are reported in Fig. 6. At 2500 K, the fragmentation efficiency is limited as 61% of coronene remain. At 12 ns, H2, expected as a ‘statistical fragment’ represents 0.38% mass. The small fragments are C2 (1.9% mass), C2H (0.67% mass), and C4H (0.45% mass). Molecular hydrogen H2 is the first released fragment at ∼2 ns. After 3.5 ns, C2H and C2 are released along with C2H2 and C4H. A hydrogen atom H occasionally appears but quickly recombines, as well as CH and CH2. Regarding large clusters, the formation of C24Hx (x=8, 10), C22Hx (x=6, 7, 9, 10, 11), and C20Hx (x=5, 8) clusters is observed. C24H10 is the most abundant large fragment at 12 ns (11% mass).
The fragmentation process becomes significantly more efficient at 3000 K. After 5.1 ns, the disappearance of all coronene is observed, and C18 is identified as the largest fragment at 12 ns. At the end of the simulations, C2Hx (x=0–2) are the major carbonaceous fragments with C2H as the most abundant (11% mass). They are followed by C5Hx (x=0–2), C5 being the most abundant (8.9% mass) of the series, and by C7Hx (x=0–2), C7 being the major species of the series (6.3% mass). The other small carbon clusters with an even number of atoms are less abundant. This odd/even alternation seems consistent with the fact that odd-numbered clusters (up to C7) are more energetically stable than the adjacent even-numbered clusters (Raghavachari & Binkley 1987). As a consequence, a series of larger carbon clusters, CnHx (n=8–18, x=0–3), are also formed. The CHx fragments (x=1–3, and mostly CH3) also appear occasionally but rapidly fade out.
At 3500 K, C15 is the largest fragment at 12 ns while C3 and C5 became the most abundant with 16% mass and 14% mass respectively. Above 3500 K, further increase in T up to 4000 K, did not alter the major fragments. For T higher than 3500 K, H and C atoms, as well as CH radical were produced. At 4000 K, the largest carbon fragment at 12 ns was found to be C9.
An illustration of the formation kinetics at 4000 K for some pathways of interest can be found in Fig. D.1. Molecular hydrogen starts forming within a few hundred picoseconds and continues increasing until reaching a plateau. Acetylene C2H2 also starts forming within a few hundred picoseconds. Its mass ratio reaches a maximum and then decreases. The same trend is observed for C2H which forms in larger amount. Its mass fraction reaches a maximum at 1.6 ns that then decreases to reach a plateau of ∼7% mass. The amount of C2 keeps increasing to reach a plateau of about 10% mass. C3 forms after 1 ns. Its mass fraction increases rapidly up to about 8 ns and then reaches a plateau of about 30% mass. CH is found in lower abundance but also reaches a plateau of 5% mass.
Tricarbon C3 is present in the simulations and becomes more abundant than C2 at 3500 K although it is not observed in the experiments. A deeper insight into a selection of simulations shows that the formation of C3 is not direct: it comes from the dissociation of larger Cn or CnH fragments previously formed after dissociation and recombination steps. Conversely, C2 can be formed by direct dissociation. It is illustrated by their kinetics at 3500 K. The mass fraction of C2 reached quickly its maximum at ∼1.6 ns while the increase of C3 fraction was much slower, reaching its equilibrium value at about 8 ns.
Interestingly, increasing the confinement radius has hardly any influence on C2 mass fraction kinetics and equilibrium value. On the other hand, the formation of C3 is considerably delayed and its mass fraction at 12 ns, reaching 16% with r0, decreased to 5% when 3r0 is applied. Confinement thus clearly favors the formation of C3. These results further illustrate that the formation of C3 is indirect, resulting from sequential dissociation/recombination elementary steps. Regarding the hydrogenated fragments, the C2H mass fraction at 12 ns increases from 7 to 15% when doubling r0. At 12 ns, the C3H mass fraction also tends to increase with r0 (5, 6 and 9%). It then underlines that confinement clearly favors the destruction of these small hydrogenated fragments. The results of the MD simulations show that the dissociation of coronene leads to the formation of a variety of size distribution of hydrocarbons, depending on temperature, mainly through a top-down process.
In order to acquire a deeper understanding of the mechanisms at play, we also investigated the possibility of forming hydrocarbons through a bottom-up process, starting from ethylene C2H4. MD/DFTB simulations were then performed for an ethylene gas in similar conditions, that is to say 12 ethylene molecules in a sphere (r0=60 Å) with a relaxation time of 100 ps; at 4000 K. The final distribution of clusters at 12 ns resembles that of coronene with the formation of Cn and CnH clusters with n = 2, 3, 5, and 7 in particular. Shocked ethylene tends to slightly favor the production of hydrogenated clusters CnH with respect to coronene. This is likely due to the original excess of H atoms in the case of ethylene. This trend is enhanced when the relaxation time is decreased down to 50 ps. With this value, the populations of C5H and C7H dominate the “large clusters population” with 11% and 5% mass fraction, respectively. All MD results presented and discussed in this section are reported in the Zenodo database, DOI : 10.5281/zenodo.15057193.
5 Ex situ analysis of solid residues
The ex situ analysis was carried out by examining the solid residues remaining after shock experiments, with samples collected following each run at the specified gas temperature Tg. Immediately after the shock, the valve of the sample chamber was mechanically closed, this tube section carefully vented, and eventually opened. The residual solid material was brushed onto aluminum foil from the end flange surface and the adjacent inner surface of the sample chamber. The collected residues were subsequently characterized using X-ray diffraction (XRD), high resolution transmission electron microscopy (HRTEM), Raman spectroscopy, IR microspectroscopy, and laser desorption laser ionization mass spectrometry (L2MS). These techniques provide complementary information that helps elucidate the physical and chemical mechanisms underlying shock processing.
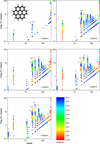 |
Fig. 6 MD simulations of the dissociation of coronene in the canonical approximation. The thermalization time was set to 100 ps. The confinement effects were simulated by implementing a repulsive spherical wall with a 60 Å radius. |
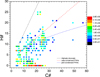 |
Fig. 7 Laser desorption laser ionization mass spectrometry analysis of solid residues from the coronene sample exposed to a shock wave at T = 3500 K estimated from integrated emission spectroscopic measurements. The diagram displaying the number of hydrogens (H#) vs. the number of carbons (C#) is color-coded for mass peak signals (log scale). |
5.1 Laser desorption laser ionization mass spectrometry
Solid residues were analyzed using the AROMA setup (Astro-chemistry Research of Organics with a Molecular Analyzer) fully described by Sabbah et al. (2017). AROMA allows us to probe the composition of PAHs, hydrogenated carbon clusters, carbon clusters, and fullerenes in complex samples such as meteorites and cosmic dust analogs. It includes a two-step laser desorption laser ionization scheme combined with an ion-trap and a high-resolution (m/∆m ∼ 104) time-of-flight mass spectrometer. In the first step, a pulsed (5 ns) near-IR laser (Nd:YAG at 1064 nm) is focused on the sample with a spot size of 300 µm to cause rapid and localized heating. This favors thermal desorption over decomposition. In the second step, a pulsed UV laser (Nd:YAG laser fourth harmonic output at 266 nm) perpendicularly intercepts the expanding plume of the desorbed molecules after 0.2–1.4 µs and ionizes the aromatic molecules by (1+1) resonance-enhanced multiphoton ionization.
The L2MS mass spectrum is dominated by peaks corresponding to bare carbon clusters and PAHs with mass-to-charge ratios (m/z) below 300. A few PAH species with m/z values higher than that of coronene are also detected, suggesting that chemical growth beyond coronene may occur. However, these heavier PAHs exhibit only weak signals. Each detected molecule was identified by its chemical formula, and a hydrogen number (H#) versus carbon number (C#) diagram was then constructed (Fig. 7). This analysis revealed that the sample is primarily composed of carbon clusters and PAHs with C# ≤ 24, which dominate over the other carbonaceous species identified. More specifically, the H# versus C# diagram is dominated by a distribution of carbon clusters ranging from C10 to C24, each exhibiting relatively high individual signal intensities. In addition, the diagram shows a substantial population of PAHs, mostly pericondensed structures with C# < 24, as well as hydrogenated carbon clusters. As detailed by Cain et al. (2014), empirical boundaries were established to classify hydrocarbon groups based on their hydrogen-to-carbon (H/C) ratios. These limits separate aliphatics and aromatics (H = 1.25C + 2.5), cata-condensed PAHs – noncompact structures in which no more than two rings share a single carbon atom (H = 0.5C + 3), and peri-condensed PAHs – compact structures in which three or more rings share carbon atoms  . The ratio of the combined signal from all C24Hx species, where 8 ≤ x ≤ 14, to the total detected signal is 6.5%, suggesting that most of the original material underwent shock processing. An overall H/C ratio of 0.29 is obtained by integrating the abundances of all detected species. These results provide clear evidence of the carbonization of coronene when exposed to a shock wave. The products of this shock processing differ significantly from those resulting from UV photodissociation (see Fig. E.1), highlighting that shock-induced processing is a two-step mechanism: first, the initial molecule is broken apart by a high-energy input; then, during the subsequent cooling phase, new chemistry is initiated via the recombination of molecular fragments.
To shed some more light on the processes at play, we compare the present findings with results from our initial study on the shock-wave processing of C60 in hydrogen (Biennier et al. 2017) and from complementary L2MS data (Fig. F.1). The L2MS mass spectrum of post shock products from fullerene/H2 mixture highlights the presence of two broad groups. The first one dominates and regroups carbon clusters, almost bare, with 50<C#<125, while the second one is dominated by carbon-rich species with C#<30 and a slightly higher hydrogen-to-carbon ratio, but still orders of magnitude less than that of the PAH sample mentioned above. The examination of post-shock gaseous mixtures via gas chromatography confirmed the production of methane (CH4), ethylene (C2H4), acetylene (C2H2), and ethane (C2H6). The solid residues are made up almost solely of pure carbon material, unlike what is observed for coronene. Notably, by contrast to these results, the coronene post-shock volatiles analyzed using gas chromatography did not reveal the formation of such small stable hydrocarbons. One can hypothesize that the intermediate size hydrocarbons CnHx, with n ≥5 and depleted in hydrogen, revealed behind the shock by OES measurements, likely lost the remaining hydrogen during the cooling phase which can last twice the dwell time, that is, ∼4–6 ms.
5.2 IR microspectroscopy
IR spectra were recorded on ex situ extracts, flattened sample using a Nicolet infrared microscope. Typical recorded transmittance spectra are shown in Fig. 8. The spectra display a progressive loss of the molecular vibrational bands when Tg increases, indicative of the formation of a macromolecular C-rich material, and the rise of a strong continuum induced by the progressive formation of a zero gap material which is consistent with the structures formed observed during electron microscopy measurements. Only a few percent of initial coronene appears to have escaped the shock transformation at 1900 K, whereas the conversion is almost complete at 4300 K.
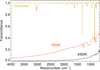 |
Fig. 8 Infrared transmittance spectra of the pristine sample (coronene) and shocked coronene at Tg = 1900 K and 4300 K. |
5.3 Raman spectroscopy
Raman spectra were recorded on ex situ extracts, using a DXR Nicolet Raman microscope with a 532 nm laser on the SMIS beam line at the synchrotron SOLEIL. Tens of spectra with ten seconds of acquisition, using the long distance ×100 magnification objective, were taken per sample spot recorded, with a typical laser power set to a few mW at most, to avoid sample heating, and the spectra scanned over a few microns square region were averaged. A selection of spectra is shown in Fig. 9. The spectra are reminiscent of the production of disordered carbon particles (Ferrari & Robertson 2000; Sadezky et al. 2005) at the lowest Tg of 1900 and 2300 K. Some sharper features for Tg=1900 K can be attributed to polyaromatic molecular moieties incorporated in this carbon disordered structure. As the temperature increases, the bands become narrower, reminiscent of a progressively more ordered system, close to graphitic. The First order Raman spectra show the D1, G and D2 bands, which are characteristic of graphite basal and edge planes (e.g., Rodrigues et al. 2013). The D1 to G band ratio seems to depend on the temperature, indicating that ordering evolve with this parameter. The high Tg second-order Raman spectra also correspond to highly ordered carbon particles.
5.4 X-ray diffraction
The powder XRD patterns of pristine and shock-processed C24H12 were recorded using Cu Kα radiation (PANalytical) over a 2θ range of 5◦–90◦ (Fig. 10). Pristine coronene exhibits distinct sharp diffraction peaks, indicative of a highly ordered molecular arrangement and confirming its remarkable crystallinity. Upon exposure to a shock wave in Ar (Tg = 3400 K), the intensity of all diffraction peaks decreases significantly. The resulting XRD pattern features a broad, weak peak around 25◦, corresponding to the (002) reflection of aromatic layers, and a barely discernible peak near 43◦, assigned to the (100) reflection. The (002) peak arises from the stacking orientation of aromatic carbon layers, while the (100) peak relates to the in-plane dimensions of the condensed aromatic domains. A sharper and narrower (002) peak suggests a greater orientation of aromatic layers; similarly, a sharper (100) peak indicates larger aromatic domains (Qiu et al. 2019).
Structural parameters including the interlayer spacing (d002), graphitization degree (g), and crystallite size (Lc) were estimated using Bragg’s law, and the Franklin equation,
 (1)
(1)
Here, κ is the Scherrer constant, β is the full width at half maximum (FWHM) of the diffraction peak, and θ002 is the Bragg angle of the (002) reflection. For the shock-processed sample, the calculated values are: d002 = 3.4 Å, g = 0.757, Lc = 1.4 Å, and d001 = 2.1 Å. These results suggest the formation of nanoscale graphitic structures, indicating partial graphitization of the material. The X-ray diffraction parameter d002 is widely employed as a tracer of the structural state of natural carbons (Vlahov 2021). While missing for purely amorphous carbon, a very wide and diffuse peak at about 3.5 Å is observed for coal and asphalt, a diffuse peak at about 3.43 Å for structurally disordered graphite, and finally a sharp peak at 3.36 Å for crystalline graphite. Further insight into the morphology and compositional variation of the shock products was obtained through electron microscopy. Additional peaks observed at 38.3◦ and 44.6◦ were attributed to aluminum contamination from the ruptured diaphragm.
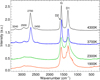 |
Fig. 9 Raman spectra of solid residues of shocked coronene at temperatures Tg covering the 1900 K to 4300 K range. |
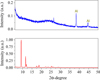 |
Fig. 10 X-ray diffraction spectra of pristine (bottom) and shock-processed (top) coronene. |
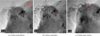 |
Fig. 11 HRTEM imaging of shocked coronene at Tg= 4370 K showing carbon nanoribbons, nanotubes, and nano-onions. The red rectangle indicates the area in which the spacing d was measured. The magnified view of the red area and interplanar spacing calculation are displayed in Fig. G.2. |
5.5 High-resolution transmission electron microscopy
HRTEM was employed to investigate the crystalline and amorphous features of the samples at the nanometer scale. Imaging was performed using a Tecnai T20-ST microscope operating at 200 kV. Samples were prepared from dilute suspensions of coronene powder (pristine and post-shock) by sonicating in ethanol for 30 min and drop-casting onto separate carbon-coated copper TEM grids. Bright-field TEM images and selected area electron diffraction (SAED) patterns of the unexposed coronene reveal agglomerated fibrous structures (Fig. G.1). In the shock-exposed samples, HRTEM discloses lattice fringes with a spacing of d002 = 3.56 Å, consistent with graphitic planes also indicated by XRD analysis. The SAED pattern of the shocked material exhibits diffuse, symmetric rings corresponding to graphitic spacings corroborated by the broad XRD peak.
Carbon nano-onions, or multilayer fullerenes (Ugarte 1995), were identified as quasi-spherical or polyhedral structures ranging from 10 to 150 nm calculated from Fig. G.1 and consisting of concentric graphitic shells (Mykhailiv et al. 2017). Nanoribbons and nanotubes were also observed, with interlayer distances of approximately 3.6 Å (highlighted in red rectangles in Fig. 11). Nanoribbons are flat and continuous one-dimensional strips of carbon atoms (graphene layers), while carbon nanotubes possess a tubular configuration with only a few graphene layers (Jiao et al. 2009). Note that the d002 parameter of around 3.4–3.6 Å derived from the analysis of the HRTEM images, is common to all three structures. These findings are supported by theoretical studies conducted by Kit et al. (2012), which demonstrated the formation of nanotubes through the twisting of graphene nanoribbons. Thermally induced self-intertwining of graphene nanoribbons facilitates the synthesis of carbon nanotubes (Lim et al. 2013).
6 Discussion
The ex situ and in situ analyses supported by MD simulations were employed to sketch a global scenario of the experimental processing of coronene behind the shock. Our current understanding of the initial steps is that the incident shockwave dispersed the coronene fine powder deposited onto the plate holder and mixed it with the gas. The sudden rise in the gas temperature behind the shock led to a rapid increase of the internal energy of the microcrystals. Individual coronene molecules could then overcome intermolecular forces that weakly bind them, leading to sublimation. The large number of collisions with the argon bath gas ensured rapid thermalization on a timescale close to tens of microseconds. The high internal energy of coronene achieved behind the reflected shock triggerd its breakdown. Strong dehydrogenation and generation of hydrocarbons and carbon clusters followed. When the gas cooled, the shock fragments chemically recombined, leading to the formation of carbon nanostructures.
6.1 Onset of breakdown: Major loss of hydrogen
The fundamental mechanisms of coronene dissociation and the routes that dictate the dynamics, as well as the observation of distinct emission components, were investigated with a great diversity of methods. However, the interpretation also benefited from additional experiments on the thermal processing of PAHs, ethylene, and C60 with hydrogen, which all exhibit a wider variety of pathways than that of C60 alone, due to the presence of hydrogen. Major routes include H, H2, and C2Hx ejection and their subsequent recombination with other radicals thereby propagating chain reactions alongside possible low energy barrier hydrogen abstraction reactions.
One major finding of this work is that the loss of hydrogen plays a pivotal role in coronene dissociation. The dehydrogenation mechanism for PAHs involves unimolecular dissociation at high internal energy, as a result of shock heating. It is understood that, for the internal energy of coronene reached behind the shock, C-H cleavage is favored over C=C cleavage due to lower energy barrier. The simulations confirm an extensive dehydrogenation with almost all hydrogen ending up in H2, for instance, close to the maximum mass fraction of 4%, above the temperature of 3500 K. Loss of H is also observed for T ≥ 3500 K but remains a minor exit channel.
The abundant loss of H2 observed in our work is consistent with the previous study by Chen et al. (2015) who showed that loss of H2 from unimolecular dissociation of PAHs becomes efficient for internal PAH temperature higher than 2200 K for any PAH size and excitation process. Regarding the precise mechanism leading to H2 loss, which cannot be deciphered with our MD procedure, theoretical studies demonstrated that a first hydrogen atom migrates at the edge of the PAH through a roaming process (Chen et al. 2015; Castellanos et al. 2018), to attach another carbon atom and form a -CH2 aliphatic group from which H2 is further removed.
6.2 Medium-size hydrocarbons, carbon clusters, and blackbody-like emission
The emission spectra resulting from the shock processing of PAHs and fullerenes, are primarily characterized by the C2 signature, accompanied by a broad underlying continuum in the UV-visible region. The continuum is assigned to two distinct components. The most intense one, in terms of integrated visible flux, covers a spectral range of hundreds of nanometers (Fig. C.1) with blackbody-like behavior and is attributed to medium-size carbon clusters, of the Cn and CnHx type. The blackbody-like character of the broad component results from the collective emission of a huge number of molecular species and isomers, whose individual contributions add up and cause specific features to disappear. Obtaining a large number of isomers requires large species. This is a critical point.
The ratio of blackbody-like to C2 emissions observed in shock-processed PAHs and ethylene via OES is significantly higher than that for C60 (Fig. A.1). This lends credence to the hypothesis of a second family of emitters of the CnHx type, in addition to the first family of emitters that gathers large carbon clusters Cn (Chakraborty et al. 2024). Although C2 emission is observed in fullerene and PAH runs, there are some specifics in the mechanisms ejecting the first C2 units, which are worth examining.
The rapid-heating phase of the shock-induced processing shares some similarities with UV-driven photodissociation. The excitation energy in a molecule, acquired by photon absorption, is in most cases completely randomized in all its vibrational modes before it is decomposed, and a statistical theory can be used to adequately describe the dissociation dynamics. Disparities between photon excitation and collisions emerge primarily at the thresholds of dissociation, ionization, and rearrangement. A few other differences can be also underlined. First, for shocks, the internal energy of the parent, provided by incessant collisions with the bath gas can be quite high, for instance, a few tens of electron-volts for coronene at 4000 K as detailed later (Sect. 6.3). This is well above Ly-α single-photon energy provided by hydrogen lamps but similar to the energy that can be reached in infrared multiphoton excitation schemes, based on the use of free electron lasers, for example (Oomens et al. 2001). Second, the high internal energy of the reactants, and products, behind the shock is maintained for a few milliseconds to be compared to nanoseconds in case of pulsed irradiation. Shock-induced decomposition is therefore expected to be rather extensive behind the shock wave in the laboratory, hence drastically compressing the astrophysical timescales.
Early ion-trap photodissociation studies of compact PAHs showed that the bare  carbon cluster emerges as the predominant component following complete dehydrogenation of
  but also of the less compact species naphtho[2,3-a]pyrene
  (Ekern et al. 1998). Jones & Seifert (1997) performed calculations of possible isomers of the coronene skeleton C24 and found that closed cage fullerene, and a bicyclic structure containing two rings of 14 and 10 carbon atoms, exhibited the highest thermodynamic stability. When all hydrogen atoms are gone, further breakdown proceeds via elimination of C2 and Cn units. This is consistent with the findings of Joblin (2003), who observed that
  dominates the photodissociation mass spectra of the coronene cation (Fig. E.1), using a cryogenic ion trap free from water vapor and H2 contamination, and starting from the isotopically pure 12C coronene precursor.
MD simulations of high-temperature processing (T=4000 K) of C24H12 point to a product distribution starting around 10 carbon atoms and decreasing. However, these simulations do not account for radiative cooling. By incorporating energy dissipation pathways, the calculated lifetime and stability of the fragments are anticipated to increase. As a result, the fragmentation snapshots obtained from these simulations depict extreme dissociation. When radiative cooling is considered, the size distribution of carbon clusters emitters should shift toward larger fragments.
One of a key finding of OES complementary experiments is that the blackbody-like emission is also observed in the case of shocked ethylene as a precursor (Fig. A.1). Supporting MD simulations show that high-temperature processing of ethylene C2H4 leads, through bottom-up synthesis this time, to the formation of a variety of hydrocarbons with fewer than ten carbon atoms. The structureless character of this broad emission implies the spectral participation of a high number of isomers as recalled earlier. Consequently, the higher end of the hydrocarbon distribution is expected to be the major contributor.
Our interpretation is that medium-size Cn clusters and CnHx hydrocarbons are formed behind the shock and cause the blackbody-like emission. Cross-analysis suggests a distribution around 10 carbon atoms with odd-numbered species favored. These products may be formed via three possible pathways: by complete dehydrogenation and then fragmentation of the bare carbon cluster C24, from the fragmentation of the partially hydrogenated clusters C24Hx, but also from the recombination of hot fragments, in particular with C2, C2H and C2H2 according to MD simulations (Fig. D.1). Reactivity with atomic H plays a small role, as its abundance slightly decreases with time. As expected, molecular hydrogen, when it is formed, becomes mostly unreactive at the temperatures explored in this work.
6.3 Small hydrocarbons and green emission
Small hydrocarbons CnHx are considered good candidates for the broad emission that peaks at the wavelength of 540–550 nm. Time-resolved measurements suggest that the carriers start to emit early, similarly to the blackbody-like emitters, with their abundance first rising, indicating a rise in concentration during shock processing, before the gradual decline in emission as the temperature decreases.
The internal energy of reactants and products behind the shock wave can reach very high values, well above the ionization potential of the molecular species, for instance, 28.5 eV at 4000 K for coronene (Chen et al. 2020). At this high temperature, fragmentation is expected to dominate over thermoionization for carbon clusters (Lacinbala et al. 2022). Consequently, our discussion concerning possible emitters will be limited to neutral hydrocarbon species.
Although the broad emission characteristics and the variety of smaller species, coupled with experimental high-temperature and pressure conditions, limit the accurate assessment of the size of the emitters. We try below to provide some constraints.
Previous research on CnHx hydrocarbons with n<10 indicates that neutral species have low-energy linear geometries (Van Orden & Saykally 1998). In the case of bare carbon clusters (x=0), odd-numbered Cn (such as C3, C5, C7…) have cumulenic-type bonding, which is less reactive than the even-numbered polyyne-type structures (C4, C6, C8). The degree of hydrogenation depends on the reactivity of the chains. The incorporation of hydrogen at the two highly reactive terminals of polyyne-type chains leads to the generation of CnH2 clusters (Postma et al. 2009). In MD simulations, the formation of odd-numbered carbon clusters, C3, C5, and C7, prevails over that of their even-numbered counterparts, C4, C6, and C8, suggesting a reduced prevalence of small groups with an even number of carbon atoms (see Sect. 4). MD simulations for ethylene at 4000 K show a similar picture where the odd C3Hx, C5Hx, and C7Hx, with x=0–4 dominate the smaller hydrocarbon distribution, although the formation mechanisms of intermediate-mass species for PAHs and ethylene are fundamentally different, that is, (mostly) top-down versus bottom-up pathways.
Recent experiments can be very helpful to consolidate the ‘dehydrogenated small hydrocarbons’ hypothesis. The study by Huo et al. (2023) on soft X-ray photofragmentation of the coronene cation shows that  species dominate the mass spectra, with a major branching into
  , followed by
  and
and  . Studies on the collision of coronene with protons of energy in the 75–300 keV range also concur that
  and
and  are the most abundant fragments in the low-mass region (Singh et al. 2024). Investigation of keV collisions of multiply charged ions (He2+, O3+, and Xe20+) with coronene and pyrene, highlights the formation of tiny CnHx units characteristic of linear-chain molecules (Ławicki et al. 2011).
L2MS measurements, which analyze the molecular content of the post-shock solid residue, show that only weakly hydrogenated carbon clusters CnHx (x=1–3) remain – as illustrated by the bottom left part of Fig. 7 – with the exception of slightly altered leftovers of the initial material (23 ≤ n ≤ 25). The findings are consistent with previous observations, although L2MS probes the end products that trace the entire process, including the rapid-heating and cooling phases.
From all the above considerations, we can conjecture that the green emission observed in our experiments likely originates from CnHx hydrocarbons with n =3–9, odd-numbered n being more predominant, and with x=1–3.
6.4 The road to nanostructures
Recorded pressure traces displayed with emission intensity profiles (Fig. 5) indicate that shock products are formed and remain at elevated temperatures, above 4000 K, for several milliseconds prior to condensation induced by the cooler expansion fan. The creation of carbon-rich, hydrogen-poor nanoparticles occurs during the cooling phase, as temperature and pressure decline from 4000 K and 30 bar to ambient conditions within ∼5–6 ms. The confined nature of the shocked region and the strong thermodynamic gradients play a critical role in the nucleation and growth of the solid phase, distinguishing this process from chemical vapor deposition, pyrolysis, or laser ablation methods.
As emphasized above, PAHs first undergo rapid dehydrogenation and fragmentation behind the shock, producing a variety of small hydrocarbons and carbon clusters. Gas chromatography analysis confirms a pathway involving hydrogen loss and isomerization, forming reactive carbon units. The fragmentation is extensive under canonical ensemble conditions (thermalized, high-pressure), underscoring that continuous energy input via collisions is essential.
Although the details remain uncertain, the hot condensation sequence (above 2000 K) is likely driven by hydrogen abstraction–acetylene addition (HACA), and radical radical reactions (RRR) (Kaiser & Hansen 2021), which can build-up cycles and eventually evolve into more stable carbonaceous materials, displaying structural features similar to those produced in gas-phase condensation experiments at temperatures in the 500–2000 K range. The L2MS mass spectrum provides molecular-level insight into the cooling phase, revealing bare carbon clusters and hydrogenated carbons, predominantly peri-condensed PAHs. A few products exhibit m/z values exceeding slightly that of coronene, indicating condensation and chemical growth. The absence of C60 in L2MS spectra suggests a multiphase residue comprising intermediate-size carbon clusters that are easily desorbed, alongside more stable or embedded structures – such as nanometer-size particles or trapped fullerenes – that resist gas-phase detection.
XRD analysis of the post-shock residue reveals nanoscale carbonaceous particles with partial graphitic character. HRTEM imaging confirms the presence of diverse nanostructures—carbon nanotubes, nanoribbons, and carbon onions. Among these, polyhedral carbon onions dominate. They exhibit concentric graphitic layers with interlayer spacing of 3.5 Å matching the (002) graphite plane, indicating a high degree of structural order.
According to prior studies on high-temperature soot transformation (Pathak et al. 2022), the polyhedral morphology implies formation temperatures exceeding 2400 K, consistent with the elevated thermal conditions prevailing in the onset of the post-shock cooling phase. The formation pathways of these nanostructures share similarities with laser ablation methods, where a carbon-rich plume created by laser-induced vaporization of a graphite target cools and condenses into nanostructures. Graphene-like fragments generated in such plumes may either roll into nanotubes or curl into fullerenes via pentagonal defect formation. Further carbon accretion can lead to the development of carbon onions through self-assembly into concentric shells (Jäger et al. 2009). Likewise, high-temperature laser pyrolysis of hydrocarbons such as C2H2, C2H4, and C6H6 has been shown to yield fullerene-like soot and nanostructures at temperatures above 3500 K (Jäger et al. 2009). In both cases, the process is marked by strong dehydrogenation.
In shock experiments, the sustained high density for milliseconds and the strong pressure gradient promote annealing and ordering, enhancing graphitic character and reducing structural defects. The addition of molecular hydrogen to the buffer gas does not alter the final products, indicating that hydrogen incorporation into the final structures is negligible.
7 Astrophysical implications
7.1 Shock-driven PAH dehydrogenation and hydrocarbon
Our study corroborates the view that coronene – and by extension other medium-sized PAHs – undergo strong dehydrogenation under shock conditions. This dehydrogenation process is accompanied by the formation of H2 in contrast to the sequential atomic H loss observed in UV-driven PAH fragmentation (Montillaud et al. 2013; Marciniak et al. 2021).
MD simulations, OES measurements, and L2MS analysis show that shock processing at high velocities also efficiently produces a wide variety of carbonaceous fragments, including hydrogen-poor hydrocarbons and carbon clusters. For a given internal energy, strong resemblances with photodissociation studies are predicted. UV processing of small carbonaceous grains and PAHs has been proposed as a top-down mechanism explaining the observed concentrations of hydrocarbons, such as C2H and c-C3H2, in the outer layers of photon-dominated regions exposed to low UV flux (Pety et al. 2005; Guzmán et al. 2015). Astrochemical modeling by Awad & Viti (2022) confirmed that UV degradation efficiently produces small hydrocarbons such as CH, C2H, and linear and cyclic isomers of C3H2 in diffuse clouds. Goicoechea et al. (2025) concluded that bottom-up and top-down mechanisms apparently both link simple hydrocarbons with PAHs in molecular clouds; nevertheless, the exact chemical pathways and their relative contributions remain unquantified.
Compared to UV-induced photoprocessing, shocks can deliver higher internal energies, often exceeding the fragmentation thresholds of PAHs. This should result in enhanced formation of CnHx species, which may contribute to observed interstellar hydrocarbon abundances.
The chemical environment in shocked regions further differs from that in UV-irradiated zones: high post-shock densities and temperatures promote subsequent gas-phase chemistry, including reactive collisions between carbonaceous products and association reactions with atomic hydrogen. As the gas cools behind the shock front, these conditions may favor the formation of larger carbonaceous molecules from smaller reactive fragments. This post-shock chemistry should play a key role in shaping the molecular inventory.
7.2 Shock-induced direct destruction versus secondary UV processing
While we have distinguished UV and collisional excitation, the two processes are intertwined in shocked environments. Behind the shock, molecular hydrogen is collisionally excited and dissociated, and the subsequent relaxation and recombination processes emit a significant UV flux. A fraction of the UV photons is absorbed by PAHs which exhibit large UV absorption cross-sections. In low velocity shocks, the UV field is strong enough to destroy PAHs, while sputtering is less efficient at these velocities (Micelotta et al. 2010). For high velocity shocks (shock velocity vs of several tens of kilometers per second), both UV photodestruction and sputtering become important. However, sputtering becomes increasingly dominant as the shock velocity increases, because the kinetic energy of collisions scales with  , while the UV field strength does not increase as steeply. A quantitative investigation remains, however, outside the scope of this work.
7.3 Shock-induced production of DIB carriers
The spectral analysis and interpretation presented in this work indicate that the family of small dehydrogenated hydrocarbons (as shock products of PAHs) cause the green emission observed via OES (Sect. 6). However, determining their precise nature remains challenging given current experimental constraints. In our efforts to identify the green emitter(s), we found that the feature overlaps with a DIB centered at 5450 Å, observed in absorption. Due to the high temperature and pressure conditions behind the laboratory shock wave–significantly different from those in the diffuse ISM–and the broad, continuum-superimposed nature of the emission, it is currently not possible to fully characterize this feature or draw direct comparisons with astronomical spectra. Nonetheless, examining proposed carriers of the λ5450 DIB remains instructive.
Linnartz et al. (2010) first reported a spectral feature at 545.0 nm produced in an expanding acetylene plasma that matched the central wavelength and width of the λ5450 DIB. Although they could not identify the carrier, they suggested it was a transient species composed of carbon and hydrogen. Later that year, gas-phase spectra obtained via cavity ringdown spectroscopy in a supersonic slit jet discharge with allene as precursor led to the assignment of the band to the B1B1–X1A1 transition of H2CCC (Maier et al. 2010). However, the high column density required and the lack of additional spectral evidence in the ISM ruled out l-C3H2 as the sole carrier, though it may contribute in combination with other species at the same wavelength (Krełowski et al. 2011; Liszt et al. 2012; Zack & Maier 2014).
More recently, Marlton et al. (2024) reported that the strongest visible band of HC11H+, with a central wavelength of 545.1 nm and a width of 1.5 nm, matches the λ5450 DIB. However, this identification remains unconfirmed, as other HC11H+ bands do not correspond to known DIBs, and the absence of smaller HC2n+1H+ chains complicates column density determinations. A reliable identification of a DIB carrier requires a match in central wavelength, width, and rotational profile across all vibrational bands in an electronic transition, as well as chemical plausibility, coverage of the DIB spectral range, and sufficient oscillator strength (Zack & Maier 2014).
Given the contested nature of prior laboratory assignments, attributing the green component observed here to a specific species would be speculative. However, when combined with previous studies on carbon chains, MD simulations, and results from complementary experiments including L2MS analysis (Sect. 6), small neutral dehydrogenated hydrocarbons of the form CnHx – with odd n < 10 and x ≤ 3 – emerge as plausible candidates.
7.4 Shock route to nanostructures
The current work, in particular through the L2MS analysis, suggests formation of highly carbonaceous material from shocked PAHs. The formation of carbon nanotubes, ribbons and onions, evidenced by HRTEM imaging, supports the scenario of fullerene-like conversion from (larger) PAHs in energetic environments such as interstellar clouds illuminated by strong UV radiation fields. The formation of fullerenes from the destruction of PAHs in space is considered to occur through a series of photochemical-driven processes that progressively break down and reorganize carbonaceous material. When large PAHs are exposed to intense UV radiation, particularly in PDRs and planetary nebulae, they undergo sequential dehydrogenation, where hydrogen atoms are stripped away, leading to more stable pure carbon structures (Berné & Tielens 2012). They can then turn to graphene flakes, and restructure into more compact and curved forms, ultimately forming fullerenes such as C60 and C70 (Zhen et al. 2014), which have been detected in planetary nebulae (Cami et al. 2010). Depending on their energy, they can also shrink by loosing C2 units, forming smaller rings and chains. The processes of dehydrogenation, isomerization and skeleton shrinking are somewhat entangled and can take place simultaneously.
This study outlines a two-step route towards the formation of larger nanostructures, such as carbon nanotubes and carbon nano-onions. Laboratory experiments underscore a sequential process, resulting first from a top-down mechanism forming reactive carbon units, in particular small carbon clusters (heating phase), followed by bottom-up chemistry through nucleation of these clusters and reassembling into larger structures (cooling phase). Details of the second phase of such a process in space remain though elusive as carbon fragments will likely cool down, before colliding with other carbon partners, through radiative emission or collision with more abundant atomic of molecular hydrogen. As a result, the energy of the products might not be high enough for the structure to easily reassemble or isomerize. This calls for further investigation.
However, carbon nanostructures could form in space directly through top-down processes. Recent shock-tube experiments indicate that shock processing of SiC dust analogs can yield various carbon allotropes such as graphite, graphene, carbon onions, and carbon nanotubes (Chandrasekaran et al., private communication). Similarly, slow thermal decomposition of SiC at 1300 K has been shown to produce fullerenes and nanotubes (Bernal et al. 2022), supporting the idea that such nanostructures may form in circumstellar environments and be ejected into the interstellar medium during the planetary nebula phase. After they are formed, these nanostructures are likely to be stable against UV radiation, potentially persisting over long timescales.
The detection of these nanostructures in space remains challenging due to their presumably low abundances. Nonetheless, some IR emission features observed in planetary nebulae – such as those at 6.6, 9.8, and 20 µm – have been tentatively linked to planar C24, graphene precursors, or fullerenes (García-Hernández et al. 2012). Interstellar graphene may arise from photochemical processing of PAHs or fragmentation of graphite, with estimated abundances ranging from 5 to 20 ppm of C/H (about 2–7% of total interstellar carbon) (Chen et al. 2017; Li et al. 2019).
Similarly, carbon nanotubes may form in the ISM via hydrogen abstraction and acetylene addition mechanisms, as suggested by DFT calculations (Chen & Li 2019). Their interstellar abundance is constrained to a maximum of 10 ppm of C/H (around 4% of total carbon) (Li et al. 2020). These species, including their hydrogenated and cationic variants, exhibit distinctive IR vibrational features that might be detectable with instruments such as JWST.
8 Conclusions
The shock-induced processing of coronene C24H12, a prototypical compact PAH, was comprehensively investigated under laboratory conditions that shared some of the characteristics that are found in energetic astrophysical environments. Using a pressure-driven shock tube coupled with in situ OES and an ex situ analysis of solid residues via IR spectroscopy, Raman spectroscopy, L2MS, XRD, and HRTEM, we elucidated the key pathways in the transformation of PAHs under shock conditions.
Our findings revealed a dominant dehydrogenation pathway for coronene upon exposure to temperatures reaching 4000 K. This process leads to the formation of molecular hydrogen and a diverse range of carbonaceous products. In situ real-time spectroscopy confirmed that C2 radicals are a major gas-phase component, alongside a broad continuum emission that is attributed to large carbon clusters Cn and medium-size hydrogen-poor hydrocarbons CnHx. These results call for a more quantitative analysis of the volatile shock products through online mass spectrometry measurements, for example.
The ex situ analysis of solid residues demonstrated the formation of graphenic and graphitic nanostructures, including carbon nano-onions, nanotubes, and nanoribbons. This suggests a sequential pathway from PAHs to more complex carbonaceous materials. PAHs first loose hydrogen and are broken down into smaller reactive carbon units just behind the shock before they reassemble into larger structures when the gas cools. The L2MS analysis validated carbonization of the shock products. Our results suggest that shocks might contribute to the formation of nanostructures in space in their wake.
MD simulations corroborated most of the experimental observations and highlighted the importance of dehydrogenation and fragmentation in the initial stages of coronene breakdown. The simulations further suggested the formation of key intermediate species, such as C2 and small carbon clusters and hydrocarbons, and they provided insights into the kinetic rate of the dissociation process. The absence of detectable C3 emission despite its predicted formation in MD simulations indicates the potential role of collisional quenching or conversion into a long-lifetime triplet state.
These results contribute to the understanding of the life cycle of carbon in the interstellar medium. Shock waves are prevalent in diverse astrophysical environments and can drive the transformation of PAHs into smaller hydrocarbons and graphene flakes. These processes participate in the overall carbon budget of the ISM and might play a role in the formation of some DIB carriers. The identification of CnHx species as potential carriers of the green broad emission that was observed in our experiments requires further investigation regarding a potential link to the λ5450 DIB.
This study further underscored the value of shock tubes as a crucial tool in laboratory astrophysics. They enable the controlled reproduction of the high temperatures and energy inputs characteristic of astrophysical shocks. A central feature of the process we observed is its sequential nature: an initial top-down phase, in which fast-heated PAHs undergo dehydrogenation and fragmentation into smaller units, is followed by a bottom-up reassembly of shock products into larger nanometer-scale carbonaceous structures. While this staged evolution may not fully capture the complexity of astrophysical environments. in which these processes may overlap or compete, it nonetheless provides critical insights into the chemical pathways that govern PAH transformation.
By combining in situ diagnostics with ex situ analysis, this approach enables a comprehensive investigation of the formation and destruction mechanisms of key species in the ISM and shed light into the life cycle of complex carbonaceous materials under extreme conditions. We provided a framework for future studies aimed at unraveling the complex interplay between PAHs, shocks, and the evolution of carbonaceous materials in space.
Acknowledgements
We are grateful to J. Courbe for his help in the mechanical design and L. Rutkowski for her assistance in the development of the optical spectrometer. We acknowledge C. Sandt and F. Borondics from the SOLEIL SMIS beamline for access to the spectrometer and assistance with calibration for Raman measurements. The authors thank the Indo-French Center for the Promotion of Advanced Research (CEFIPRA/IFCPAR) under project # 6005-2. We thank the computational facility of the Institute of Chemistry of Rennes. AS thanks the computing mesocenter CALMIP (“CALcul en MIdi Pyrénées”, UAR3667 of CNRS) for generous allocation of computer resources (project P17002). We also acknowledge support from the CNRS Action Thé-matique de Physique Stellaire and Action Thématique de Physique et Chimie du Milieu Interstellaire (PCMI). This study received the support of the ANR FULLDIBS (grant ANR-20-CE31-0014). The work benefited greatly from discussions with X. Mercier regarding PAH pyrolysis and F. Lique on collisional excitation/relaxation processes. The Centre for Excellence in Hypersonics is acknowledged for partial financial support.
References
- Allain, T., Leach, S., & Sedlmayr, E. 1996, A&A, 305, 616 [NASA ADS] [Google Scholar]
- Allamandola, L., Tielens, A., & Barker, J. 1985, ApJ, 290, L25 [NASA ADS] [CrossRef] [Google Scholar]
- Andrews, H., Candian, A., & Tielens, A. G. G. M. 2016, A&A, 595, A23 [NASA ADS] [CrossRef] [EDP Sciences] [Google Scholar]
- Awad, Z., & Viti, S. 2022, MNRAS, 511, 3832 [NASA ADS] [CrossRef] [Google Scholar]
- Banhatti, S., Rap, D. B., Simon, A., et al. 2022, Phys. Chem. Chem. Phys., 24, 27343 [Google Scholar]
- Bernal, J. J., Zega, T. J., & Ziurys, L. M. 2022, J. Phys. Chem. A, 126, 5761 [Google Scholar]
- Berné, O., & Tielens, A. G. 2012, Proc. Natl. Acad. Sci. U.S.A., 109, 401 [CrossRef] [Google Scholar]
- Berné, O., Montillaud, J., & Joblin, C. 2015, A&A, 577, A133 [NASA ADS] [CrossRef] [EDP Sciences] [Google Scholar]
- Biennier, L., Salama, F., Allamandola, L. J., & Scherer, J. J. 2003, J. Chem. Phys., 118, 7863 [Google Scholar]
- Biennier, L., Jayaram, V., Suas-David, N., et al. 2017, A&A, 599, A42 [NASA ADS] [CrossRef] [EDP Sciences] [Google Scholar]
- Boyé, S., Campos, A., Douin, S., et al. 2002, J. Chem. Phys., 116, 8843 [Google Scholar]
- Buntine, J. T., Cotter, M. I., Jacovella, U., et al. 2021, J. Chem. Phys., 155, 214302 [NASA ADS] [CrossRef] [Google Scholar]
- Burkhardt, A. M., Lee, K. L. K., Changala, P. B., et al. 2021, ApJ Lett., 913, L18 [Google Scholar]
- Bussi, G., Donadio, D., & Parrinello, M. 2007, J. Chem. Phys., 126, 014101 [NASA ADS] [CrossRef] [Google Scholar]
- Cain, J., Laskin, A., Kholghy, M. R., Thomson, M. J., & Wang, H. 2014, Phys. Chem. Chem. Phys., 16, 25862 [Google Scholar]
- Cami, J., Bernard-Salas, J., Peeters, E., & Malek, S. E. 2010, Science, 329, 1180 [NASA ADS] [CrossRef] [Google Scholar]
- Campbell, E. K., & Maier, J. P. 2017, J. Chem. Phys., 146, 160901 [CrossRef] [Google Scholar]
- Campbell, E. K., Holz, M., Gerlich, D., & Maier, J. P. 2015, Nature, 523, 322 [NASA ADS] [CrossRef] [Google Scholar]
- Castellanos, P., Candian, A., Zhen, J., Linnartz, H., & Tielens, A. G. G. M. 2018, A&A, 616, A166 [NASA ADS] [CrossRef] [EDP Sciences] [Google Scholar]
- Cernicharo, J., Goicoechea, J. R., & Caux, E. 2000, ApJ, 534, L199 [NASA ADS] [CrossRef] [Google Scholar]
- Cernicharo, J., Agúndez, M., Cabezas, C., et al. 2021, A&A, 649, L15 [EDP Sciences] [Google Scholar]
- Cernicharo, J., Cabezas, C., Fuentetaja, R., et al. 2024, A&A, 690, L13 [NASA ADS] [CrossRef] [EDP Sciences] [Google Scholar]
- Chabot, M., Béroff, K., Dartois, E., Pino, T., & Godard, M. 2019, ApJ, 888, 17 [NASA ADS] [CrossRef] [Google Scholar]
- Chakraborty, S., Yurchenko, S. N., Georges, R., et al. 2024, A&A, 681 [Google Scholar]
- Champeaux, J.-P., Moretto-Capelle, P., Cafarelli, P., et al. 2014, MNRAS, 441, 1479 [Google Scholar]
- Chen, T., & Li, A. 2019, A&A, 631, A54 [NASA ADS] [CrossRef] [EDP Sciences] [Google Scholar]
- Chen, T., Gatchell, M., Stockett, M. H., et al. 2015, J. Chem. Phys., 142 [Google Scholar]
- Chen, X., Li, A., & Zhang, K. 2017, ApJ, 850, 104 [Google Scholar]
- Chen, T., Luo, Y., & Li, A. 2020, A&A, 633, A103 [NASA ADS] [CrossRef] [EDP Sciences] [Google Scholar]
- Chown, R., Sidhu, A., Peeters, E., et al. 2024, A&A, 685, A75 [NASA ADS] [CrossRef] [EDP Sciences] [Google Scholar]
- Cordiner, M. A., Linnartz, H., Cox, N. L. J., et al. 2019, ApJ, 875, L28 [NASA ADS] [CrossRef] [Google Scholar]
- Cox, N. L. J., Cami, J., Farhang, A., et al. 2017, A&A, 606, A76 [NASA ADS] [CrossRef] [EDP Sciences] [Google Scholar]
- Daly, F. C., Palotás, J., Jacovella, U., & Campbell, E. K. 2023, A&A, 677, A128 [NASA ADS] [CrossRef] [EDP Sciences] [Google Scholar]
- Delaunay, R., Gatchell, M., Rousseau, P., et al. 2015, J. Phys. Chem. Lett., 6, 1536 [CrossRef] [Google Scholar]
- Diedhiou, M., West, B. J., & Mayer, P. M. 2020, Mol. Astrophys., 19, 100071 [Google Scholar]
- Ebenbichler, A., Postel, A., Przybilla, N., et al. 2022, A&A, 662, A81 [NASA ADS] [CrossRef] [EDP Sciences] [Google Scholar]
- Ekern, S. P., Marshall, A. G., Szczepanski, J., & Vala, M. 1998, J. Phys. Chem. A, 102, 3498 [NASA ADS] [CrossRef] [Google Scholar]
- Elstner, M., Porezag, D., Jungnickel, G., et al. 1998, Phys. Rev. B, 58, 7260 [CrossRef] [Google Scholar]
- Elyajouri, M., Lallement, R., Cox, N. L. J., et al. 2018, A&A, 616, A143 [NASA ADS] [CrossRef] [EDP Sciences] [Google Scholar]
- Fairbairn, A. 1966, JQSRT, 6, 325 Ferrari, A. C., & Robertson, J. 2000, Phys. Rev. B, 61, 14095 [Google Scholar]
- García-Hernández, D. A., Villaver, E., García-Lario, P., et al. 2012, ApJ, 760, 107 [CrossRef] [Google Scholar]
- Gatchell, M., Stockett, M. H., Rousseau, P., et al. 2014, Int. J. Mass Spectrom., 365, 260 [Google Scholar]
- Gatchell, M., Ameixa, J., Ji, M., et al. 2021, Nat. Commun., 12, 6646 [NASA ADS] [CrossRef] [Google Scholar]
- Gaydon, A. 2012, The Spectroscopy of Flames (Springer Science & Business Media) [Google Scholar]
- Genzel, R., Lutz, D., Sturm, E., et al. 1998, ApJ, 498, 579 [Google Scholar]
- Georges, R., Thiévin, J., Benidar, A., et al. 2019, Rev. Sci. Inst., 90, 093103 [NASA ADS] [CrossRef] [Google Scholar]
- Goicoechea, J. R., Pety, J., Cuadrado, S., et al. 2025, A&A, 696, A100 [NASA ADS] [CrossRef] [EDP Sciences] [Google Scholar]
- Guzmán, V., Pety, J., Goicoechea, J. R., et al. 2015, ApJ, 800, L33 [CrossRef] [Google Scholar]
- Habart, E., Peeters, E., Berné, O., et al. 2024, A&A, 685, A73 [NASA ADS] [CrossRef] [EDP Sciences] [Google Scholar]
- Herbig, G. H. 1995, Annu. Rev. Astron. Astrophys., 33, 19 [Google Scholar]
- Hinkle, K. W., Keady, J. J., & Bernath, P. F. 1988, Science, 241, 1319 [NASA ADS] [CrossRef] [Google Scholar]
- Hony, S., Van Kerckhoven, C., Peeters, E., et al. 2001, A&A, 370, 1030 [CrossRef] [EDP Sciences] [Google Scholar]
- Hrodmarsson, H. R., Bouwman, J., Tielens, A. G., & Linnartz, H. 2022, Int. J. Mass Spectrom., 476, 116834 [CrossRef] [Google Scholar]
- Hrodmarsson, H. R., Bouwman, J., Tielens, A. G., & Linnartz, H. 2023, Int. J. Mass Spectrom., 485, 116996 [CrossRef] [Google Scholar]
- Huo, Y., Cangahuala, M. K. E., Zamudio-Bayer, V., et al. 2023, Eur. Phys. J. D, 77, 181 [Google Scholar]
- Jiao, L., Zhang, L., Wang, X., Diankov, G., & Dai, H. 2009, Nature, 458, 877 [Google Scholar]
- Joblin, C. 2003, in SF2A-2003: Semaine de l’Astrophysique Francaise, eds. F. Combes, D. Barret, T. Contini, & L. Pagani, 175 [Google Scholar]
- Jochims, H. W., Ruhl, E., Baumgartel, H., Tobita, S., & Leach, S. 1994, Astrophys. J., 420, 307 [Google Scholar]
- Jones, R., & Seifert, G. 1997, Phys. Rev. Lett., 79, 443 [Google Scholar]
- Jäger, C., Huisken, F., Mutschke, H., Jansa, I. L., & Henning, T. 2009, ApJ, 696, 706 [CrossRef] [Google Scholar]
- Kaiser, R. I., & Hansen, N. 2021, J. Phys. Chem. A, 125, 3826 [NASA ADS] [CrossRef] [Google Scholar]
- Kiefer, J., Sidhu, S., Kern, R., et al. 1992, Combust. Sci. Technol., 82, 101 [Google Scholar]
- Kit, O., Tallinen, T., Mahadevan, L., Timonen, J., & Koskinen, P. 2012, Phys. Rev. B Condensed Matter Mater. Phys., 85, 085428 [Google Scholar]
- Krełowski, J., Galazutdinov, G., & Kołos, R. 2011, ApJ, 735, 124 [NASA ADS] [CrossRef] [Google Scholar]
- Kruse, T., & Roth, P. 1997, J. Phys. Chem. A, 101, 2138 [NASA ADS] [CrossRef] [Google Scholar]
- Lacinbala, O., Calvo, F., Dubosq, C., et al. 2022, J. Chem. Phys, 156, 144305 [Google Scholar]
- Lallement, R., Cox, N. L. J., Cami, J., et al. 2018, A&A, 614, A28 [NASA ADS] [CrossRef] [EDP Sciences] [Google Scholar]
- Lallement, R., Vergely, J. L., & Cox, N. L. J. 2024, A&A, 691, A41 [NASA ADS] [CrossRef] [EDP Sciences] [Google Scholar]
- Ławicki, A., Holm, A. I., Rousseau, P., et al. 2011, Phys. Rev. A At. Mol. Opt. Phys., 83, 022704 [Google Scholar]
- Leger, A., & Puget, J. 1984, A&A, 137, L5 [NASA ADS] [Google Scholar]
- Lemmens, A. K., Mackie, C. J., Candian, A., et al. 2023, Faraday Discuss., 245, 380 [Google Scholar]
- Li, Q., Li, A., & Jiang, B. 2019, MNRAS, 490, 3875 [Google Scholar]
- Li, Q., Li, A., Jiang, B., & Chen, T. 2020, MNRAS, 493, 3054 [Google Scholar]
- Lim, H. E., Miyata, Y., Kitaura, R., et al. 2013, Nat. Commun., 4, 2548 [Google Scholar]
- Linnartz, H., Wehres, N., Van Winckel, H., et al. 2010, A&A, 511, L3 [NASA ADS] [CrossRef] [EDP Sciences] [Google Scholar]
- Liszt, H., Sonnentrucker, P., Cordiner, M., & Gerin, M. 2012, ApJ Lett., 753, L28 [Google Scholar]
- Maier, J., Walker, G., Bohlender, D., et al. 2010, ApJ, 726, 41 [Google Scholar]
- Marciniak, A., Joblin, C., Mulas, G., Mundlapati, V. R., & Bonnamy, A. 2021, A&A, 652, A42 [NASA ADS] [CrossRef] [EDP Sciences] [Google Scholar]
- Marlton, S. J., Liu, C., Watkins, P., & Bieske, E. J. 2024, Phys. Chem. Chem, Phys., 26, 12306 [Google Scholar]
- McGuire, B. A., Loomis, R. A., Burkhardt, A. M., et al. 2021, Science, 371, 1265 [Google Scholar]
- Micelotta, E. R., Jones, A. P., & Tielens, A. G. G. M. 2010, A&A, 510, A36 [NASA ADS] [CrossRef] [EDP Sciences] [Google Scholar]
- Micelotta, E. R., Jones, A. P., & Tielens, A. G. G. M. 2011, A&A, 526, A52 [NASA ADS] [CrossRef] [EDP Sciences] [Google Scholar]
- Montillaud, J., Joblin, C., & Toublanc, D. 2013, A&A, 552, A15 [NASA ADS] [CrossRef] [EDP Sciences] [Google Scholar]
- Mykhailiv, O., Zubyk, H., & Plonska-Brzezinska, M. E. 2017, Inorg. Chim. Acta, 468, 49 [Google Scholar]
- Nemes, L., Keszler, A. M., Parigger, C. G., et al. 2007, Appl. Opt., 46, 4032 [Google Scholar]
- Omont, A. 2024, A&A, 690, A275 [NASA ADS] [CrossRef] [EDP Sciences] [Google Scholar]
- Oomens, J., Sartakov, B. G., Tielens, A. G. G. M., Meijer, G., & von Helden, G. 2001, ApJ, 560, L99 [Google Scholar]
- Panchagnula, S., Kamer, J., Candian, A., et al. 2024, Phys. Chem. Chem. Phys., 26, 18557 [Google Scholar]
- Pathak, A. D., Potphode, D., & Sharma, C. S. 2022, Mater. Adv., 3, 3610 [Google Scholar]
- Peeters, E., Hony, S., Van Kerckhoven, C., et al. 2002, A&A, 390, 1089 [NASA ADS] [CrossRef] [EDP Sciences] [Google Scholar]
- Peeters, E., Habart, E., Berné, O., et al. 2024, A&A, 685, A74 [NASA ADS] [CrossRef] [EDP Sciences] [Google Scholar]
- Pety, J., Teyssier, D., Fossé, D., et al. 2005, A&A, 435, 885 [NASA ADS] [CrossRef] [EDP Sciences] [Google Scholar]
- Pino, T., Boudin, N., & Bréchignac, P. 1999, J. Chem. Phys., 111, 7337 [NASA ADS] [CrossRef] [Google Scholar]
- Porezag, D., Frauenheim, T., Köhler, T., Seifert, G., & Kaschner, R. 1995, Phys. Rev. B, 51, 12947 [NASA ADS] [CrossRef] [Google Scholar]
- Postma, J., Bari, S., Hoekstra, R., Tielens, A. G. G. M., & Schlathölter, T. 2009, ApJ, 708, 435 [Google Scholar]
- Qiu, T., Yang, J.-G., Bai, X.-J., & Wang, Y.-L. 2019, RSC Adv., 9, 12737 [Google Scholar]
- Raghavachari, K., & Binkley, J. S. 1987, J. Chem. Phys., 87, 2191 [Google Scholar]
- Rapacioli, M., Cazaux, S., Foley, N., et al. 2018, Phys. Chem. Chem. Phys., 20, 22427 [NASA ADS] [CrossRef] [Google Scholar]
- Rapacioli, M., Heine, T., Dontot, L., et al. 2023, deMonNano experiment, http://demon-nano.ups-tlse.fr/ [Google Scholar]
- Rodrigues, S., Marques, M., Suárez-Ruiz, I., et al. 2013, Int. J. Coal Geol., 111, 67 [Google Scholar]
- Romanini, D., Biennier, L., Salama, F., et al. 1999, Chem. Phys. Lett., 303, 165 [Google Scholar]
- Rousselot, P., Arpigny, C., Rauer, H., et al. 2001, A&A, 368, 689 [NASA ADS] [CrossRef] [EDP Sciences] [Google Scholar]
- Roy, A., Singh, S. V., Ambresh, M., et al. 2022, Adv. Space Res., 70, 2571 [NASA ADS] [CrossRef] [Google Scholar]
- Sabbah, H., Bonnamy, A., Papanastasiou, D., et al. 2017, ApJ, 843, 34 [CrossRef] [Google Scholar]
- Sadezky, A., Muckenhuber, H., Grothe, H., Niessner, R., & Pöschl, U. 2005, Carbon, 43, 1731 [Google Scholar]
- Salama, F., Galazutdinov, G., Krełowski, J., et al. 2011, ApJ, 728, 154 [NASA ADS] [CrossRef] [Google Scholar]
- Sasaki, K., Wakasaki, T., Matsui, S., & Kadota, K. 2002, J. Appl. Phys., 91, 4033 [Google Scholar]
- Schmidt, T. W. 2021, Acc. Chem. Res., 54, 481 [Google Scholar]
- Schmidt, D., & Ziurys, L. 2017, ApJ, 850, 123 [NASA ADS] [CrossRef] [Google Scholar]
- Simon, A., & Rapacioli, M. 2018, in Specialist Chemical Reports, 14, Chemical Modelling, eds. J. Ole, & M. Springborg (Royal Society of Chemistry), 195 [Google Scholar]
- Simon, A., Rapacioli, M., Rouaut, G., Trinquier, G., & Gadea, F. X. 2017, Phil. Trans. A, 375, 20160195 [Google Scholar]
- Simon, A., J.-P., C., Rapacioli, M., P., M.-C., & Gadea, F. X. 2018, Theo. Chem. Acc., 137, 106 [Google Scholar]
- Singh, K. M., Rajakumar, B., & Arunan, E. 2016, J. Indian Inst. Sci., 96, 53 [Google Scholar]
- Singh, S., Maurya, S. K., Gulyas, L., & Tribedi, L. C. 2024, arXiv preprint [arXiv:2409.13238] [Google Scholar]
- Staicu, A., Krasnokutski, S., Rouillé, G., Henning, T., & Huisken, F. 2006, J. Mol. Struct., 786, 105 [NASA ADS] [CrossRef] [Google Scholar]
- Stockett, M. H., Zettergren, H., Adoui, L., et al. 2014, Phys. Rev. A, 89, 032701 [NASA ADS] [CrossRef] [Google Scholar]
- Stockett, M. H., Gatchell, M., Chen, T., et al. 2015, J. Phys. Chem. Lett., 6, 4504 [Google Scholar]
- Sundararajan, P., Candian, A., Kamer, J., Linnartz, H., & Tielens, A. G. 2024, Phys. Chem. Chem. Phys., 26, 19332 [Google Scholar]
- Tielens, A. 2008, Annu. Rev. Astron. Astrophys., 46, 289 [CrossRef] [Google Scholar]
- Ugarte, D. 1995, Carbon, 33, 989 [Google Scholar]
- Van Orden, A., & Saykally, R. J. 1998, Chem. Rev., 98, 2313 [CrossRef] [Google Scholar]
- Verstraete, L., Puget, J. L., Falgarone, E., et al. 1996, A&A, 315, L337 [NASA ADS] [Google Scholar]
- Vlahov, A. 2021, Geol. Balcanica, 50, 11 [Google Scholar]
- von Helden, G., Hsu, M. T., Gotts, N., & Bowers, M. T. 1993, J. Phys. Chem., 97, 8182 [Google Scholar]
- Weltner, W. J., & McLeod, D. J. 1964, J. Chem. Phys., 40, 1305 [Google Scholar]
- Wenzel, G., Joblin, C., Giuliani, A., et al. 2020, A&A, 641, A98 [NASA ADS] [CrossRef] [EDP Sciences] [Google Scholar]
- Wenzel, G., Cooke, I. R., Changala, P. B., et al. 2024, Science, 386, 810 [NASA ADS] [CrossRef] [Google Scholar]
- Wenzel, G., Gong, S., Xue, C., et al. 2025a, ApJ, 984, L36 [Google Scholar]
- Wenzel, G., Speak, T. H., Changala, P. B., et al. 2025b, Nat. Astron., 9, 262 [Google Scholar]
- West, B., Joblin, C., Blanchet, V., et al. 2014, J. Phys. Chem. A, 118, 1807 [Google Scholar]
- West, B., Rodriguez Castillo, S., Sit, A., et al. 2018, Phys. Chem. Chem. Phys. (Incorp. Faraday Trans.), 20, 7195 [Google Scholar]
- Xu, D., & Li, D. 2016, ApJ, 833, 90 [Google Scholar]
- Yurchenko, S. N., Al-Refaie, A. F., & Tennyson, J. 2018, A&A, 614, A131 [NASA ADS] [CrossRef] [EDP Sciences] [Google Scholar]
- Zack, L. N., & Maier, J. P. 2014, Chem. Soc. Rev., 43, 4602 [CrossRef] [Google Scholar]
- Zhen, J., Castellanos, P., Paardekooper, D. M., Linnartz, H., & Tielens, A. G. 2014, ApJ, 797, L30 [Google Scholar]
- Zhen, J., Rodriguez Castillo, S., Joblin, C., et al. 2016, ApJ, 822, 113 [Google Scholar]
Appendix A Time-resolved optical emission spectral measurements
The analysis of coronene C24H12 shock-induced optical emission components is supported by analogous studies on ethylene C2H4, corannulene C20H10, fullerene C60, and a mixture of fullerene and dihydrogen C60/H2. The optical emission spectra are displayed below for the time at which the emission is at its maximum. Simulated spectra behind the reflected shock at T=4000 K are also reported. Self-absorption, which clearly affects the emission spectra, was taken into account in the simulations.
Except for fullerene, the optical emission spectra all exhibit a green emission component in addition to the C2 signature and to the blackbody-like emission.
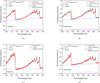 |
Fig. A.1 Shock-induced processing at 4000 K of (a) ethylene C2H4, (b) corannulene C20H10, (c) fullerene C60, and (d) fullerene C60 mixed with H2. Calculated spectra (black) compared to experimental optical emission spectra (red). Self-absorption was taken into account in the simulations. |
Appendix B Dynamics of the C2 and blackbody-like components
The use of the time-resolved spectrometer permitted us to collect the in situ emission of shock-products in three dimensional large data-sets (intensity, wavelength, time). Time cuts were performed and examined for ethylene C2H4, coronene C24H12, fullerene C60 and fullerene/dihydrogen C60/H2 mixtures. The time resolved emission signals were superimposed to the temperature profile to highlight the characteristics of the heating and cooling phases. The temperature was derived from pressure trace measurements considering an isentropic process. A more precise value of the gas temperature could be obtained from the analysis optical emission spectra.
The C2 time profiles look similar except in the case of shock-induced processing of ethylene C2H4 for which it is more extended, suggesting a prolonged production.
The blackbody-like component spans almost 10 ms, extending well into the cooling phase which typically starts at 4–5 ms. Notably it starts with the incident shock for ethylene, suggesting a rapid formation from C2H4 even at the low temperature of ∼ 2000 K.
The time profiles were employed to derive fB, the ratio of the blackbody-like emission to the total emission at 516 nm. Interestingly, fB is twice as large for C60 than for C60 mixed in H2. This is a clear indication that the emitters that cause the blackbody-like component are composed of pure carbon clusters Cn and hydrocarbons CnHx.
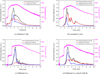 |
Fig. B.1 Time-resolved optical emission from shock products at 4000 K of various precursors at 516 nm and 520 nm with temperature derived from the pressure trace measurements considering an isentropic process. |
Contribution of the blackbody component to the total emission and C2 number density from time-resolved emission of the shock-exposed targets: PAHs (coronene, corannulene), ethylene, and fullerenes (with and without hydrogen) at T = 4000 K. The fraction fB is the blackbody-like emission over the total emission at λ =516 nm and at the time for which the total emission is maximum.
Appendix C Integrated optical emission spectroscopy
The emission spectra of shock-induced processing of coronene were collected by the STS-UV minispectrometer integrated for the whole shock duration (10 ms) for a variety of shock conditions (Fig. C.1). The C2 signature and the blackbody-like emission clearly increase with temperature Tg. Self-absorption clearly affects the C2 signature. Contamination by sodium (Na I) , iron (Fe I) and aluminum (Al I), originating from the surface of the shock tube and diaphragm, was also identified.
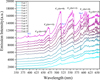 |
Fig. C.1 UV–visible integrated emission spectra recorded with the STS-UV Ocean Optics minispectrometer of shock-processed coronene. The spectra were recorded under shock conditions sampling the Tg=2500–4000 K temperature range. |
Appendix D Molecular dynamics simulations
MD simulations were performed to examine the thermal processing of coronene C24H12 and ethylene C2H4. All MD results presented and discussed in this section are reported in the Zenodo database, DOI : 10.5281/zenodo.15057193. The time evolution of shock-products of coronene is displayed below as an illustration.
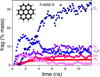 |
Fig. D.1 MD simulations of the time evolution of a selection of shock-products of coronene C24H12 at 4000 K. |
Appendix E Photodissociation mass spectrometry
UV photodissociation mass spectra of isotopically pure coronene ions  cryogenically trapped in PIRENA (Piège à Ions pour la Recherche et l’Etude de Nouvelles Espèces Astrochimiques) were recorded in early experiments (Joblin 2003). The mass spectrum is represented hereafter in a C# versus H# diagram to facilitate comparison with L2MS results.
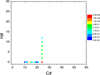 |
Fig. E.1 Photodissociation mass spectrum of cold trapped coronene |

Appendix F Laser desorption laser ionization mass spectrometry
Post-shock solid residues from C60 mixed in H2 were mass-analyzed to help in the interpretation of the results obtained for other dust analogs. Mass spectra show that H is very weakly incorporated into the end-products. Most of the peaks are assigned to carbon clusters.
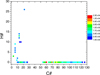 |
Fig. F.1 L2MS analysis of solid residues from C60 in H2 exposed to a shock wave at T = 4000 K. The diagram displaying the H# versus the number of Carbon atoms C# is color coded for mass peak signals (log scale). |
Appendix G TEM imaging
The bright field image of unexposed coronene, provided in Fig. G.1(a), shows agglomerated fibres. The selected area electron diffraction pattern (SAED) of the crystalline structure of pristine coronene is also displayed. At 100 nm magnification, the TEM images of post-shock residues show predominately graphitic layered structures such as nano-onions, nanotubes and nanoribbons. Figure G.2 displays an enlarged view of the specified region within the rectangle (previously mentioned in the article) in conjunction with the interplanar spacing of the shock-exposed products obtained from the HRTEM images.
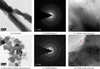 |
Fig. G.1 High resolution transmission electron microscope images of pristine (top) and shock processed (bottom) coronene at Tg= 4370 K. |
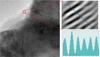 |
Fig. G.2 HRTEM image of shocked coronene with magnified image of the selected area and interplanar spacing of powder along the blue line drawn. |
All Tables
Contribution of the blackbody component to the total emission and C2 number density from time-resolved emission of the shock-exposed targets: PAHs (coronene, corannulene), ethylene, and fullerenes (with and without hydrogen) at T = 4000 K. The fraction fB is the blackbody-like emission over the total emission at λ =516 nm and at the time for which the total emission is maximum.
All Figures
|
Fig. 1 Schematic representation of the sample chamber of the MST facility we used to study the in situ chemical and physical evolution of interstellar dust analogs. |
| In the text | |
|
Fig. 2 Pressure evolution vs. time in the MST facility sample chamber (460 mm from the end flange). |
| In the text | |
|
Fig. 3 Optical emission (color-coded) vs. wavelength (x-axis) and time (y-axis) from C24H12 exposed to a shock wave characterized by a temperature Tg of 4291 K. |
| In the text | |
|
Fig. 4 Calculated spectra (black) compared to experimental optical emission spectra (red) of shock-induced coronene. Self-absorption was taken into account in the simulations. Adjusted values for ϵ, [C2] and Tgas: (a) 0.06, 2.3×10¹⁵ molecule cm−3, 4000 K; (b) 0.137, 1.8×10¹⁶ molecule cm−3, 4000 K; (c) 0.18, 2×10¹⁶ molecule cm−3, 4000 K and (d) 0.08, 5×10¹⁵ molecule cm−3, 3500 K. Contamination by iron (Fe I) (527 nm) was also identified. |
| In the text | |
|
Fig. 5 Time-resolved optical emission from shock products recorded at 516 nm and 520 nm at 15 mm from the end flange with temperature derived from the pressure trace measurement considering an isentropic compression process T = c Pγ−1/γ with c a constant term. |
| In the text | |
|
Fig. 6 MD simulations of the dissociation of coronene in the canonical approximation. The thermalization time was set to 100 ps. The confinement effects were simulated by implementing a repulsive spherical wall with a 60 Å radius. |
| In the text | |
|
Fig. 7 Laser desorption laser ionization mass spectrometry analysis of solid residues from the coronene sample exposed to a shock wave at T = 3500 K estimated from integrated emission spectroscopic measurements. The diagram displaying the number of hydrogens (H#) vs. the number of carbons (C#) is color-coded for mass peak signals (log scale). |
| In the text | |
|
Fig. 8 Infrared transmittance spectra of the pristine sample (coronene) and shocked coronene at Tg = 1900 K and 4300 K. |
| In the text | |
|
Fig. 9 Raman spectra of solid residues of shocked coronene at temperatures Tg covering the 1900 K to 4300 K range. |
| In the text | |
|
Fig. 10 X-ray diffraction spectra of pristine (bottom) and shock-processed (top) coronene. |
| In the text | |
|
Fig. 11 HRTEM imaging of shocked coronene at Tg= 4370 K showing carbon nanoribbons, nanotubes, and nano-onions. The red rectangle indicates the area in which the spacing d was measured. The magnified view of the red area and interplanar spacing calculation are displayed in Fig. G.2. |
| In the text | |
|
Fig. A.1 Shock-induced processing at 4000 K of (a) ethylene C2H4, (b) corannulene C20H10, (c) fullerene C60, and (d) fullerene C60 mixed with H2. Calculated spectra (black) compared to experimental optical emission spectra (red). Self-absorption was taken into account in the simulations. |
| In the text | |
|
Fig. B.1 Time-resolved optical emission from shock products at 4000 K of various precursors at 516 nm and 520 nm with temperature derived from the pressure trace measurements considering an isentropic process. |
| In the text | |
|
Fig. C.1 UV–visible integrated emission spectra recorded with the STS-UV Ocean Optics minispectrometer of shock-processed coronene. The spectra were recorded under shock conditions sampling the Tg=2500–4000 K temperature range. |
| In the text | |
|
Fig. D.1 MD simulations of the time evolution of a selection of shock-products of coronene C24H12 at 4000 K. |
| In the text | |
|
Fig. E.1 Photodissociation mass spectrum of cold trapped coronene |
| In the text | |
|
Fig. F.1 L2MS analysis of solid residues from C60 in H2 exposed to a shock wave at T = 4000 K. The diagram displaying the H# versus the number of Carbon atoms C# is color coded for mass peak signals (log scale). |
| In the text | |
|
Fig. G.1 High resolution transmission electron microscope images of pristine (top) and shock processed (bottom) coronene at Tg= 4370 K. |
| In the text | |
|
Fig. G.2 HRTEM image of shocked coronene with magnified image of the selected area and interplanar spacing of powder along the blue line drawn. |
| In the text | |
Current usage metrics show cumulative count of Article Views (full-text article views including HTML views, PDF and ePub downloads, according to the available data) and Abstracts Views on Vision4Press platform.
Data correspond to usage on the plateform after 2015. The current usage metrics is available 48-96 hours after online publication and is updated daily on week days.
Initial download of the metrics may take a while.