Fig. 7
Download original image
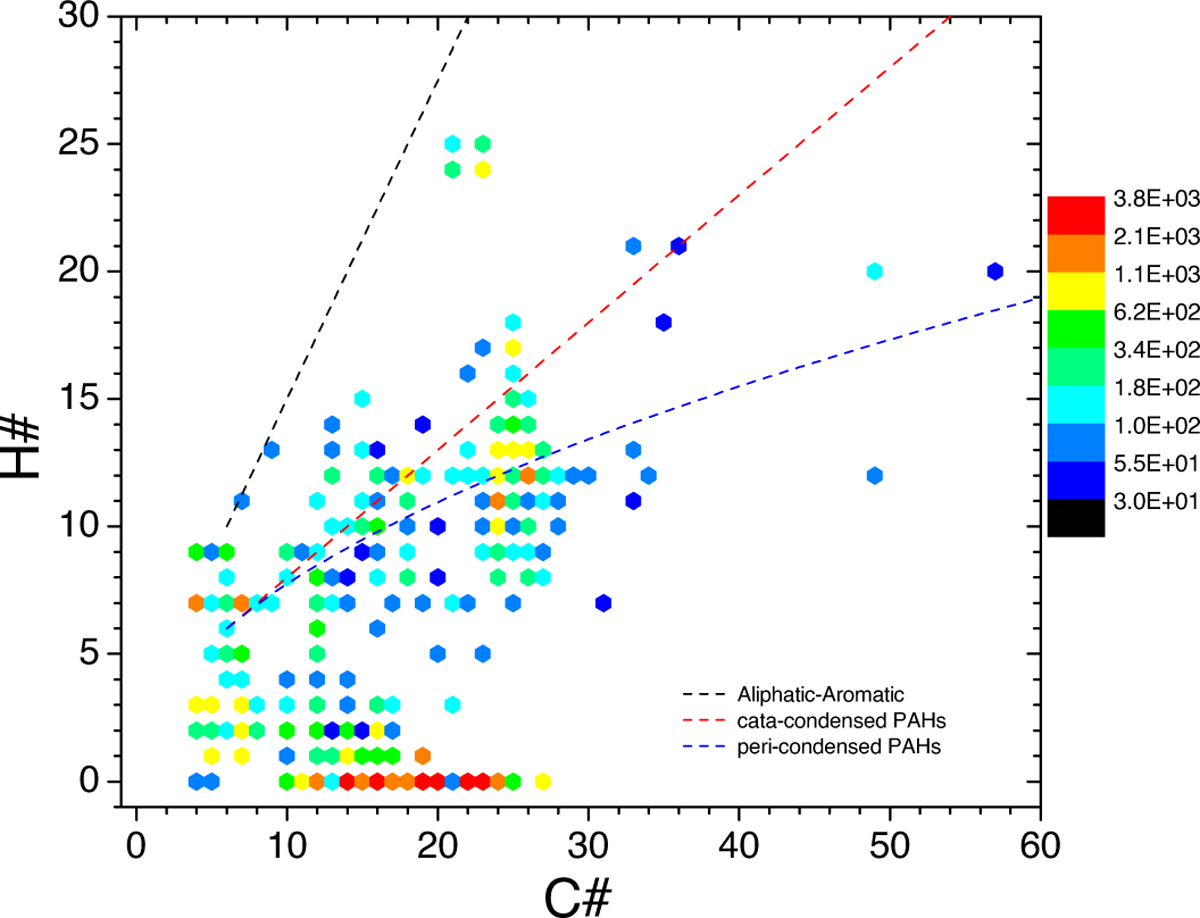
Laser desorption laser ionization mass spectrometry analysis of solid residues from the coronene sample exposed to a shock wave at T = 3500 K estimated from integrated emission spectroscopic measurements. The diagram displaying the number of hydrogens (H#) vs. the number of carbons (C#) is color-coded for mass peak signals (log scale).
Current usage metrics show cumulative count of Article Views (full-text article views including HTML views, PDF and ePub downloads, according to the available data) and Abstracts Views on Vision4Press platform.
Data correspond to usage on the plateform after 2015. The current usage metrics is available 48-96 hours after online publication and is updated daily on week days.
Initial download of the metrics may take a while.