Fig. 1
Download original image
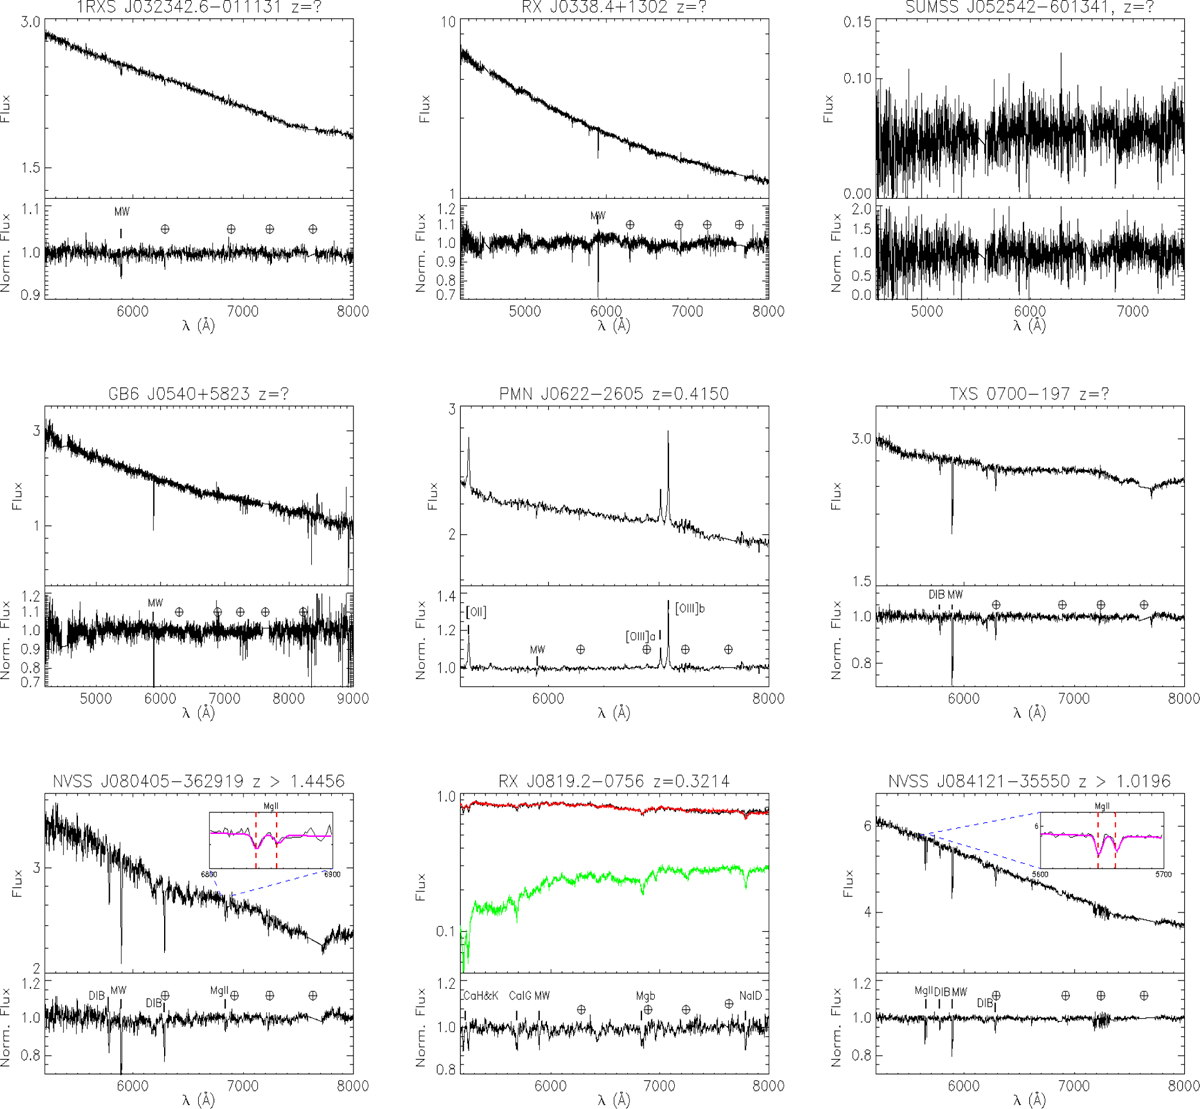
Flux-calibrated and normalised spectra of the first nine sources in Table A.1. Each panel contains the spectrum and in some cases also a continuum and galaxy model for each source. Each panel has two parts. Upper: flux-calibrated and telluric-corrected spectrum (black) alongside the best fit model (red). The flux is in units of 10−16 erg cm−2 s−1Å−1. The elliptical galaxy component is shown in green. We note that the plots are in observer frame and in logarithmic units, therefore different parts of the galaxy template are visible in each plot. The fits to intervening absorption systems are shown in magenta. Lower: normalised spectrum with labels for the detected spectral features. Atmospheric telluric absorption features are indicated by the symbol ⊕ and Galactic absorption features are labelled ‘MW’ and ‘DIB’.
Current usage metrics show cumulative count of Article Views (full-text article views including HTML views, PDF and ePub downloads, according to the available data) and Abstracts Views on Vision4Press platform.
Data correspond to usage on the plateform after 2015. The current usage metrics is available 48-96 hours after online publication and is updated daily on week days.
Initial download of the metrics may take a while.