| Issue |
A&A
Volume 704, December 2025
|
|
|---|---|---|
| Article Number | A190 | |
| Number of page(s) | 17 | |
| Section | Catalogs and data | |
| DOI | https://doi.org/10.1051/0004-6361/202556430 | |
| Published online | 16 December 2025 | |
Optical spectroscopy of blazars for the Cherenkov Telescope Array Observatory – IV★
1
Departamento de Astronomiá, Universidad de Chile,
Camino El Observatorio 1515,
Las Condes,
Santiago,
Chile
2
Université Paris Cité, CNRS, CEA, Astroparticule et Cosmologie,
75013
Paris,
France
3
Department of Physics, Chemistry & Material Science, University of Namibia,
Private Bag 13301,
Windhoek,
Namibia
4
Santa Cruz Institute for Particle Physics and Department of Physics, University of California,
Santa Cruz,
CA
95064,
USA
5
Laboratoire Univers et Théories, Observatoire de Paris, Université PSL, Université Paris Cité, CNRS,
92190
Meudon,
France
6
Université Paris Cité, CNRS, Astroparticule et Cosmologie,
75013
Paris,
France
7
Centre for Space Research, North-West University,
Potchefstroom 2520,
South Africa
8
Centro Brasileiro de Pesquisas Fisicas (CBPF),
Rua Dr. Xavier Sigaud 150 – Urca,
Rio de Janeiro
22290-180,
Brazil
9
Universidad de La Laguna (ULL), Departamento de Astrofísica,
E-38206
La Laguna,
Tenerife,
Spain
10
Instituto de Astrofísica de Canarias (IAC),
38200
La Laguna,
Tenerife,
Spain
11
Oxford Astrophysics, University of Oxford,
Denys Wilkinson Building, Keble Road,
Oxford,
OX1 3RH,
UK
12
INAF – Istituto di Radioastronomia,
Via Gobetti 101,
40129
Bologna,
Italy
13
Finnish Centre for Astronomy with ESO, FINCA, University of Turku,
Turku
20014,
Finland
14
Astronomical Observatory of Taras Shevchenko National University of Kyiv,
3 Observatorna Street,
Kyiv
04053,
Ukraine
15
Instituto de Astrofísica, Facultad de Fisica, Pontificia Universidad Católica de Chile,
Av. Vicuña Mackenna 4860,
Macul,
Santiago,
Chile
16
University of Bialystok, Faculty of Physics,
ul. K. Ciolkowskiego 1L,
15-245
Bialystok,
Poland
17
Department of Physics, University of the Free State,
Bloemfontein
9300,
South Africa
★★ Corresponding author: This email address is being protected from spambots. You need JavaScript enabled to view it.
Received:
15
July
2025
Accepted:
29
September
2025
Abstract
Context. Blazars, comprising BL Lacertae objects (BL Lacs) and flat-spectrum radio quasars, are the most luminous extragalactic sources that dominate the γ-ray sky. They account for approximately 56% of the sources listed in the recent Fermi-LAT (Large Area Telescope) catalogue (4FGL-DR4). The optical and UV spectra of BL Lacs are nearly featureless, making it difficult to precisely determine their redshifts. Consequently, nearly half of the γ-ray BL Lacs lack reliable redshift measurements. This poses a significant challenge, since redshift is crucial for studying the cosmic evolution of the blazar population and for understanding their intrinsic emission mechanisms. Additionally, it is vital for γ-ray propagation studies, such as indirect evidence of extragalactic background light (EBL), placing constraints on the intergalactic magnetic field (IGMF), and searches for Lorentz invariance violation (LIV) and axion-like particles (ALPs).
Aims. This paper is the fourth in a series dedicated to determining the redshift of a sample of blazars identified as key targets for future observations with the Cherenkov Telescope Array Observatory (CTAO). The precise determination of the redshifts of these objects plays a crucial role in planning future CTAO observations.
Methods. We carried out Monte Carlo simulations to identify potential γ-ray blazars with hard spectra detected by the Fermi-LAT telescope that currently lack redshift measurements. These simulations selected the blazars that are anticipated to be detectable by the CTAO within 30 hours or less of exposure assuming an average flux state. In this fourth paper, we report the results of detailed spectroscopic observations of 29 blazars using the ESO/VLT, Keck II, and SALT telescopes. Our analysis involved a thorough search for spectral lines in the spectra of each blazar, and when features of the host galaxy were identified, we modelled its properties. Moreover, we compared the magnitudes of the targets during the observations to their long-term light curves.
Results. In the sample studied, 9 of 29 sources were observed with a high signal-to-noise ratio (S/N > 100), while the remaining 20 were observed with a moderate or low S/N. We successfully determined firm redshifts for 12 blazars, ranging from 0.1636 to 1.1427, and identified two lower limit redshifts at z > 1.0196 and z > 1.4454. The remaining 15 BL Lac objects exhibited featureless spectra under the observed S/N.
Key words: galaxies: active / BL Lacertae objects: general / galaxies: distances and redshifts / gamma rays: galaxies
Based on observations collected at the European Organisation for Astronomical Research in the Southern Hemisphere, Chile, under programs P108.22CJ001 P109.238K.001 P111.24MZ.002. The raw FITS data files are available in the ESO archive. Some of the data presented herein were obtained at the W. M. Keck Observatory, which is operated as a scientific partnership among the California Institute of Technology, the University of California and the National Aeronautics and Space Administration. The Observatory was made possible by the generous financial support of the W. M. Keck Foundation. Based on observations made with the Southern African Large Telescope (SALT) under program 2021-1-MLT-008 (PI E. Kasai).
© The Authors 2025
 Open Access article, published by EDP Sciences, under the terms of the Creative Commons Attribution License (https://creativecommons.org/licenses/by/4.0), which permits unrestricted use, distribution, and reproduction in any medium, provided the original work is properly cited.
This article is published in open access under the Subscribe to Open model. This email address is being protected from spambots. You need JavaScript enabled to view it. to support open access publication.
1 Introduction
Blazars are a distinctive class of jetted active galactic nucleus (AGN), with powerful relativistic jets directed along our line of sight (see e.g. Antonucci 1993; Urry & Padovani 1995; Padovani et al. 2017). As a result, these jets appear to be strongly Doppler-boosted, giving blazars their unique properties (see e.g. Blandford & Königl 1979). Their unique characteristics include strongly beamed non-thermal emission that spans the entire electromagnetic spectrum, from low-energy radio to high-energy γ-rays (see e.g. Hovatta & Lindfors 2019; Blandford et al. 2019), and rapid, high-amplitude flux variations throughout the observable spectrum, occurring over timescales ranging from minutes to years (see e.g. Wagner & Witzel 1995; Ulrich et al. 1997; Aharonian et al. 2007; Richards et al. 2011; Falomo et al. 2014; Ackermann et al. 2016; Meyer et al. 2019). Furthermore, blazar jets show detectable polarisation in the optical (see e.g. Angel & Stockman 1980; Mead et al. 1990; Angelakis et al. 2016), radio (Lister et al. 2011), and X-rays (Di Gesu et al. 2022; Liodakis et al. 2022; Di Gesu et al. 2023), with variable polarisation (see e.g. Abdo et al. 2010; Fraija et al. 2017). Some also show the ejection of superluminal radio blobs (see e.g. Vermeulen & Cohen 1994).
Since 2008, the Large Area Telescope (LAT) on board the Fermi Gamma Ray Space Telescope (referred to hereafter as Fermi-LAT1) (Atwood et al. 2009) has opened a new era of the study of blazars in the realm of high-energy γ-ray astronomy (100 MeV < E < 300 GeV). The Fermi-LAT has identified 7194 γ-ray sources, of which 3933 are blazars (4FGL-DR4; Ballet et al. 2023). Of these 3933 blazars, 1490 are BL Lacertae objects (BL Lacs), 820 are flat-spectrum radio quasars (FSRQs), and 1623 are blazar candidates of uncertain type (BCUs). Notably, 90% of the BCUs lack redshift estimates, and 36% of the BL Lac objects also do not have redshift measurements. In the past two decades, very high-energy (VHE > 100 GeV) γ-ray astronomy has also advanced greatly, largely thanks to the efforts of the current generation of imaging atmospheric Cherenkov telescopes (IACTs): VERITAS2, H.E.S.S.3, and MAGIC4 (see e.g. Holder et al. 2006; Aharonian et al. 2006; Aleksic et al. 2016a,b). Among the 309 sources recognised as tera-electronvolt sources (TeVCAT5; Wakely & Horan 2008), 99 are extragalactic, 85% of which are classified as blazars, as of February 2025. VHE emission has been detected in both types of blazars: FSRQs and BL Lacs, with BL Lacs accounting for the majority of VHE-detected blazars. However, the redshifts of 12 out of 70 VHE BL Lacs are still unknown, whereas the redshifts of 10 FSRQs have been measured.
Determining the redshift of BL Lac objects remains challenging (see e.g. Shaw et al. 2013b; Paiano et al. 2017; Peña-Herazo et al. 2020). This difficulty arises because their optical spectra usually show weak emission lines with an equivalent width (EW) of < 5 Å, if any at all, in contrast to FSRQs, which display prominent emission lines (EW > 5 Å) (e.g. Stocke et al. 1991). The detection of spectral features is complicated by the non-thermal variable jet emission, which follows a featureless power-law distribution and which often overwhelms the emission and absorption lines from the host galaxy. To detect such weak emission from BL Lacs, their spectra need to have a high signal-to-noise ratio (S/N). Despite numerous efforts having been made using X-ray and radio-selected blazars, which were limited to bright sources (BZCAT6; Massaro et al. 2015a), the redshift sample for BL Lac objects is still inadequate. Indeed the redshift completeness of the best BL Lac samples is about 40-50% (see e.g. Shaw et al. 2013b). Given this situation, other methods can be used to constrain the redshift such as deep imaging of the host galaxy (Nilsson et al. 2003, 2024) and the association of the BL Lac object with a coincident galaxy group (Koljonen et al. 2024). The limited redshift data for BL Lac objects also impacts the study of their cosmic evolution (see e.g. Ajello et al. 2014). This issue worsens at VHE because of the very limited number of sources detected at higher redshifts due to absorption by the EBL.
In the next few years, the Cherenkov Telescope Array Observatory (CTAO7) will become operational, routinely achieving a lower energy threshold for VHE γ-ray detections down to several tens of giga-electronvolts. Moreover, it will have a flux sensitivity enhanced by approximately a factor of 10 in the teraelectronvolt energy range compared to existing facilities. The wide energy range of the CTAO, spanning 20 GeV to 300 TeV, will improve the detectability of many AGNs and enable more comprehensive population studies. The CTAO will enable the detection of γ-rays from blazars whose VHE spectra undergo significant distortion due to interactions with EBL. This will place critical constraints on both the intensity of the EBL and the intrinsic spectra of the blazars (see e.g. Dwek & Krennrich 2013; Biteau & Williams 2015). The EBL holds valuable information about the formation and evolution of stars and galaxies over cosmic time, and blazar studies provide an indirect method of probing these. The electron-positron pairs produced by γ-ray interactions with the EBL are sensitive to the IGMF, which remains poorly understood. These pairs can therefore be used to constrain the properties of the IGMF (see e.g. Aharonian et al. 1994; Durrer & Neronov 2013; Alves Batista et al. 2019). The propagation of VHE γ-ray radiation can also be used to address major questions in cosmology and fundamental physics, including the potential existence of ALPs (see e.g. Mirizzi et al. 2007; Abramowski et al. 2013), searches for LIV (Kifune 1999), and offer an independent method of determining the Hubble constant, H0 (Salamon et al. 1994). BL Lac objects play a crucial role in determining the density of EBL (see e.g. Ajello et al. 2014; Biteau & Williams 2015), especially those with redshifts greater than 0.3 (see Cherenkov Telescope Array Consortium 2019). However, an accurate determination of the redshift for these sources is key to the success of such studies. Therefore, it is essential to measure the redshifts for a significant number of blazars detected by Fermi-LAT, as these blazars, based on their extrapolated LAT spectra, are excellent candidates for CTAO observations. Determining their redshifts will help us to select the most suitable ones for these observations.
This work is the fourth paper in a series that aims to spectroscopically determine the redshifts of blazar samples that the CTAO is most likely to detect. In three previous papers, Goldoni et al. (2021, hereafter Paper I), Kasai et al. (2023, hereafter Paper II) and D’Ammando et al. (2024, hereafter Paper III), the firm redshifts of 37 blazars within the range from 0.0838 to 0.8125, along with two tentative redshifts and six lower limits, were established. In this paper, we provide comprehensive results for 29 new targets.
The paper is structured as follows. Sections 2 and 3 provide details of the sample and observing strategy, and of the observations and data reduction, respectively. In Sections 4 and 5, we detail the analysis and results, and in Section 6 we discuss the flux of the targets during our observations, using public photometric light curves to place the observed flux in the context of the sources’ activity. Finally, Section 7 contains the discussion and conclusions.
2 Sample and observing strategy
We aim to determine the spectroscopic redshifts, or establish lower limits, for BL Lac objects and BCUs. These sources were selected from the Third Fermi-LAT Catalog of High-Energy Sources (3FHL; Ajello et al. 2017), which spans the energy range from 10 GeV to 2 TeV, and in which more than 50% of the sources lack redshift measurements. The sample selection process is thoroughly explained in Paper I, Paper II, and Paper III. Briefly, the procedure involved extrapolating the Fermi-LAT spectra into the tera-electronvolt domain and performing Monte Carlo simulations using the Gammapy8 software (Donath et al. 2023) in conjunction with the publicly accessible CTAO performance files9. EBL absorption was applied using the model by Domínguez et al. (2011). For 3FHL sources with no redshift available, we assumed a value of z = 0.3 similar to the median values in Shaw et al. (2013b) and Peña-Herazo et al. (2020). Sources detectable with the CTAO in less than 30 hours were selected for the sample.
The details of the objects analysed in this work are provided in Table A.1. All the sources, except for SUMSSJ052542-601341, 4C+29.48, 1RXSJ171405.2-202747, NVSSJ182338-345412, and NVSSJ192502+28154, are identified as BL Lac objects in the 4FGL-DR4 catalogue. These five sources are classified as BCUs in the 4FGL-DR4 catalogue and high-synchrotron peaked BL Lacs in the 3HSP blazar catalogue (Chang et al. 2019).
BL Lacs are mainly hosted by luminous elliptical galaxies (Urry et al. 2000). To achieve our objective, we focused on detecting stellar absorption features in the host galaxies of BL Lac objects, including the CaHK doublet, Mgb, and NaID. Although emission lines such as [OII], Hβ, [OIII], Hα, and [NII] are rarely detected in the BL Lac spectra, we also incorporated them into our investigations. A more complete line list can be found in Paper II. These objects typically exhibit weak lines with an |EW| of less than 5 Å. Detecting such faint lines requires a spectral resolution of several hundred (ideally near 1000) and a S/N of around 100 per pixel. This combination of conditions has been shown to be effective in previous studies, as was demonstrated in Paper I, Paper II, and Paper III, and in Pita et al. (2014). If the chosen instrument cannot provide spectra with both of these properties, we configured it to obtain at least one of them. Additionally, observing these sources during periods of low optical activity could further improve the S/N by reducing the non-thermal foreground from the AGN (see Paper III and Section 6).
3 Observations and data reduction
We observed 29 blazars between April 3, 2021 and June 20, 2023, using three instruments mounted on separate telescopes, the Keck/ESI10 (Sheinis et al. 2002), SALT/RSS11 (Burgh et al. 2003), and VLT/FORS12 (Appenzeller et al. 1998), for a total observing time of approximately 36 hours. The details of the observations are provided in Table A.1.
Details of the data reduction, flux calibration, telluric corrections, and spectral dereddening are presented in Paper I, Paper II, and Paper III and we have followed the same approach in this study. A comprehensive description of the Keck/ESI and SALT/RSS instruments is given in Paper I, and a description of VLT/FORS is provided in Paper III. The main parameters of the instruments and the configuration employed are summarised in Table A.2.
4 Redshift measurement and estimation of the total emission of blazars
To measure the redshifts of the blazars, we searched for the emission or absorption lines in their optical spectra. For a reliable redshift determination, we required at least two independent features with consistent redshift values. The lines we looked for are listed in Section 2. Once we identified these features in the spectra, we calculated the EW by fitting the continuum with cubic splines and integrating the flux over each pixel. The uncertainties in the EW were estimated by summing in quadrature, the errors from the normalised flux and the continuum placement (see Sembach & Savage 1992). Tables A.3, A.4 and A.5 present the measured EWs along with their corresponding errors.
To estimate the uncertainty in the redshift measurement, we considered the quadratic sum of the uncertainties from the wavelength calibration and the position of the detected features, the latter determined by a Gaussian fit. The relative error in wavelength calibration is estimated to be 6-12 × 10−5 (see details in Paper I and Paper II). The total estimated relative errors from the two contributions are between 1-5 × 10⁻⁴. The redshift measurements and their error estimation are given in Table 1.
The optical spectra of BL Lac objects result from both non-thermal emission, driven by jet activity, and thermal emission, originating from the stellar light of the elliptical host galaxy. Consequently, we modelled the spectral energy distribution (SED) by combining a power law (fλ ∝ λα), representing the jet emission, with an elliptical galaxy template, representing the host galaxy (Mannucci et al. 2001; Bruzual & Charlot 2003). Each spectrum was modelled with a single template. The fit required only two free parameters: the power-law slope and the jet-to-galaxy ratio. When an emission feature was visible in the spectrum, it was masked during the fit and added afterwards as a Gaussian component (see, e.g. Pita et al. 2014). We provide the results of the fits in Table 1.
We also calculated the absolute magnitude of the detected host galaxies. To estimate slit losses, we assumed the effective radius of the host galaxy, re, to be 10 kpc, based on a de Vau-couleurs profile (de Vaucouleurs 1948, 1953). Using the template spectra, we computed K corrections without applying any evolutionary corrections. For hosts that were not detected, we fitted the spectra with a power law, normalised at the centre of the band. Due to the high S/N values of the spectra, very small relative errors are observed in the fitted parameters, approximately 10−3. However, residual curvature seen in the spectra suggests either intrinsic changes in slope or possible calibration issues (such as flux calibration or extinction corrections). To account for this, we separately fitted the red and blue halves of the spectra and used the difference between the blue and red parameters as the 1-sigma errors for the overall spectrum parameters. The uncertainties listed for the slope in Table 1 represent three times these values, or 3-sigma errors.
5 Sources and results
For the 29 BL Lac sources listed in Table A.1, spectroscopic redshifts were determined for 12 of them, ranging from 0.1636 to 1.1427. Furthermore, two lower limits on redshift (z ≥ 1.0196 and z ≥ 1.4454) were identified. In the following, we present a detailed discussion of the results for each source based on our observations.
5.1 1RXS J032342.6-011131
The SDSS spectrum of 1RXS J032342.6-011131 have previously been presented in Shaw et al. (2013b) and Peña-Herazo et al. (2020), but no definitive redshift determination was reported in these studies. We observed this source using VLT/FORS on September 23 2022 with a total exposure time of 1600 s, obtaining a high S/N (∼132). The resulting spectrum is featureless and the redshift remains undetermined, as is shown in the top left panel of Figure 1.
Analysis results for the observed sources.
5.2 RX J0338.4+1302
In Paper II, a Lick/KAST (KAST Double Spectrograph on the Shane 3-metre telescope at Lick observatory) observation was performed, with an exposure time of 7200 s, achieving a S/N of 32. The identification of the MgII doublet set a lower redshift limit for this source at z ≥ 0.3821. This feature was also noted in earlier spectra reported by Marchesini et al. (2016); Paiano et al. (2017). We subsequently observed the source on October 15 2021 with Keck/ESI using a 7200 s exposure time, achieving a moderate S/N of 60. The Keck/ESI observation revealed a featureless spectrum without additional identifiable features, shown in the top middle panel of Figure 1. Note that the MgII absorber is not contained in the wavelength range of this spectrum.
5.3 SUMSS J052542-601341
SUMSS J052542-601341 is a faint optical source with a magnitude of G = 19.90 ± 0.02 (Gaia-DR3; Gaia Collaboration 2023). No spectral data for this source have been reported in the literature. Using photometric observations of the Lyman-alpha break from the Swift UV-Optical Telescope (Swift-UVOT; Gehrels et al. 2004) and the Gamma-Ray Optical/Near-Infrared Detector (GROND; Greiner et al. 2008) on the MPG 2.2m telescope at ESO La Silla, Kaur et al. (2017) estimated its photometric redshift to be 1.78. We obtained spectroscopic data for this source using SALT/RSS on October 7 and 8 2021, with total exposure times of 2400 s and 1990 s, respectively. The resulting averaged spectrum, which is featureless, has a very low S/N of 3 and is shown in the top right panel of Figure 1. We note that the magnitude estimation we listed in Table 1 is equivalent to G = 21.5 ± 0.2, much weaker than the average Gaia magnitude. The reliability of the flux calibration in this particular case is, however, low due to the low S/N of the spectrum.
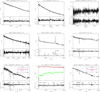 |
Fig. 1 Flux-calibrated and normalised spectra of the first nine sources in Table A.1. Each panel contains the spectrum and in some cases also a continuum and galaxy model for each source. Each panel has two parts. Upper: flux-calibrated and telluric-corrected spectrum (black) alongside the best fit model (red). The flux is in units of 10−16 erg cm−2 s−1Å−1. The elliptical galaxy component is shown in green. We note that the plots are in observer frame and in logarithmic units, therefore different parts of the galaxy template are visible in each plot. The fits to intervening absorption systems are shown in magenta. Lower: normalised spectrum with labels for the detected spectral features. Atmospheric telluric absorption features are indicated by the symbol ⊕ and Galactic absorption features are labelled ‘MW’ and ‘DIB’. |
5.4 GB6 J0540+5823
GB6 J0540+5823 is identified as a hard γ-ray source and is located near the position of an IceCube13 event (Padovani et al. 2016). Previous spectra of this source were reported in Shaw et al. (2013b) using the Double Spectrograph on the 200-inch Hale Telescope at Mt. Palomar. A spectrum with an S/N of 25 was later observed with the 4-metre telescope at Kitt Peak National Observatory (KPNO) and presented in Marchesini et al. (2019). Paiano et al. (2020) provided a S/N = 60 spectrum using the Gran Telescopio Canarias (GTC). In Paper III, we presented spectra of this source obtained with the Lick/KAST instrument over a total exposure time of 8900 s and achieving a S/N of 34. None of the measured spectra revealed significant emission or absorption lines. Here, we present new observations conducted on October 15 2021 with Keck/ESI, featuring a total integration time of 5900 s and S/N of 42, resulting in a featureless spectrum (see the left panel of the second row in Figure 1).
5.5 PMN J0622-2605
The six-degree Field Galaxy Survey (6dF) spectrum of PMN J0622-2605, as was reported in Jones et al. (2009), suggested a redshift of z = 0.415. However, the publicly available 6dF spectrum has a very low S/N. To improve the data quality, we observed this source using VLT/FORS on February 6 2022 for a total exposure time of 1730 s and achieved a high S/N of ~90. Our observations detected the [OII], [OIII] λ 4959, and [OIII] λ 5007 emission lines, allowing us to firmly determine a precise redshift of z = 0.4150 ± 0.0001. The Hβ line could not be detected and we cannot set a significant upper limit on its flux as the line coincides with a strong atmospheric absorption feature. This result confirms the 6dF redshift measurement despite the limitations of their low-S/N spectrum. The spectrum of PMN J0622-2605 is shown in the middle panel of the second row in Figure 1. The [OIII] λ 5007 line (see Figure A.1, centre) also displays a broad blueshifted component usually attributed to an outflow (see, e.g. Singha et al. 2022). The line can be fitted with two Gaussian functions offset by −540 ± 50 km/s and with a full width at half maximum (FWHM) 360 km/s (core component at the systemic redshift) and 450 km/s (blueshifted-outflow component). These values are quite typical for [OIII] lines in optical AGNs, both Type 1 and Type 2 (Mullaney et al. 2013), and do not allow us to refine the classification of this source.
5.6 TXS 0700-197
A medium-S/N spectrum of TXS 0700-197 was analysed using the Low Resolution Imaging Spectrograph at the W. M. Keck Observatory, as was reported by Shaw et al. (2013b). No significant spectral lines were detected in the observations. On February 6, 2022, we observed this source with VLT/FORS for a total exposure time of 2595 s and achieving a high S/N of ∼110. The resulting spectrum, shown in the right panel of the second row of Figure 1, is featureless except for Galactic features such as NaID and the λ5780 diffuse interstellar band (DIB).
5.7 NVSS J080405-362919
NVSS J080405-362919 is a highly absorbed source (EB-V = 1.04) located near the Galactic plane (b = −2.8). No prior spectral data for this source are available in the literature. Since it is faint (G = 19.7 ± 0.01) and there is confusion with nearby sources, no photometric monitoring is available. We made observations using VLT/FORS on March 10 2022 and May 2 2022, with a total exposure time of 2430 s for each session and achieving a S/N of 70. The spectrum (left panel of the third row in Figure 1) displays a strong Galactic NaID line (EW = 4.0 ± 0.1 Å). Furthermore, the strong Galactic DIBs λ5780 (EW = 1.5 ± 0.1 Å) and λ 6284 (EW = 2.2 ± 0.1 Å) (see e.g. Jenniskens & Desert 1994) are also visible. In addition, we clearly detect a weaker extragalactic feature: a MgII absorber with EW = 0.80 ± 0.14 Å (as shown in the figure inset), establishing a lower redshift limit of z ≥ 1.4454 for the source. The EWs of the two components are 0.5 ± 0.1 Å and 0.3 ± 0.1 Å. Their ratio is 1.7 ± 0.4, which indicates a mildly saturated system (Spitzer 1978).
5.8 RX J0819.2-0756
RX J0819.2-0756 has been reported at redshift z = 0.85115 in the 6dF survey (Jones et al. 2009). Upon examination, however, the 6dF spectrum appears featureless. Furthermore, a photometric redshift of z = 0.37 was suggested by Chang et al. (2019).
Álvarez Crespo et al. (2016) conducted a short observation of this source (∼ 1200 s) using the IMACS medium-resolution spectrograph on the 6.5 m Magellan telescope at Cerro Manqui, Chile. However, the S/N = 13 spectrum was featureless. In Paper II, we observed this source with the NTT/EFOSC for 6650 s, obtaining a moderate S/N (∼36) spectrum. The tentative redshift was estimated at z ~ 0.320 based on the detection of CaHK lines. In this study, we observed RX J0819.2-0756 on February 25 2022, using VLT/FORS with an improved S/N of 61, over a total exposure time of 5190 s. The identification of absorption lines including CaHK, Ca I G, Mgb, and Na I D allowed us to firmly determine the redshift as z = 0.3214 ± 0.0002. The spectrum of RX J0819.2-0756 is displayed in the middle panel of the third row of Figure 1.
5.9 NVSS J084121-355506
NVSS J084121-355506 is a heavily absorbed source (EB-V = 0.4249). A featureless low-S/N spectrum was previously obtained by Masetti et al. (2013) using the New Technology Telescope (NTT) of the European Southern Observatory with an observing time of 3600 s, and medium-S/N spectra were obtained with the NTT by Titov et al. (2017). On March 4 2022, we observed this source using VLT/FORS, obtaining a S/N of 96 for a total integration time of 2595 s. Similar to the case of NVSS J080405-362919, strong λ 5780 and λ 6284 DIBs are present, but at lower intensity. Our observations reveal the presence of an MgII absorber with EW = 1.10 ± 0.08 Å and establish a lower redshift limit of z ≥ 1.0196. The EWs of the two components are 0.6 ± 0.05 Å and 0.5 ± 0.06 Å and their ratio is 1.2 ± 0.1, suggesting a fully saturated system (Spitzer 1978). The source’s spectrum is presented in the right panel of the third row of Figure 1.
5.10 1RXS J094709.2-254056
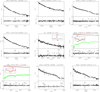
The spectrum of 1RXS J094709.2-254056 was previously studied by Peña-Herazo et al. (2017) using the Southern Astrophysical Research Telescope, with a 600 s exposure time, achieving a S/N of 95 and revealing no discernible features. We conducted further observations of this source using SALT/RSS on April 3, 2021, April 11, 2021, and February 5, 2022, with exposure times of 2070 s, 2390 s, and 2160 s, respectively, and achieved a high S/N of ∼ 126. Our resulting spectrum does not show significant features. The spectrum is shown in the top left panel of Figure 2.
5.11 NVSS J105534-012617
A featureless, very low-S/N spectrum of NVSS J105534-012617 was previously obtained using the 6dF survey by Jones et al. (2009). In a separate study, Paiano et al. (2020) obtained a high-S/N GTC spectrum of the source, but it lacked any spectral characteristics. We observed this source with SALT/RSS three times: on June 4, 5, and 11 2021, with a total exposure time of 6750 s, and achieved a high S/N of 79. Our observations revealed no significant spectral features, as is shown in the top middle panel of Figure 2. The redshift of the source is still undetermined.
5.12 NVSS J123341-014426
Spectra of NVSS J123341-014426 were previously examined by Shaw et al. (2013b) using data from the Marcario Low-Resolution Spectrograph on the Hobby-Eberly Telescope and by Kügler et al. (2014) using data from SDSS. Both analyses reported featureless spectra and did not determine a spectroscopic redshift. Later, Paiano et al. (2020) observed the source with the GTC obtaining a S/N = 40 spectrum, but no significant spectral features were detected. In our study, we observed this source on April 7, 2022 using VLT/FORS with a 4050 s exposure, obtaining spectra with a high S/N of 144, and found no prominent emission or absorption features. The corresponding spectrum is shown in the top right panel of Figure 2. The redshift of the source still remains undetermined.
5.13 1RXS J130737.8-425940
A high-S/N spectrum was obtained by Masetti et al. (2013) using NTT/EFOSC2 with an exposure time of 1200 s, yielding a featureless spectrum. In our study, we observed the spectrum of 1RXS J130737.8-425 940 using SALT/RSS on May 30 2021 and June 9, 2021, with a total exposure time of 2250 s for each session, and achieved a high S/N of ∼109. The resulting spectrum, as is shown in the left panel of the second row of Figure 2, is featureless. The redshift of the source has not yet been determined.
5.14 4C + 29.48
Gabányi et al. (2018) discussed the identification of the optical counterpart of 4C +29.48. The proposed object has been observed in SDSS DR12, and its redshift is reported as 1.142. However, due to the low S/N of the SDSS spectrum, we observed this source again using Keck/ESI on June 4, 2022, accumulating a total exposure time of 7200 s and obtaining a moderate S/N of 43. Our observations revealed the presence of an MgII emission line with an asymmetric profile extended towards long wavelengths and a weaker [OII] line at redshift z ~ 1.143. Profiles similar to the ones of the MgII line are often detected in the CIV lines of radio-loud quasars (Wills et al. 1995) and in the MgII lines of bright γ-ray blazars such as 3C 279 (Punsly et al. 2020, see their Figure 1). The asymmetry parameter A14 (Wills et al. 1995) of the MgII line of 4C +29.48 is 0.2, while it is 0.6 for 3C 279, indicating mild asymmetry. A possible explanation of this profile is a very strong jet combined with a weak accretion disk (Punsly et al. 2020). Careful examination of the [OII] line shows the presence of a double peak (Figure A.1), which suggests that the doublet is resolved in our data. Indeed, we could not fit the line with a single Gaussian (χ2/d.o.f. = 2.42) but we could find a satisfactory fit with two Gaussians (χ2/d.o.f. = 1.67). AnF test shows that this improvement in χ2/d.o.f. has only a 1.5% probability of happening with three fewer degrees of freedom and we consider the second component to have been detected. The two Gaussians can be identified with the two components of the [OII] doublet: λ 3726 and λ 3729, at redshift z = 1.1427 ± 0.0001, which we take as the systemic redshift. The intensity ratio is ∼1.3, which is consistent with a thin plasma at electron density ne ∼ 200 cm−3 at T = 104 K, typical values of HII regions (see Section 5.6 and Figure 5.8, Osterbrock & Ferland 2006). The full spectrum of 4C +29.48 is shown in the middle panel of the second row of Figure 2.
5.15 1RXSJ144037.4-384658
No prior spectrum for 1RXS J144037.4-384658 has been reported in the literature. Rajagopal et al. (2020) estimated its photometric redshift as  , using data from six Swift-UVOT filters as well as the SDSS g′, r′, i′, and z′ optical filters. These observations were conducted with the 0.65 m SARA-CTIO telescope in Chile and the 1.0 m SARA-ORM telescope in the Canary Islands. We observed this source on March 1 2022, with VLT/FORS, obtaining a total exposure time of 1200 s and a high S/N of 75. Our analysis identified absorption lines such as CaHK, CaIG, Mgb, and NaID (as is shown in Figure 2, second row, right panel), which enabled us to determine a precise redshift of z = 0.3583 ± 0.0002.
5.16 PMNJ1544-6641
The spectrum previously reported by Peña-Herazo et al. (2020), observed with the Blanco 4-m telescope at Cerro Tololo InterAmerican Observatory in Chile, was featureless. On March 10 2022, we obtained the spectrum of PMN J1544-6641 using VLT/FORS, achieving a S/N of 70 with a total exposure time of 1220 s. Our analysis revealed absorption lines, including CaIG, Mgb, and NaID (shown in Figure 2, third row, left panel), allowing us to determine a redshift of z = 0.2595 ± 0.0004.
5.17 NVSS J160756-203942
No previous spectrum has been found for NVSS J160756-203942. We conducted observations on March 30 2022, using VLT/FORS with an exposure time of 2430 s, achieving a moderate S/N of 62. In our observed spectra, we detected [OII] and [OIII]b emission lines, enabling the determination of the redshift as z = 0.5479 ± 0.0001. The resulting spectrum is presented in the middle panel of the third row of Figure 2.
5.18 NVSS J163750-344915
The spectrum of NVSS J163750-344915 was previously obtained by Peña-Herazo et al. (2017) using the Goodman Spectrograph at Southern Astrophysical Research Telescope (SOAR), achieving a S/N of 60. The resulting spectrum was featureless. In Paper I, we observed this source with EFOSC2, obtaining an improved S/N of 80, but no spectral lines were detected. In this study, we report the results of new observations conducted with SALT/RSS on June 5 and 12 2021, with a total exposure time of 2380 s per session, and obtained an even higher S/N of ∼ 93. The resulting spectra, shown in the right panel of the third row of Figure 2, remain featureless, and the redshift of the source is still undetermined.
5.19 NVSS J164011+062827
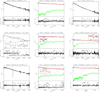
No previous spectrum for NVSS J164011+062827 has been reported in the literature. On June 4, 2022, we observed this source using Keck/ESI with a total exposure time of 6300 s and achieved a very high S/N of 112, but no spectral features were detected (see Figure 3, top left panel).
5.20 1RXSJ171405.2-202747
No prior spectral studies of 1RXS J171405.2-202747 have been documented in the literature. A photometric redshift of z = 0.09 of its counterpart 3HSP J171405.4-202752 was reported in the 3HSP catalogue (Chang et al. 2019) and on this basis Nievas Rosillo et al. (2022) classified the source as an extreme high-energy BL Lac. However, the optical counterpart reported in the 3HSP catalogue has a measurable parallax, π = 0725 ± 0703, in the Gaia catalogue (Gaia Collaboration 2023). This is not compatible with an extragalactic origin, and indeed the 4LAC catalogue reports for 1RXS J171405.2-202747 another optical counterpart with a negligible parallax. We report here on observations of the 4LAC counterpart. We conducted observations of this source using VLT/FORS on three occasions: March 29 2022, April 12, 2022, and May 2, 2022, with each observation having a total exposure time of 2430 s, obtaining a moderate S/N of 65. Our spectral analysis identified the presence of CaHK and Mgb absorption lines (as is shown in Figure 3, top middle panel), and determined the redshift of the source to be z = 0.5222 ± 0.0002.
5.21 RXJ1754.1+3212
Shaw et al. (2013b) presented spectra of RX J1754.1+3212 obtained with the LRIS spectrograph (Oke et al. 1995) at the W. M. Keck Observatory, but did not establish a definitive redshift. Shaw et al. (2013a) triggered another spectral observation, unfortunately in poor observing conditions, when the source was in a low state, yet the redshift remained undetermined. We examined the KAIT15 light curve of the source and determined that the source was at magnitude R ∼ 15.8 and R ∼ 17.0 during the first and second observations, respectively (Li et al. 2003).
We conducted observations of this source on June 4, 2022, using Keck/ESI with a total integrated exposure time of 7200 s, achieving a high S/N of 170. The source was again in low state at r ∼ 16.9 according to Zwicky Transient Facility (ZTF) monitoring (Masci et al. 2019). Our spectra were featureless, and the redshift remains unknown. The resulting spectrum is shown in the top right panel of Figure 3.
5.22 NVSS J182338-345412
A featureless spectrum of NVSS J182338-345412 was reported by Masetti et al. (2013), obtained using the NTT/EFOSC2 on September 5 2012. We observed the same source on two occasions using VLT/FORS. First, on March 11 2022 with a Grism 600RI and a GG435 filter (wavelength range ~5120-8450 Å), for a total exposure time of 500 s, achieving a high S/N of 110. In the corresponding spectrum, we identified a likely emission feature around 7805 Å, which, when interpreted as [NII]b, suggests a redshift of z ~ 0.183. Other possible weaker features could be interpreted as Mgb, NaID, and [OIII]b at this redshift. To better investigate this possibility, we performed a second observation on June 20, 2023 with a different configuration using Grism 300I and an OG590 filter (wavelength range ~6000-11 000 Å) for a total exposure time of 900 s and achieving a high S/N of ~100. The flux-calibrated spectra from both observations are presented in Figure 3 (second row, left panel) and a zoom between 6800 and 8100 Å of the normalised spectra is shown in Figure A.1. We note that the different flux levels of the two spectra are likely due to long-term variability; unfortunately, due to confusion issues, no reliable optical light curve of NVSS J182338-345412 is available to test this hypothesis. The second spectrum confirms the results of the first, clearly displaying the Hα-[NII] complex and the NaID absorption. Combining the two spectra we can establish a precise redshift for the source of z = 0.1826 ± 0.0002. Due to the weakness of the absorption features, we were not able to fit the galaxy model to the spectra. We thus roughly estimated the galaxy magnitude from the intensity of Mgb and NaID to be Mr 22.1 with a likely error of ± 0.5.
5.23 NVSS J184919-164723
A low-S/N spectrum of NVSS J184919-164723 was reported by Rajagopal et al. (2021), observed with the Blanco 4-m telescope, suggesting a redshift of z > 0.64-0.67 for this source. We conducted observations of this source with VLT/FORS on April 12, 2022, and May 1 2022, with total exposure times of 1620 s and 2430 s, respectively, achieving a moderate S/N of 46. Our spectra show the presence of Mgb and NaID absorption lines at z = 0.3485 ± 0.0005 (see Figure 3, middle panel, second row). Given this result, we examined the plot of the spectrum of the source as reported by Rajagopal et al. (2021) to understand the discrepancy. After careful examination, we are able to identify Hα and the Calcium triplet at redshift zero, and thus identify the object as a star. This may be the result of an inaccurate pointing.
5.24 NVSS J192502+28154
In Paper III, we presented the spectra of NVSS J192502+28154 obtained with Lick/KAST during observations conducted on June 9, 2021 and September 2 2021, with total exposure times of 4200 s and 7200 s, respectively, resulting in low S/Ns of 13 and 33. These spectra did not display any significant features. In the current work, we observed the source using Keck/ESI on October 15, 2021, achieving a significantly improved S/N of 65 with a total exposure time of 6300 s. Our observations reveal the presence of Mgb and NaID absorption lines, detected at a redshift of z = 0.1636 ± 0.0003. The spectrum is shown in the right panel of the second row of Figure 3.
5.25 1RXSJ194246.3+103339
A moderate-S/N (45) observation of this source was conducted using VLT/FORS1 by Tsarevsky et al. (2005), revealing a featureless spectrum. On June 4, 2022, we observed this source with Keck/ESI for a total exposure time of 7200 s, obtaining a high S/N (∼97). Our resulting spectrum is featureless, with no significant spectral lines detected, and the redshift is still unknown (see Figure 3, left panel of the third row).
5.26 1RXS J194422.6-452326
Chang et al. (2019) estimated the photometric redshift of 1RXS J194422.6-452 326 to be z = 0.21. Subsequent observations of this source by Marais & van Soelen (2024), using the South African Astronomical Observatory (SAAO) 1.9-m telescope, determined a spectroscopic redshift of z = 0.236 ± 0.002, based on the identification of [OII] emission as well as Ca H&K absorption lines. We conducted our observations of this source on March 31 2022 using VLT/FORS, achieving a higher S/N of 75 over a total integration time of 500 s. Our high-S/N spectrum revealed additional spectral features, including CaIG, Mgb, and NaID absorption lines, along with [OIII]a, [OIII]b, [NII]a, Hα, and [NII]b emission lines. This analysis confirmed the redshift of the source as z = 0.2358 ± 0.0002. The spectrum is presented in Figure 3 (middle panel of the third row).
5.27 NVSS J194455-214320
Rajagopal et al. (2021) studied NVSS J194455-214320 with the Blanco 4-m Telescope, analysing its optical spectrum and placing a lower limit on its redshift of z > 0.41 based on the detection of MgI and CaFe absorption lines. Subsequently, García-Pérez et al. (2023) observed this source with the SOAR telescope to measure the redshift, determining it to be z = 0.426 ± 0.001. Our observations of this source were conducted with SALT/RSS on June 5, 2021, July 10, 2021, and July 12, 2021, with an exposure time of 2250 s per session, achieving a high S/N of 76. From our spectra, we identified CaHK, CaIG, and Mgb absorption lines at a redshift of z = 0.4263 ± 0.0003. The spectrum is shown in Figure 3 (right panel, third row).
5.28 NVSS J224753+441317
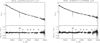
Featureless, low-S/N spectra for this source were previously reported by Shaw et al. (2013b) and Massaro et al. (2015b). In Paper II, we conducted observations of this source using the Lick/KAST spectrograph, accumulating a total exposure time of 7200 s, but the resulting spectrum remained featureless. An imaging redshift estimate of z = 0.34 ± 0.07, derived from observations with the Nordic Optical Telescope (NOT), was proposed by Nilsson et al. (2024). We observed NVSS J224753+441317 on October 15, 2021 with Keck/ESI for a total exposure time of 6300 s and obtained a high S/N of 133. However, our spectrum lacked significant features (see Figure 4, left panel). We performed simple simulations that show that this non-detection is compatible with the above imaging redshift estimate provided that the Rc absolute magnitude of the galaxy is fainter than −23.0.
5.29 1RXS J2304371+370506
A featureless, low-S/N spectrum was previously obtained and analysed by Shaw et al. (2013b). In Paper II, we reported two spectra of 1RXS J230437.1+370506, acquired with Lick/KAST on August 30, 2019 and July 21, 2020, with S/N values of 33 and 16, respectively, both of which were featureless. In this work, we observed its spectrum using Keck/ESI on October 15, 2021, achieving a significantly improved S/N with a total exposure time of 6300 s. The resulting high-S/N (∼95) spectrum and the redshift remains unknown, shown in the right panel of Figure 4, remains featureless.
Comparison with ZTF light curves in the r band.
6 Comparison with ZTF and ASAS-SN light curves
Spectroscopic observations made during the photometric minimum can benefit from the reduced non-thermal emission from the jet at this time, enabling the host galaxy features to become more visible, which are then used to determine the redshifts (see e.g. Becerra González et al. 2021; Goldoni et al. 2021; D’Ammando et al. 2024). We obtained the long-term light curves from ZTF (Masci et al. 2019)16 and All-Sky Automated Survey for SuperNovae (ASAS-SN) (Shappee et al. 2014; Kochanek et al. 2017)17. Our goal was to determine whether our spectroscopic measurements were conducted during high-, intermediate-, or low-activity states and to assess the impact of activity levels on redshift measurement efficiency.
We briefly summarise the characteristics of these two surveys. The ZTF, which uses the 48-inch Oschin Schmidt telescope at Palomar Observatory, achieves a sensitivity of r∼20.6 (5σ in 30 seconds) with a pixel scale of 1″, although its coverage is primarily limited to the northern hemisphere. In contrast, ASAS-SN reaches a sensitivity of g∼ 18 (5σ in 5 minutes) with a pixel scale of 8″ and provides full-sky coverage through its global network. When ZTF measurements are available, they are preferred due to their lower uncertainties. If ZTF light curves were not available, we checked for the presence of ASAS-SN light curves.
The ZTF light curves for NVSS J105534-012617, 4C +29.48, and NVSS J184919-164723 have been rejected by our analysis. NVSS J105534-012617 is discarded due to an insufficient number of data points and the absence of nearby observations within 100 days. 4C +29.48 is omitted due to poor data quality, primarily due to its weakness. NVSS J184919-164723 is rejected due to contamination by a neighbouring star. The ASAS-SN light curves for SUMSS J052542-601341, NVSS J080405-362919, NVSS J084121-355506, NVSS J105534-012617, IRXS J130737.8-425940, PMN J1544-6641, NVSS J163750-344915, and NVSS J182338-345412 have been excluded due to unreliability caused by contamination from nearby sources. Additionally, the light curves for NVSS J184919-164723 and IRXS J194422.6-452326 are not available in ASAS-SN. Tables 2 and 3 show the time intervals between the spectroscopic measurements and the closest observational data collected by ZTF and ASAS-SN, respectively. These tables also provide the observed magnitudes, along with the median, maximum, and minimum magnitudes calculated over the entire period covered by ZTF and ASAS-SN, as well as the redshift or its lower limit determined in this study.
In our comparison with ZTF light curves, 13 out of 16 objects have been observed at magnitudes comparable to or greater than the median magnitude (indicating a fainter or low state). Among these 13 blazars, we have determined the redshifts for four sources through spectroscopic observations. The remaining three sources have been observed at magnitudes lower than the median (indicating a brighter or high state), with the redshift of one source successfully determined.
In comparison with ASAS-SN light curves, one out of two sources has been observed in a low state, while the other has been observed in a high state. We have measured the redshifts for both sources.
Observed source counts, redshift values, and lower limit measurements (uncertain results in parentheses) for different source groups from Paper I, Paper II, Paper III, Goldoni et al. (2024), and the current study (Paper IV).
7 Conclusions
Measurement of the redshifts of a significant number of Fermi -LAT-detected blazars with a hard LAT spectrum is crucial, as they are strong candidates for CTAO observations. In this study, 29 BL Lac objects from the 3FHL catalogue, identified as promising targets for future CTAO observations, were observed using the VLT, Keck II, and SALT telescopes. Among these 29 sources, we determined spectroscopic redshifts for 12 sources with values ranging from 0.1635 to 1.1427, which is the highest spectroscopically determined redshift in the sample. Furthermore, we identified two lower limits for redshifts: z > 1.0196 and z > 1.4454. Examining the quality of the collected spectra, 9 out of 29 BL Lacs have a high S/N. However, redshift measurements were obtained for only 1 of these 9 objects. For the remaining 20 sources, the S/N values ranged from 3 to 100, categorised as low or moderate, from which 11 firm redshifts and 2 lower limits were derived.
As was previously noted in Papers II and III, achieving a high S/N is essential but not always sufficient for determining redshifts. The level of non-thermal jet emission often plays an even more critical role in feature detection. To assess the activity levels of the AGNs in our sample, we collected ZTF and ASAS-SN light curves corresponding to the timing of our spectroscopic observations. Considering the 18 sources with reliable photometry near the date of spectroscopy (see Tables 2 and 3), 14 were in low state and 5 redshifts were measured while 4 were in high state and 1 redshift was measured. In this sample there is thus an indication that redshift determination efficiency is better in a low state. Moreover, if we add to these our previous results in paper III, we have measured 12/26 redshifts in a low state and 2/11 in a high state. Overall our results suggest that observations in the low state tend to facilitate redshift determination.
The median redshift from the new observations,  = 0.36, is comparable to the value reported in Paper II (
 = 0.37) and Paper III (
 = 0.39), but higher than the value in Paper I (
 = 0.21). We also calculated the combined results of the program to date, taking into account repeated observations (see Table 4). In this study, we re-observed RXJ0338.4+1302, RX J0819.2-0756 (confirming its tentative redshift from Paper II), and NVSS J163750-344915. As a result, only one tentative redshift remains (B2 0557+38 from Paper III), and no tentative lower limits remain. To date, 90 independent targets have been observed, achieving 49 firm redshifts with an efficiency of approximately 54% and a median redshift of
  = 0.32.
We have compared our redshift measurements with the upper limit redshift estimates derived using the EBL-attenuation method by Domínguez et al. (2024). Our analysis indicated that the redshifts of three sources - NVSS J182338-345412, NVSS J192502+28154, and 1RXS J194422.6-452326 - are broadly consistent with their respective upper limits of  ,
,  , and
, and  . The combined distribution of the red-shift measurements and lower limits from Papers I, II, III, and IV is presented in the left panel of Figure 5. In total, redshifts were determined for 49 BL Lacs and lower limits were obtained for eight sources, with median values of 0.32 and 0.63, respectively. The right panel of this figure shows the redshift distribution reported by Shaw et al. (2013b), which provides redshift estimates for 92 BL Lacs and lower limits for 74 BL Lacs, with the corresponding median values of 0.32 and 0.70. The notable difference in the number of lower limits between the two samples is likely due to the selection criteria: our work targeted harder, brighter blazars expected to be detectable by CTAO, and the sources with redshift lower limits are generally more distant, resulting in their lower representation in our sample. In contrast, Shaw et al. (2013b) constructed their sample based on the redshift completeness of BL Lacs from the second catalogue of AGNs detected by Fermi-LAT (2LAC; Ackermann et al. 2011).
In this study, we have identified a firm redshift of z > 0.3 for eight sources. Previously, Paper I reported three sources (two firm redshifts and one tentative redshift), Paper II reported nine sources (eight firm and one tentative redshift), and Paper III reported ten sources (nine firm and one tentative redshift). Overall, 27 firm redshifts and one tentative redshift at z > 0.3 have been determined, with the tentative redshifts from Paper I and Paper II now confirmed in Paper III and this study, respectively. These sources represent a valuable set of potential teraelectronvolt emitters at z > 0.3, suitable for observations by VHE ground-based facilities such as CTAO. They play a crucial role in helping us understand the luminosity function of BL Lac objects and in EBL studies. As such, this redshift measurement campaign is essential for supporting future CTAO observations of AGNs (e.g. Abdalla et al. 2021).
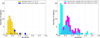 |
Fig. 5 Combined distribution of redshift measurements and lower limits from Papers I, II, III, and IV, shown in yellow and blue, respectively (left panel). In the right panel, spectroscopic redshifts and redshift lower limits distribution for BL Lacs, reported by Shaw et al. (2013b), are represented in cyan and magenta, respectively. |
Acknowledgements
We sincerely thank the anonymous referee for providing constructive feedback that helped to enhance the manuscript. This research utilised the CTA instrument response functions provided by the CTA Consortium and Observatory. For further details, please refer to https://doi.org/1Q.5281/zenodo.5163272 (version prod3b-v2). We sincerely acknowledge the financial support from the agencies and organisations acknowledged here: http://www.cta-observatory.org/consortium_acknowledgments, with special thanks to the U.S. National Science Foundation Grant PHY-2011420. The authors acknowledge and respect the deep cultural significance and reverence that the summit of Maunakea has always had within the indigenous Hawaiian community. We appreciate the privilege of conducting observations from this mountain. Some of the observations presented in this paper were obtained using the Southern African Large Telescope (SALT). This research has made use of the SIMBAD database, operated at CDS, Strasbourg, France. B.R. gratefully acknowledges support from the ANID BASAL project FB210003 and FONDECYT Postdoctorado 3230631. W.M. also acknowledges support from the ANID BASAL project FB210003. U.B. acknowledges a CNPq Productivity Grant nr. 309053/2022-6 and a FAPERJ Cientista Nosso Estado Grant nr. E-26/200.532/2023. The work of B.H. was supported by The National Research Foundation of Ukraine (project 2023.03/0149), Ukraine.
References
- Abdalla, H., Abe, H., Acero, F., et al. 2021, J. Cosmology Astropart. Phys., 2021, 048 [Google Scholar]
- Abdo, A. A., Ackermann, M., Ajello, M., et al. 2010, Nature, 463, 919 [NASA ADS] [CrossRef] [Google Scholar]
- Abramowski, A., Acero, F., Aharonian, F., et al. 2013, Phys. Rev. D, 88, 102003 [NASA ADS] [Google Scholar]
- Ackermann, M., Ajello, M., Allafort, A., et al. 2011, ApJ, 743, 171 [Google Scholar]
- Ackermann, M., Anantua, R., Asano, K., et al. 2016, ApJ, 824, L20 [NASA ADS] [CrossRef] [Google Scholar]
- Aharonian, F. A., Coppi, P. S., & Voelk, H. J. 1994, ApJ, 423, L5 [NASA ADS] [CrossRef] [Google Scholar]
- Aharonian, F., Akhperjanian, A. G., Bazer-Bachi, A. R., et al. 2006, A&A, 457, 899 [NASA ADS] [CrossRef] [EDP Sciences] [Google Scholar]
- Aharonian, F., Akhperjanian, A. G., Bazer-Bachi, A. R., et al. 2007, ApJ, 664, L71 [NASA ADS] [CrossRef] [Google Scholar]
- Ajello, M., Gasparrini, D., Romani, R. W., & Shaw, M. S. 2014, in American Astronomical Society Meeting Abstracts, 224, 410.09 [Google Scholar]
- Ajello, M., Atwood, W. B., Baldini, L., et al. 2017, ApJS, 232, 18 [Google Scholar]
- Aleksic, J., Ansoldi, S., Antonelli, L. A., et al. 2016a, Astropart. Phys., 72, 76 [NASA ADS] [CrossRef] [Google Scholar]
- Aleksic, J., Ansoldi, S., Antonelli, L. A., et al. 2016b, Astropart. Phys., 72, 61 [NASA ADS] [CrossRef] [Google Scholar]
- Álvarez Crespo, N., Massaro, F., Milisavljevic, D., et al. 2016, AJ, 151, 95 [CrossRef] [Google Scholar]
- Alves Batista, R., Saveliev, A., & de Gouveia Dal Pino, E. M. 2019, MNRAS, 489, 3836 [Google Scholar]
- Angel, J. R. P., & Stockman, H. S. 1980, A&A, 18, 321 [Google Scholar]
- Angelakis, E., Hovatta, T., Blinov, D., et al. 2016, MNRAS, 463, 3365 [NASA ADS] [CrossRef] [Google Scholar]
- Antonucci, R. 1993, A&A, 31, 473 [Google Scholar]
- Appenzeller, I., Fricke, K., Fürtig, W., et al. 1998, The Messenger, 94, 1 [NASA ADS] [Google Scholar]
- Atwood, W. B., Abdo, A. A., Ackermann, M., et al. 2009, ApJ, 697, 1071 [CrossRef] [Google Scholar]
- Ballet, J., Bruel, P., Burnett, T. H., Lott, B., & The Fermi-LAT collaboration 2023, arXiv e-prints [arXiv:2307.12546] [Google Scholar]
- Becerra González, J., Acosta-Pulido, J. A., Boschin, W., et al. 2021, MNRAS, 504, 5258 [CrossRef] [Google Scholar]
- Biteau, J., & Williams, D. A. 2015, ApJ, 812, 60 [CrossRef] [Google Scholar]
- Blandford, R., Meier, D., & Readhead, A. 2019, A&A, 57, 467 [Google Scholar]
- Blandford, R. D., & Königl, A. 1979, ApJ, 232, 34 [Google Scholar]
- Bruzual, G., & Charlot, S. 2003, MNRAS, 344, 1000 [NASA ADS] [CrossRef] [Google Scholar]
- Burgh, E. B., Nordsieck, K. H., Kobulnicky, H. A., et al. 2003, SPIE Conf. Ser., 4841, 1463 [NASA ADS] [Google Scholar]
- Chang, Y. L., Arsioli, B., Giommi, P., Padovani, P., & Brandt, C. H. 2019, A&A, 632, A77 [NASA ADS] [CrossRef] [EDP Sciences] [Google Scholar]
- Cherenkov Telescope Array Consortium (Acharya, B. S., et al.) 2019, Science with the Cherenkov Telescope Array [Google Scholar]
- D’Ammando, F., Goldoni, P., Max-Moerbeck, W., et al. 2024, A&A, 683, A222 [NASA ADS] [CrossRef] [EDP Sciences] [Google Scholar]
- de Vaucouleurs, G. 1948, Ann. Astrophys., 11, 247 [Google Scholar]
- de Vaucouleurs, G. 1953, MNRAS, 113, 134 [NASA ADS] [CrossRef] [Google Scholar]
- Di Gesu, L., Donnarumma, I., Tavecchio, F., et al. 2022, ApJ, 938, L7 [CrossRef] [Google Scholar]
- Di Gesu, L., Marshall, H. L., Ehlert, S. R., et al. 2023, Nat. Astron., 7, 1245 [NASA ADS] [CrossRef] [Google Scholar]
- Domínguez, A., Primack, J. R., Rosario, D. J., et al. 2011, MNRAS, 410, 2556 [Google Scholar]
- Domínguez, A., Láinez, M., Paliya, V. S., et al. 2024, MNRAS, 527, 4763 [Google Scholar]
- Donath, A., Terrier, R., Remy, Q., et al. 2023, A&A, 678, A157 [NASA ADS] [CrossRef] [EDP Sciences] [Google Scholar]
- Durrer, R., & Neronov, A. 2013, A&A Rev., 21, 62 [Google Scholar]
- Dwek, E., & Krennrich, F. 2013, Astropart. Phys., 43, 112 [NASA ADS] [CrossRef] [Google Scholar]
- Falomo, R., Pian, E., & Treves, A. 2014, A&A Rev., 22, 73 [Google Scholar]
- Fraija, N., Benítez, E., Hiriart, D., et al. 2017, ApJS, 232, 7 [Google Scholar]
- Gabányi, K. É., Frey, S., & An, T. 2018, A&A, 612, A109 [NASA ADS] [CrossRef] [EDP Sciences] [Google Scholar]
- Gaia Collaboration (Vallenari, A., et al.) 2023, A&A, 674, A1 [NASA ADS] [CrossRef] [EDP Sciences] [Google Scholar]
- García-Pérez, A., Peña-Herazo, H. A., Massaro, F., et al. 2023, AJ, 165, 127 [CrossRef] [Google Scholar]
- Gehrels, N., Chincarini, G., Giommi, P., et al. 2004, ApJ, 611, 1005 [Google Scholar]
- Goldoni, P., Pita, S., Boisson, C., et al. 2021, A&A, 650, A106 [NASA ADS] [CrossRef] [EDP Sciences] [Google Scholar]
- Goldoni, P., Boisson, C., Pita, S., et al. 2024, A&A, 691, L5 [NASA ADS] [CrossRef] [EDP Sciences] [Google Scholar]
- Greiner, J., Bornemann, W., Clemens, C., et al. 2008, PASP, 120, 405 [Google Scholar]
- Holder, J., Atkins, R. W., Badran, H. M., et al. 2006, Astropart. Phys., 25, 391 [NASA ADS] [CrossRef] [Google Scholar]
- Hovatta, T., & Lindfors, E. 2019, New A Rev., 87, 101541 [NASA ADS] [CrossRef] [Google Scholar]
- Jenniskens, P., & Desert, F. X. 1994, A&AS, 106, 39 [NASA ADS] [Google Scholar]
- Jones, D. H., Read, M. A., Saunders, W., et al. 2009, MNRAS, 399, 683 [Google Scholar]
- Kasai, E., Goldoni, P., Pita, S., et al. 2023, MNRAS, 518, 2675 [Google Scholar]
- Kaur, A., Rau, A., Ajello, M., et al. 2017, ApJ, 834, 41 [Google Scholar]
- Kifune, T. 1999, ApJ, 518, L21 [Google Scholar]
- Kochanek, C. S., Shappee, B. J., Stanek, K. Z., et al. 2017, PASP, 129, 104502 [Google Scholar]
- Koljonen, K. I. I., Lindfors, E., Nilsson, K., Heinämäki, P., & Kotilainen, J. 2024, MNRAS, 531, 5084 [Google Scholar]
- Kügler, S. D., Nilsson, K., Heidt, J., Esser, J., & Schultz, T. 2014, A&A, 569, A95 [NASA ADS] [CrossRef] [EDP Sciences] [Google Scholar]
- Li, W., Filippenko, A. V., Chornock, R., & Jha, S. 2003, PASP, 115, 844 [CrossRef] [Google Scholar]
- Liodakis, I., Marscher, A. P., Agudo, I., et al. 2022, Nature, 611, 677 [CrossRef] [Google Scholar]
- Lister, M. L., Aller, M., Aller, H., et al. 2011, ApJ, 742, 27 [CrossRef] [Google Scholar]
- Mannucci, F., Basile, F., Poggianti, B. M., et al. 2001, MNRAS, 326, 745 [Google Scholar]
- Marais, J. P., & van Soelen, B. 2024, MNRAS, 532, 4785 [Google Scholar]
- Marchesini, E. J., Masetti, N., Chavushyan, V., et al. 2016, A&A, 596, A10 [NASA ADS] [CrossRef] [EDP Sciences] [Google Scholar]
- Marchesini, E. J., Peña-Herazo, H. A., Álvarez Crespo, N., et al. 2019, Ap&SS, 364, 5 [NASA ADS] [CrossRef] [Google Scholar]
- Masci, F. J., Laher, R. R., Rusholme, B., et al. 2019, PASP, 131, 018003 [Google Scholar]
- Masetti, N., Sbarufatti, B., Parisi, P., et al. 2013, A&A, 559, A58 [NASA ADS] [CrossRef] [EDP Sciences] [Google Scholar]
- Massaro, E., Maselli, A., Leto, C., et al. 2015a, Ap&SS, 357, 75 [Google Scholar]
- Massaro, F., Landoni, M., D’Abrusco, R., et al. 2015b, A&A, 575, A124 [NASA ADS] [CrossRef] [EDP Sciences] [Google Scholar]
- Mead, A. R. G., Ballard, K. R., Brand, P. W. J. L., et al. 1990, A&AS, 83, 183 [Google Scholar]
- Meyer, M., Scargle, J. D., & Blandford, R. D. 2019, ApJ, 877, 39 [Google Scholar]
- Mirizzi, A., Raffelt, G. G., & Serpico, P. D. 2007, Phys. Rev. D, 76, 023001 [Google Scholar]
- Mullaney, J. R., Alexander, D. M., Fine, S., et al. 2013, MNRAS, 433, 622 [Google Scholar]
- Nievas Rosillo, M., Domínguez, A., Chiaro, G., et al. 2022, MNRAS, 512, 137 [NASA ADS] [CrossRef] [Google Scholar]
- Nilsson, K., Pursimo, T., Heidt, J., et al. 2003, A&A, 400, 95 [NASA ADS] [CrossRef] [EDP Sciences] [Google Scholar]
- Nilsson, K., Fallah Ramazani, V., Lindfors, E., et al. 2024, A&A, 691, A154 [NASA ADS] [CrossRef] [EDP Sciences] [Google Scholar]
- Oke, J. B., Cohen, J. G., Carr, M., et al. 1995, PASP, 107, 375 [Google Scholar]
- Osterbrock, D. E., & Ferland, G. J. 2006, Astrophysics of Gaseous Nebulae and Active Galactic Nuclei (University Science Books, California, USA) [Google Scholar]
- Padovani, P., Resconi, E., Giommi, P., Arsioli, B., & Chang, Y. L. 2016, MNRAS, 457, 3582 [Google Scholar]
- Padovani, P., Alexander, D. M., Assef, R. J., et al. 2017, A&A Rev., 25, 2 [NASA ADS] [CrossRef] [Google Scholar]
- Paiano, S., Falomo, R., Franceschini, A., Treves, A., & Scarpa, R. 2017, ApJ, 851, 135 [NASA ADS] [CrossRef] [Google Scholar]
- Paiano, S., Falomo, R., Treves, A., & Scarpa, R. 2020, MNRAS, 497, 94 [CrossRef] [Google Scholar]
- Peña-Herazo, H. A., Marchesini, E. J., Álvarez Crespo, N., et al. 2017, Ap&SS, 362, 228 [CrossRef] [Google Scholar]
- Peña-Herazo, H. A., Amaya-Almazán, R. A., Massaro, F., et al. 2020, A&A, 643, A103 [NASA ADS] [CrossRef] [EDP Sciences] [Google Scholar]
- Pita, S., Goldoni, P., Boisson, C., et al. 2014, A&A, 565, A12 [NASA ADS] [CrossRef] [EDP Sciences] [Google Scholar]
- Punsly, B., Marziani, P., Berton, M., & Kharb, P. 2020, ApJ, 903, 44 [NASA ADS] [CrossRef] [Google Scholar]
- Rajagopal, M., Kaur, A., Ajello, M., et al. 2020, ApJ, 898, 18 [NASA ADS] [CrossRef] [Google Scholar]
- Rajagopal, M., Marchesi, S., Kaur, A., et al. 2021, ApJS, 254, 26 [Google Scholar]
- Richards, J. L., Max-Moerbeck, W., Pavlidou, V., et al. 2011, ApJS, 194, 29 [Google Scholar]
- Salamon, M. H., Stecker, F. W., & de Jager, O. C. 1994, ApJ, 423, L1 [Google Scholar]
- Sembach, K. R., & Savage, B. D. 1992, ApJS, 83, 147 [NASA ADS] [CrossRef] [Google Scholar]
- Shappee, B. J., Prieto, J. L., Grupe, D., et al. 2014, ApJ, 788, 48 [Google Scholar]
- Shaw, M. S., Filippenko, A. V., Romani, R. W., Cenko, S. B., & Li, W. 2013a, AJ, 146, 127 [NASA ADS] [CrossRef] [Google Scholar]
- Shaw, M. S., Romani, R. W., Cotter, G., et al. 2013b, ApJ, 764, 135 [NASA ADS] [CrossRef] [Google Scholar]
- Sheinis, A. I., Bolte, M., Epps, H. W., et al. 2002, PASP, 114, 851 [Google Scholar]
- Singha, M., Husemann, B., Urrutia, T., et al. 2022, A&A, 659, A123 [NASA ADS] [CrossRef] [EDP Sciences] [Google Scholar]
- Spitzer, L. 1978, Physical Processes in the Interstellar Medium (New Jersey, USA: Wiley Publishing) [Google Scholar]
- Stocke, J. T., Morris, S. L., Gioia, I. M., et al. 1991, ApJS, 76, 813 [Google Scholar]
- Titov, O., Pursimo, T., Johnston, H. M., et al. 2017, AJ, 153, 157 [Google Scholar]
- Tsarevsky, G., de Freitas Pacheco, J. A., Kardashev, N., et al. 2005, A&A, 438, 949 [NASA ADS] [CrossRef] [EDP Sciences] [Google Scholar]
- Ulrich, M.-H., Maraschi, L., & Urry, C. M. 1997, A&A, 35, 445 [NASA ADS] [CrossRef] [Google Scholar]
- Urry, C. M., & Padovani, P. 1995, PASP, 107, 803 [NASA ADS] [CrossRef] [Google Scholar]
- Urry, C. M., Scarpa, R., O’Dowd, M., et al. 2000, ApJ, 532, 816 [NASA ADS] [CrossRef] [Google Scholar]
- Vermeulen, R. C., & Cohen, M. H. 1994, ApJ, 430, 467 [NASA ADS] [CrossRef] [Google Scholar]
- Wagner, S. J., & Witzel, A. 1995, A&A, 33, 163 [Google Scholar]
- Wakely, S. P., & Horan, D. 2008, in International Cosmic Ray Conference, 3, 1341 [Google Scholar]
- Wills, B. J., Thompson, K. L., Han, M., et al. 1995, ApJ, 447, 139 [NASA ADS] [CrossRef] [Google Scholar]
Echellette Spectrograph and Imager (ESI) on the Keck II telescope, https://www.keckobservatory.org/about/telescopes-instrumentation
Robert Stobie Spectrograph (RSS) on the Southern African Large Telescope (SALT), www.salt.ac.za/telescope
FOcal Reducer and low dispersion Spectrograph (FORS) on the Very Large Telescope (VLT), https://www.eso.org/sci/facilities/paranal/instruments/fors.html
A =  where λ25 and λ80 are the central wavelengths measured at 25% and 80% of the line flux level.
Appendix
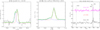 |
Fig. A.1 Left panel : Zoom-in on the [OII] λ 3727 feature detected in 4C +29.48 with Keck/ESI. As a single Gaussian cannot fit this feature, we fitted the two components of the doublets: λ 3726 (blue line) and λ 3729 (red line), with two gaussians. The sum of the two gaussians is shown by the green line. The intensity ratio of the two lines, F(λ 3729)/F(λ 3726), is ~ 1.3 which is consistent with a thin plasma (see Section 5.14). Centre panel : Zoom-in on the [OIII] λ 5007 feature detected in PMN J0622-2605 with VLT/FORS2. A single Gaussian cannot fit this feature, and there is a clear flux excess on the blue side as is frequently seen in this line. The excess is typically attributed to gas outflow (see, e.g. Singha et al. 2022). We thus fit two Gaussians to the profile, obtaining an acceptable χ2/dof of 1.8. The stronger Gaussian is at the redshift of the system, while the weaker one is offset by −540 ± 40 km/s. The widths of the two Gaussians are 360 ± 10 km/s and 460 ± 50 km/s, respectively (see Section 5.5). Right panel : Normalised spectra (offset for clarity) of NVSS J182338-345412 obtained with VLT/FORS2 using Grism 600 (upper, magenta line) and Grism 300 (lower, black line). Overplotted are the features clearly identified in the spectra. The spectra are consistent. In the Grism 300 spectrum [NII] λ 6548 and Hα are detected additionally, suggesting slight variability in the non-thermal component between the two observations. |
Technical specifications of the spectrographs used in this study.
Equivalent widths in Å of the main absorption features detected in the spectra at the measured redshift for each source.
Equivalent width in Å of the main emission features detected in the spectra at the measured redshift.
Equivalent width in Å of the emission lines detected in 1RXS J194422.6-452326.
All Tables
Observed source counts, redshift values, and lower limit measurements (uncertain results in parentheses) for different source groups from Paper I, Paper II, Paper III, Goldoni et al. (2024), and the current study (Paper IV).
Equivalent widths in Å of the main absorption features detected in the spectra at the measured redshift for each source.
Equivalent width in Å of the main emission features detected in the spectra at the measured redshift.
All Figures
|
Fig. 1 Flux-calibrated and normalised spectra of the first nine sources in Table A.1. Each panel contains the spectrum and in some cases also a continuum and galaxy model for each source. Each panel has two parts. Upper: flux-calibrated and telluric-corrected spectrum (black) alongside the best fit model (red). The flux is in units of 10−16 erg cm−2 s−1Å−1. The elliptical galaxy component is shown in green. We note that the plots are in observer frame and in logarithmic units, therefore different parts of the galaxy template are visible in each plot. The fits to intervening absorption systems are shown in magenta. Lower: normalised spectrum with labels for the detected spectral features. Atmospheric telluric absorption features are indicated by the symbol ⊕ and Galactic absorption features are labelled ‘MW’ and ‘DIB’. |
| In the text | |
|
Fig. 5 Combined distribution of redshift measurements and lower limits from Papers I, II, III, and IV, shown in yellow and blue, respectively (left panel). In the right panel, spectroscopic redshifts and redshift lower limits distribution for BL Lacs, reported by Shaw et al. (2013b), are represented in cyan and magenta, respectively. |
| In the text | |
|
Fig. A.1 Left panel : Zoom-in on the [OII] λ 3727 feature detected in 4C +29.48 with Keck/ESI. As a single Gaussian cannot fit this feature, we fitted the two components of the doublets: λ 3726 (blue line) and λ 3729 (red line), with two gaussians. The sum of the two gaussians is shown by the green line. The intensity ratio of the two lines, F(λ 3729)/F(λ 3726), is ~ 1.3 which is consistent with a thin plasma (see Section 5.14). Centre panel : Zoom-in on the [OIII] λ 5007 feature detected in PMN J0622-2605 with VLT/FORS2. A single Gaussian cannot fit this feature, and there is a clear flux excess on the blue side as is frequently seen in this line. The excess is typically attributed to gas outflow (see, e.g. Singha et al. 2022). We thus fit two Gaussians to the profile, obtaining an acceptable χ2/dof of 1.8. The stronger Gaussian is at the redshift of the system, while the weaker one is offset by −540 ± 40 km/s. The widths of the two Gaussians are 360 ± 10 km/s and 460 ± 50 km/s, respectively (see Section 5.5). Right panel : Normalised spectra (offset for clarity) of NVSS J182338-345412 obtained with VLT/FORS2 using Grism 600 (upper, magenta line) and Grism 300 (lower, black line). Overplotted are the features clearly identified in the spectra. The spectra are consistent. In the Grism 300 spectrum [NII] λ 6548 and Hα are detected additionally, suggesting slight variability in the non-thermal component between the two observations. |
| In the text | |
Current usage metrics show cumulative count of Article Views (full-text article views including HTML views, PDF and ePub downloads, according to the available data) and Abstracts Views on Vision4Press platform.
Data correspond to usage on the plateform after 2015. The current usage metrics is available 48-96 hours after online publication and is updated daily on week days.
Initial download of the metrics may take a while.