Fig. A.1
Download original image
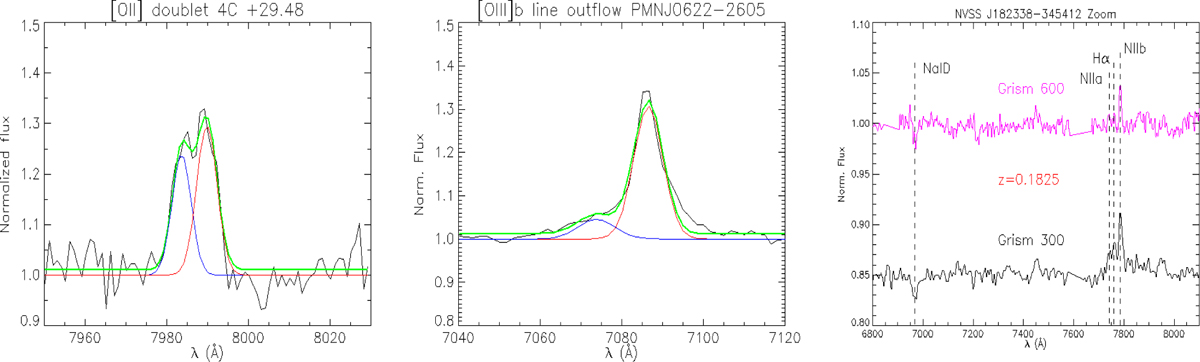
Left panel : Zoom-in on the [OII] λ 3727 feature detected in 4C +29.48 with Keck/ESI. As a single Gaussian cannot fit this feature, we fitted the two components of the doublets: λ 3726 (blue line) and λ 3729 (red line), with two gaussians. The sum of the two gaussians is shown by the green line. The intensity ratio of the two lines, F(λ 3729)/F(λ 3726), is ~ 1.3 which is consistent with a thin plasma (see Section 5.14). Centre panel : Zoom-in on the [OIII] λ 5007 feature detected in PMN J0622-2605 with VLT/FORS2. A single Gaussian cannot fit this feature, and there is a clear flux excess on the blue side as is frequently seen in this line. The excess is typically attributed to gas outflow (see, e.g. Singha et al. 2022). We thus fit two Gaussians to the profile, obtaining an acceptable χ2/dof of 1.8. The stronger Gaussian is at the redshift of the system, while the weaker one is offset by −540 ± 40 km/s. The widths of the two Gaussians are 360 ± 10 km/s and 460 ± 50 km/s, respectively (see Section 5.5). Right panel : Normalised spectra (offset for clarity) of NVSS J182338-345412 obtained with VLT/FORS2 using Grism 600 (upper, magenta line) and Grism 300 (lower, black line). Overplotted are the features clearly identified in the spectra. The spectra are consistent. In the Grism 300 spectrum [NII] λ 6548 and Hα are detected additionally, suggesting slight variability in the non-thermal component between the two observations.
Current usage metrics show cumulative count of Article Views (full-text article views including HTML views, PDF and ePub downloads, according to the available data) and Abstracts Views on Vision4Press platform.
Data correspond to usage on the plateform after 2015. The current usage metrics is available 48-96 hours after online publication and is updated daily on week days.
Initial download of the metrics may take a while.