Fig. 11
Download original image
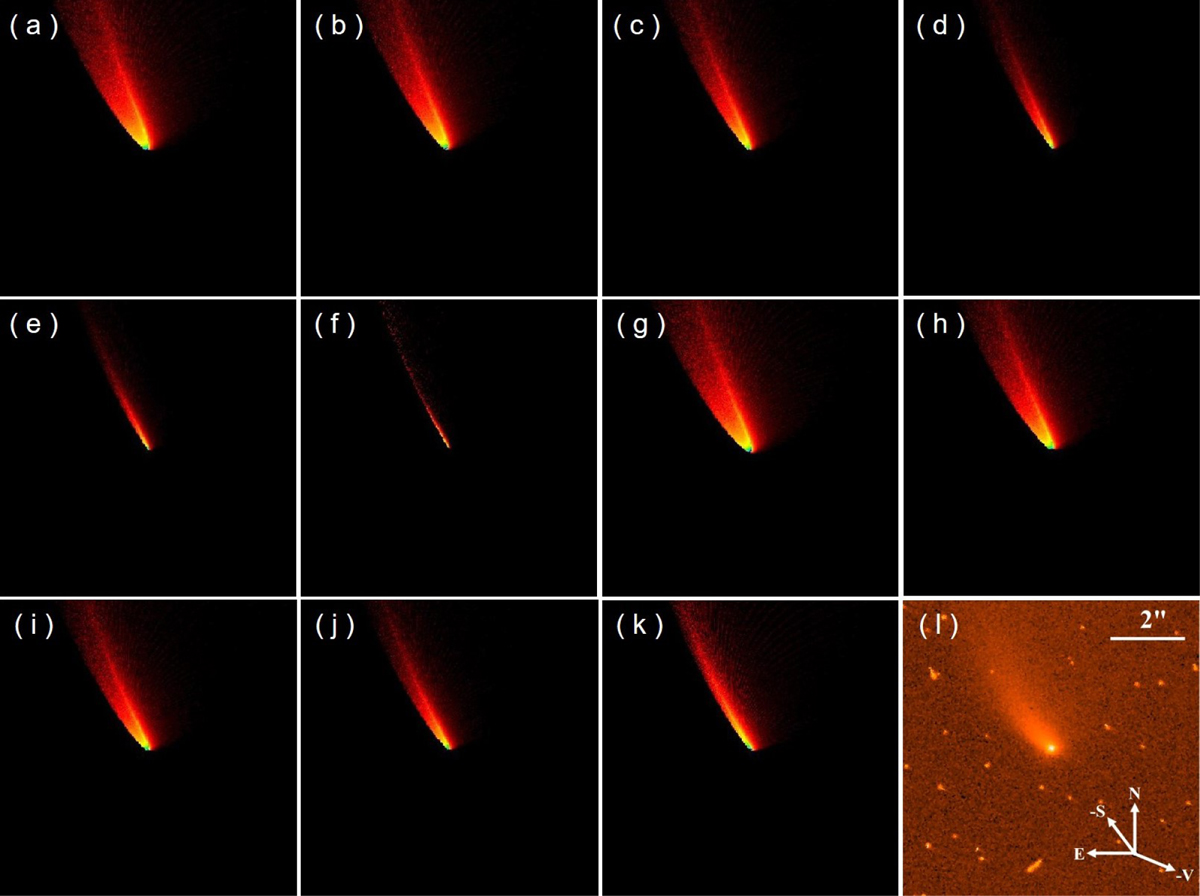
Simulation results and observation image of the dust tail on October 23, 2013. Panels a-f show simulated dust tails with an ecliptic longitude of a rotation axis of 70°, and local latitudes of 40°, 50°, 60°, 70°, 80°, and 90°, respectively. Panels g-k show simulated dust tails with an ecliptic longitude of a rotation axis of 250°, and local latitudes of −40°,−50°,−60°,−70°, and −80°, respectively. Panel 1 is an observational image from the Hubble telescope (program number 13475; Jewitt et al. 2015b). The direction of the antisolar vector (-S), the direction of the anti-velocity vector (-V), the northern direction (N), the eastern direction (E), and the scale bar are marked in panel 1.
Current usage metrics show cumulative count of Article Views (full-text article views including HTML views, PDF and ePub downloads, according to the available data) and Abstracts Views on Vision4Press platform.
Data correspond to usage on the plateform after 2015. The current usage metrics is available 48-96 hours after online publication and is updated daily on week days.
Initial download of the metrics may take a while.