| Issue |
A&A
Volume 704, December 2025
|
|
|---|---|---|
| Article Number | A124 | |
| Number of page(s) | 10 | |
| Section | Planets, planetary systems, and small bodies | |
| DOI | https://doi.org/10.1051/0004-6361/202556433 | |
| Published online | 09 December 2025 | |
Orientation of the rotation axis and the location of water-ice sublimation activity of the main-belt comet 313P/Gibbs
1
School of Aeronautics and Astronautics, Shenzhen Campus of Sun Yat-sen University,
Shenzhen,
Guangdong 518107,
China
2
Shenzhen Key Laboratory of Intelligent Microsatellite Constellation, Shenzhen Campus of Sun Yat-sen University,
Shenzhen,
Guangdong 518107,
China
3
State Key Laboratory of Lunar and Planetary Sciences, Macau University of Science and Technology,
Taipa,
Macau 999078,
PR China
4
National Key Laboratory of Materials Behavior and Evaluation Technology in Space Environments, Lanzhou Institute of Physics,
Lanzhou
730000,
China
5
State Key Laboratory of Atmospheric Environment and Extreme Meteorology, Institute of Atmospheric Physics, Chinese Academy of Sciences,
Beijing
100029,
China
★ Corresponding author: This email address is being protected from spambots. You need JavaScript enabled to view it.
Received:
16
July
2025
Accepted:
24
October
2025
Abstract
Context. The dust ejection activity of main-belt comet 313P/Gibbs is driven by water-ice sublimation, and the distribution of water-ice sublimation activity is nonuniform around perihelion, which may be related to seasonal modulation driven by the orientation of the rotation axis.
Aims. We aim to estimate the orientation of the rotation axis of 313P and the location of water-ice sublimation on the surface of the nucleus.
Methods. We used a thermophysical model of the nucleus to calculate its surface temperature distribution under various orientations of the rotation axis, aiming to identify the orientation that best matches the observational data. The position of water-ice sublimation on the surface of the cometary nucleus was estimated by fitting the simulated full width at half maximum of the dust tail to the observed data.
Results. The water-ice sublimation rate of 313P is estimated to be about QH2O ≈ 4.2 × 10²⁰ molecules m−2 s−1 (corresponding to 1.3 × 10⁻⁵ kg m−2 s−1). The spin vector of the rotation axis of 313P is located approximately at an ecliptic longitude of 70° with an ecliptic latitude in the range of [0°, 25°], or at an ecliptic longitude of 250° with an ecliptic latitude in the range of [0°, 45°]. The local latitude of water-ice sublimation activity on the surface of the nucleus is 50° (corresponding to an ecliptic longitude of the rotation axis of 70°) or −53° (corresponding to an ecliptic longitude of the rotation axis of 250°).
Key words: methods: numerical / comets: general / minor planets, asteroids: general / comets: individual: 313P/Gibbs
© The Authors 2025
 Open Access article, published by EDP Sciences, under the terms of the Creative Commons Attribution License (https://creativecommons.org/licenses/by/4.0), which permits unrestricted use, distribution, and reproduction in any medium, provided the original work is properly cited.
This article is published in open access under the Subscribe to Open model. This email address is being protected from spambots. You need JavaScript enabled to view it. to support open access publication.
1 Introduction
Main-belt comets are special objects located in the main asteroid belt that exhibit comet-like activity due to sublimation (Jewitt & Hsieh 2022). This duality suggests a potential link in composition or origin between asteroids and comets (Hsieh & Jewitt 2006). As a result, they have attracted increasing attention in the fields of planetary science and deep space exploration. As the third known main-belt comet to display dust ejection over successive orbital periods (Hui & Jewitt 2015; Pozuelos et al. 2015), 313P/Gibbs (hereafter referred to as 313P) offers further evidence for sustained comet-like activity within the main asteroid belt.
In September 2014, 313P was observed to exhibit cometary features (Gibbs et al. 2014). Over the following months, sustained dust ejection activity from 313P was continuously detected (Hsieh et al. 2015; Jewitt et al. 2015a). The persistence of this dust emission led to its classification as a main-belt comet. In fact, the dust emission activity of 313P was recorded by the Sloan Digital Sky Survey (SDSS) telescope (Gunn et al. 2006) as early as September 2003, but its cometary-like characteristics were not noticed at that time. However, Hsieh et al. (2015) analyzed archival observations of 313P from 2003 and found that the object already exhibited a diffuse dust tail produced by active dust ejection at that time. Subsequently, dust ejection activity of 313P was also observed in 2019 (Hsieh et al. 2023).
It is worth noting that, according to the statistical analysis of several observations of 313P by Hsieh et al. (2015), dust particles escaping from the main-belt comet nucleus due to the sublimation of water ice produce an observable coma and tail when the object is located at a true anomaly between −6.5° and 46.7° along its orbit. Meanwhile, the prediction based on observational data by Hsieh et al. (2015) suggested that dust emission activity of 313P may have already commenced when 313P reached the true anomaly of approximately −9°. These observational and predicted results indicate that the activity of 313P is not uniformly distributed around its perihelion. In order to explain this phenomenon, Hsieh et al. (2004) originally proposed a mechanism of seasonal modulation caused by the orientation of the rotation axis. Subsequent studies showed the activity strengths of some main-belt comets are systematically delayed with respect to perihelion, which is probably due to the propagation time required for a thermal wave driven by solar radiation to reach subsurface volatile reservoirs, causing a lag in the thermal response of these reservoirs (Hsieh et al. 2011; Hsieh & Sheppard 2015). Both mechanisms are possible explanations for the nonuniform activity distribution near perihelion for main-belt comets. In this paper, our work is based on the hypothesis of seasonal modulation.
The seasonal modulation in the surface activity of 313P’s nucleus implies certain constraints on the orientation of its rotation axis and the regions where its activity occurs. Prior to 313P, the nonuniform distribution of dust ejection activity around perihelion in the main-belt comet 133P/Elst-Pizarro (hereafter referred to as 133P) was regarded as a consequence of the seasonal modulation (Hsieh et al. 2010). Based on this mechanism, Hsieh et al. (2010) fit the observational data of 133P, and the fitting results were consistent with the observed light curve. Based on the work of Hsieh et al. (2010), Yu et al. (2020) constrained the orientation of the rotation axis of 133P and the local latitude range of the water-ice sublimation region from a thermodynamic perspective. In addition, Zhang & Hartzell (2024) used a 3D thermodynamic model to analyze the influence of the pole orientation and the location of active surface areas on the activity of 133P. These previous studies provide new insights and approaches for constraining the orientation of the rotation axis and the location of water-ice sublimation in main-belt comets.
In this work, we estimate the orientation of the rotation axis of the main-belt comet 313P/Gibbs from a thermophysical perspective and the location of water-ice sublimation activity through dynamical simulations based on available observational data. This paper is organized as follows. The thermophysical model of the nucleus surface and the dynamic model of dust particles in the coma and tail are presented in Sect. 2. In Sect. 3, the thermophysical simulation results of the nucleus surface are given and we explain how we estimated the orientation of the rotation axis. In Sect. 4, we discuss how the dynamics of dust particles in the coma and the morphology of the dust tail were simulated and how the location of water-ice sublimation was estimated. Further discussion is provided in Sect. 5. Finally, the conclusions are given in Sect. 6.
2 Method
2.1 Thermophysical model of the main-belt comet nucleus
Due to the current limitations of observational data for 313P, the shape of its nucleus remains unknown. Therefore, we assume that the nucleus of main-belt comet 313P is spherical with a radius R, and that an ice layer is located in the subsurface region of the nucleus (ice-dust mantle model) (e.g., Donn & Rahe 1982), the assumption of which has been applied to the main-belt comet 133P (Yu et al. 2020). The distance from the surface of the ice layer to the center of the nucleus is denoted as Rice, and the energy balance equation at the surface of the nucleus (x=R) reads
 (1)
where the left-hand side of the equation represents the energy of solar radiation, A is the albedo, F is the solar electromagnetic radiation flux density at 1 AU, rh is the heliocentric distance of the main-belt comet, and ϑ is the solar zenith angle. The first term on the right-hand side of the equation represents the blackbody thermal radiation from the surface of the nucleus, where ɛ is the blackbody emissivity, σ is the Stefan-Boltzmann constant, and T is the surface temperature. The second term on the right-hand side of the equation represents the inward heat conduction from the surface of the nucleus, where κd is the thermal conductivity of the nucleus, which depends on the physical properties of the nucleus material.
(1)
where the left-hand side of the equation represents the energy of solar radiation, A is the albedo, F is the solar electromagnetic radiation flux density at 1 AU, rh is the heliocentric distance of the main-belt comet, and ϑ is the solar zenith angle. The first term on the right-hand side of the equation represents the blackbody thermal radiation from the surface of the nucleus, where ɛ is the blackbody emissivity, σ is the Stefan-Boltzmann constant, and T is the surface temperature. The second term on the right-hand side of the equation represents the inward heat conduction from the surface of the nucleus, where κd is the thermal conductivity of the nucleus, which depends on the physical properties of the nucleus material.
The energy balance equation at the surface of the subsurface ice layer (x=Rice) is given by (Kuehrt & Keller 1994)
 (2)
Here, κi denotes the thermal conductivity of water ice, while L(T) and Z(T) represent the latent heat and the sublimation rate of water ice, respectively. We note that κi is a function of temperature. For T > 25 K, the thermal conductivity of water ice can be written as (Klinger 1980)
(2)
Here, κi denotes the thermal conductivity of water ice, while L(T) and Z(T) represent the latent heat and the sublimation rate of water ice, respectively. We note that κi is a function of temperature. For T > 25 K, the thermal conductivity of water ice can be written as (Klinger 1980)
 (3)
(3)
The latent heat of water ice is given by Lebofsky (1975) as follows:
 (4)
(4)
The sublimation rate of water ice was derived from the Hertz-Knudsen equation (Fanale & Salvail 1984),
 (5)
where mg is the mass of the water molecule and kB is the Boltzmann constant.
(5)
where mg is the mass of the water molecule and kB is the Boltzmann constant.
The heat conduction from the surface of the comet nucleus to the surface of the ice layer is described by the equation
 (6)
where c denotes the specific heat capacity of the cometary nucleus and ρnucleus represents its mass density.
(6)
where c denotes the specific heat capacity of the cometary nucleus and ρnucleus represents its mass density.
Equations (1) and (2) constitute the boundary conditions for solving the heat conduction equation (Eq. (6)). The Crank-Nicolson finite difference scheme was used to solve the heat conduction equation in order to obtain the variations in the sublimation rate of water ice and the surface temperature of the cometary nucleus as a function of the solar zenith angle. It is important to note that the resulting sublimation rate specifically corresponds to that at the surface of the ice layer.
2.2 Dynamical model of dust particles in the coma
At different distances from the surface of the cometary nucleus, the dominant forces acting on the dust particles are different. In the near-nucleus region of the main-belt comet (i.e., the coma), dust particles are primarily influenced by the drag force generated by the gas flow resulting from water-ice sublimation and the gravitational force of the cometary nucleus. The effects of solar gravity and solar radiation pressure are neglected. However, in the tail region, dust particles are primarily influenced by solar gravity, solar radiation pressure, and Poynting-Robertson drag (P-R drag).
Therefore, in the coma region, the acceleration of the dust particles reads
 (7)
where r is the position vector of the dust particle relative to the center of the cometary nucleus, r̈gas is the drag acceleration of the gas flow, and r̈nucleus is the gravitational acceleration. Here, the central body is the cometary nucleus.
(7)
where r is the position vector of the dust particle relative to the center of the cometary nucleus, r̈gas is the drag acceleration of the gas flow, and r̈nucleus is the gravitational acceleration. Here, the central body is the cometary nucleus.
In this paper, we assume that the dust particles are spherical with a radius of rdust. The drag acceleration of the gas flow is given by (Grun et al. 1989)
 (8)
Here, ρgas and vgas represent the density and velocity of the gas, respectively, ṙ is the velocity of the dust particles, and Cd is the gas drag coefficient. A constant drag coefficient Cd between 1 and 2 (e.g., Jewitt et al. 2016; Shi et al. 2018) was adopted to simplify calculations, which may slightly underestimate the gas drag force but this still results in values within the correct order of magnitude. In this paper, Cd is defined as (Marschall et al. 2016)
(8)
Here, ρgas and vgas represent the density and velocity of the gas, respectively, ṙ is the velocity of the dust particles, and Cd is the gas drag coefficient. A constant drag coefficient Cd between 1 and 2 (e.g., Jewitt et al. 2016; Shi et al. 2018) was adopted to simplify calculations, which may slightly underestimate the gas drag force but this still results in values within the correct order of magnitude. In this paper, Cd is defined as (Marschall et al. 2016)
 (9)
where Tdust and Tgas represent the temperatures of the dust particles and the gas, respectively. In this paper, we assume that Tdust=Tgas. The function erf(s) refers to the error function, with s defined as
(9)
where Tdust and Tgas represent the temperatures of the dust particles and the gas, respectively. In this paper, we assume that Tdust=Tgas. The function erf(s) refers to the error function, with s defined as
 (10)
(10)
As described in Sect. 2.1, the nonspherical effects of the cometary nucleus are neglected, and the gravitational acceleration can be written as
 (11)
where G is the gravitational constant and M is the mass of the cometary nucleus.
(11)
where G is the gravitational constant and M is the mass of the cometary nucleus.
In the dust tail region, the motion of dust particles is described in the heliocentric ecliptic coordinate system. The nongravitational acceleration of dust particles can be written as (Burns et al. 1979)
![Mathematical equation: $\ddot{\boldsymbol{r}}_{\mathrm{RP}}=\beta \frac{G M_{\odot}}{\left|\boldsymbol{r}_{\odot}\right|^{2}}\left[\left(1-\frac{\dot{\boldsymbol{r}}_{\odot}}{c}\right) \hat{\boldsymbol{S}}-\frac{\boldsymbol{r}_{\odot}}{c}\right],$](/articles/aa/full_html/2025/12/aa56433-25/aa56433-25-eq12.png) (12)
where r⊙ and ṙ⊙ denote the heliocentric position vector and the radial velocity magnitude of the dust particle, respectively, M⊙ is the mass of the Sun, c is the speed of light, and Ŝ is the unit vector representing the direction of incident solar radiation. The symbol β is the ratio of solar radiation pressure to solar gravitational force, as given by Finson & Probstein (1968),
(12)
where r⊙ and ṙ⊙ denote the heliocentric position vector and the radial velocity magnitude of the dust particle, respectively, M⊙ is the mass of the Sun, c is the speed of light, and Ŝ is the unit vector representing the direction of incident solar radiation. The symbol β is the ratio of solar radiation pressure to solar gravitational force, as given by Finson & Probstein (1968),
 (13)
where Cpr and Qpr denote the radiation pressure coefficient and the scattering efficiency for radiation pressure, respectively.
(13)
where Cpr and Qpr denote the radiation pressure coefficient and the scattering efficiency for radiation pressure, respectively.
The gravitational acceleration exerted by the Sun on dust particles has the same form as Eq. (11) and is therefore not repeated here. It is important to note that, in the coma region, the dust particle dynamical model is described in the coordinate system centered on the main-belt comet, whereas in the tail region, the dynamical model is described in the heliocentric coordinate system. Additionally, the values of the constants and relevant parameters used in the above models are listed in Table 1.
3 The orientation of the rotation axis of main-belt comet 313P
3.1 Simulation strategy
We used the thermophysical model in Sect. 2.1 to simulate the temperature variation on the surface of the cometary nucleus of 313P and the sublimation rate of the water ice at the subsurface ice front to estimate the orientation of the rotation axis of 313P. According to observational data from both ground-based telescopes and the Hubble Space Telescope, Hsieh et al. (2015), Hui & Jewitt (2015), and Jewitt et al. (2015a,b) estimated that for 313P the dust particle production rate is about 0.2−0.8 kg s−1, and the radii of dust particles are mainly distributed in the range of tens to hundreds of microns. The study by Pozuelos et al. (2015) indicated that the radius range of dust particles in the dust tail of 313P is broader, extending from 0.1−2000 μm.
Here in Sect. 3.1, we only consider the gas drag force and the gravity of the nucleus. Interparticle cohesive forces are not included in this work for simplicity, and such forces may slightly increase the minimum sublimation rate required for dust detachment. By equalizing the two terms r̈gas and r̈bucleus that are on the left sides of Eqs. (8) and (11), respectively, we obtain the dependence of the required minimum water sublimation rate on the given size of dust particles detached from the nucleus surface (Fig. 1). For 2000 μ m dust particles, the minimum sublimation rate of water ice required to initiate detachment from the cometary nucleus surface is QH2O ≈ 6.9 × 10¹⁹ molecules m−2 s−1 (corresponding to 2.1 × 10⁻⁶ kg m−2 s−1), a critical value that specifically corresponds to the minimum sublimation-driven force needed to counteract the local gravitational force. It should be noted that this value of QH2O is not sufficient for the dust particles to escape into the dust tail, since, under the influence of the nucleus gravity, the ejected particles may fall back onto the surface, or be confined within the Hill sphere of 313P. Here we assume that the dust particles with a radius of 2000 μ m ultimately escape into the dust tail if these particles can reach the boundary of 313P’s Hill sphere, for which the required minimum water-ice sublimation rate was calculated as QH2O ≈ 4.2 × 10²⁰ molecules m−2 s−1 (corresponding to 1.3 × 10⁻⁵ kg m−2 s−1). This value is consistent in order of magnitude with the gas production rate inferred from the dust production rate by Jewitt et al. (2015b). We used the ice-dust mantle model (see Sect. 2.1) to numerically calculate the production rate of water ice and the surface temperature of the cometary nucleus. In the ice-dust mantle model, the thickness of the dust mantle is taken as two seasonal thermal skin depths, because several seasonal thermal skin depths can maintain the dust mantle in a stable state (Yu et al. 2020). The seasonal thermal skin depth is defined as (Huebner et al. 2006)
 (14)
where Porbit denotes the orbital period of 313P, which is 5.62 years. The corresponding seasonal thermal skin depth of 313P was calculated to be d313P=0.323 m.
(14)
where Porbit denotes the orbital period of 313P, which is 5.62 years. The corresponding seasonal thermal skin depth of 313P was calculated to be d313P=0.323 m.
For a given surface temperature of the cometary nucleus, the variation in the water-ice sublimation rate with a depth of the subsurface ice layer (relative to the surface of the nucleus) is shown in Fig. 2. In the two-layer ice-dust mantle model, the sublimation rate of water ice of QH2O ≈ 4.2 × 10²⁰ molecules m−2 s−1 corresponds to a cometary nucleus surface temperature of T ≈ 208 K. This result is predicated on the assumption that all gas molecules sublimated from the water-ice layer traverse the overlying dust mantle and escape into the coma region without losses.
The orientation of the rotation axis of main-belt comet 313P (i.e., the spin-vector coordinate) is described by the ecliptic longitude and latitude in the Ecliptic J2000.0 coordinate system (Carry et al. 2010). Numerical simulations were performed to investigate how the average surface temperature across different local latitudes on the cometary nucleus of 313P varies with its orbital motion. The specific simulation strategy is as follows.
-
Orbital dynamics simulation of 313P.
The initial epoch of the orbital integration for comet 313P was chosen as 00:00:00 UTC on September 3, 2000 (i.e., JD 2451790.5), corresponding to 0:00 on the date of its last aphelion passage prior to the first observationally recorded dust emission event (Hsieh et al. 2015). The selected epoch is not of particular significance, and choosing a different initial epoch for the numerical integration would not alter the results. The orbital integration was performed over one full orbital period of 313P, and the output time step was set to the rotation period of 313P (assumed to be 4 hours, which has a negligible effect on the results). The simulation takes into account the gravitational force of the Sun, as well as the gravitational perturbations from Earth, Mars, and Jupiter. The initial orbital elements of these bodies are taken from the NASA JPL Horizons system1.
-
Thermophysical simulation of the surface of the cometary nucleus.
Concurrently with the orbital dynamics simulation, the thermophysical simulation was conducted over a complete rotational period of 313P, initiating at 12:00 local time. The simulation time step is 0.01 rotational periods, and the temperature of the cometary surface at different local latitudes was obtained at each time step.
-
Setting the spin-vector coordinates.
As mentioned above, the seasonal modulation and perihelion-asymmetric manifestation of dust ejection activity are a consequence of the distinct orientation of the rotation axis of 313P combined with the confinement of activity to specific surface regions. Therefore, in order to estimate the orientation of the rotation axis, we set the spin-vector coordinates of 313P with ecliptic longitude uniformly distributed from 0° to 350° at intervals of 10°, and ecliptic latitude uniformly distributed from 0° to 90° at intervals of 5°, resulting in a total of 684 combinations of [ecliptic longitude, ecliptic latitude].
Summary of the constant and parameter values in the thermophysical and dynamical models.
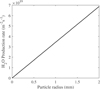 |
Fig. 1 Minimum water-ice production rate required for dust particle detachment from the nucleus surface as a function of particle radius. Here only the gas drag force and the gravity of the nucleus are considered. |
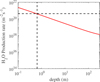 |
Fig. 2 Sublimation rate of water ice as a function of the distance from the ice front to the cometary nucleus surface. The solid red curve represents the variation of the water-ice production rate with the distance from the ice front to the surface at the temperature of 208 K. The horizontal dashed black line indicates the water-ice production rate of QH2O ≈ 4.2 × 10²⁰ molecules m−2 s−1, while the vertical dashed black line denotes the depth of 0.646 m, corresponding to two seasonal thermal skin depths below the surface. |
3.2 Results and analysis
Following the simulation strategy described in Sect. 3.1, we simulated the variation of the surface temperature at different local latitudes of the main-belt comet 313P as a function of the true anomaly under different [ecliptic longitude, ecliptic latitude] configurations. The simulation results indicate that when the ecliptic longitude of the spin-vector coordinate is approximately 70° with the ecliptic latitude in the range of [0°, 25°], or when the ecliptic longitude is approximately 250° with the ecliptic latitude in the range of [0°, 45°], the variation of the nucleus surface temperature along the orbit of the main-belt comet 313P around the Sun is consistent with observational data (specifically, water-ice sublimation activity occurs within the true anomaly range of −9 ∼ 46.7°). Specifically, all possible spin-vector coordinates of the rotation axis [ecliptic longitude, ecliptic latitude] are presented in Fig. 3.
The results of several sets of simulations with ecliptic longitudes of 70° and 250° and ecliptic latitudes of 0°, 25°, 65°, and 90° are shown in Figs. 4 and 5, respectively, where the seasonal variation on the surface of the cometary nucleus becomes more and more obvious as the ecliptic latitude increases at a given ecliptic longitude. In the case of Figs. 4 and 5, the sublimation activity of water ice can occur at a true anomaly of −9 ∼ 46.7° only when the ecliptic latitude of the rotation axis is less than 25° (70° for the ecliptic longitude) or 45° (250° for the ecliptic longitude). With the ecliptic latitude of the rotation axis greater than 25° (70° for the ecliptic longitude) or 45° (250° for the ecliptic longitude), 313P can exhibit seasonal variation. However, due to the low surface temperature of its nucleus, which leads to a low gas production rate, dust particles can neither escape from the nucleus surface, nor enter the coma and tail to form a recognizable dust tail. When the ecliptic latitude of the rotation axis is 90°, the rotation axis, being perpendicular to the ecliptic plane, cannot cause the cometary nucleus to exhibit seasonal effects in the variation of the surface temperature. However, in Figs. 4d and 5d, 313P can still exhibit weak seasonal variation in the polar regions, which is caused by the orbital inclination of 313P not being zero. In addition, in Figs. 4a, b and 5a, b, we can also see that the region where the sublimation activity of water ice occurs may be in the mid-latitudes and high latitudes of the cometary nucleus, but a more specific region has not been determined yet, which we subsequently analyze and discuss in Sect. 4.3.
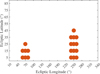 |
Fig. 3 All possible spin-vector coordinates for 313P found by modeling to produce variations of nucleus surface temperatures consistent with observations of visible sublimation activity. |
4 Dust dynamics and the location of water-ice sublimation activity
4.1 Gas expansion model of the coma
We ignore the effect of dust on gas molecules as the dust particles move through the coma and consider only the acceleration of the dust particles by the gas flow. As the gas sublimating at the ice front passes through the dust mantle and expands into space, the gas flow is in a nonequilibrium state. However, in order to briefly analyze the dynamic characteristics of dust particles in the coma, we used a simple gas expansion model to simulate the motion of the gas flow, that is, the region where the gas expands into the coma is considered to be a cone. In this model, the speed of the gas flow expanding outward is considered to be constant, which is a reasonable assumption for main-belt comets and comets, and the gas flow density decreases with increasing distance from the surface of the cometary nucleus, which is described by the equation (Fink et al. 2021)
 (15)
where rarea is the equivalent radius of the water-ice sublimation region, h is the height from the surface of the cometary nucleus, and θ is the half-opening angle of the cone. The variation of gas density with height for the water-ice sublimation rate of QH2O=4.2 × 10²⁰ molecules m−2 s−1, the cone angle of 60° in the region of gas expansion, and the gas velocity of vgas=500 m/s are shown in Fig. 6.
(15)
where rarea is the equivalent radius of the water-ice sublimation region, h is the height from the surface of the cometary nucleus, and θ is the half-opening angle of the cone. The variation of gas density with height for the water-ice sublimation rate of QH2O=4.2 × 10²⁰ molecules m−2 s−1, the cone angle of 60° in the region of gas expansion, and the gas velocity of vgas=500 m/s are shown in Fig. 6.
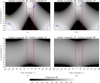 |
Fig. 4 Temperature cloud diagram of the cometary nucleus surface with an ecliptic longitude of 70° in the spin-vector coordinate of the rotation axis. The two solid red lines in the figure are the true anomaly equal to −9° and 46.7°, respectively, and the dashed blue line is the isotherm at the temperature of 208 K. Panels a-d: ecliptic latitude of the spin-vector coordinate of the rotation axis is 0°, 25°, 65°, and 90°, respectively. |
4.2 Terminal velocity of dust particles
Using the gas expansion model of Sect. 4.1, we calculated the motion of dust particles in the coma. The variation of the velocity with height from the surface of the cometary nucleus for dust particles with radii rdust=10, 100, and 1000 μm is shown in Fig. 7. After departing from the cometary nucleus surface, dust particles are accelerated by the gas flow. The smaller the particle radius is of the dust particles, the higher the altitude at which the particles reach their terminal velocity. For the dust particles of 10 μ m and 100 μ m, the distance to the surface of the cometary nucleus is about 6 km and 4 km, respectively, when it reaches 99% of its terminal velocity; whereas, for 1000 μ m dust particles, the distance is only about 0.6 km. Specifically, the terminal velocity of the dust particle versus height from the surface of the cometary nucleus is given in Fig. 7. Additionally, we fit the approximate analytical expression for the terminal velocity of dust particles as a function of the particle radius (Fig. 8), which reads
 (16)
(16)
4.3 The location of water-ice sublimation activity
In Sect. 3, we give a rough estimate for the location of the water-ice sublimation activity on the surface of 313P, which is located in the mid-latitude to high-latitude regions of the surface of the nucleus. In this section, we explain how we further estimated the location of the water-ice sublimation activity by calculating the morphological features of a dust tail at different local latitudes and fitting the simulated full width at half maximum (FWHM) of the morphology to the observed images. The morphology of dust tail was computed by using the COMTAILS code2, which is a Monte Carlo method for generating brightness images of dust tails. More details about the method can be found in Moreno (2009), Moreno et al. (2025), and Moreno (2025). In the simulation of Sect. 4.3, only solar gravity and radiation pressure are taken into account. The simulation settings are provided below.
The particle radius distribution of dust is in the range of 0.1–2000 μm and follows a power law distribution with an exponent of −3 (Pozuelos et al. 2015). The initial velocity magnitude of the dust particles is related to the particle radius and follows Eq. (16) with a random distribution for the velocity direction. The initial position of the dust particles is located on the spherical surface of the 313P Hill sphere. The location of water-ice sublimation activity was constrained by simulating dust tails with sublimation regions set at different local latitudes between 40° and 90° (negative values for the southern hemisphere) and by fitting the simulated results to the observed images of 313P.
We simulated the dust tail morphology at local latitudes in different water-ice sublimation regions for the observation date of October 28, 2014, with the spin vector of the rotation axis in ecliptic longitude at 70° and ecliptic latitude in the range of [0°, 25°], as well as ecliptic longitude at 250° and ecliptic latitude in the range of [0°, 45°], respectively. The simulation results show that the ecliptic latitude of the rotation axis has little effect on the dust tail morphology. Therefore, we only selected the simulation results with an ecliptic latitude of 20° for further analysis and discussion.
Figure 11 illustrates the morphology of the dust tail in the water-ice sublimation region at different local latitudes. As the local latitude increases (i.e., from mid-latitudes to high latitudes), the morphology of the dust tail changes noticeably, primarily manifesting as a progressive narrowing in its width. In this paper, the FWHM is used to characterize the width of the dust tail. As shown in Fig. 9, the FWHM of both sets of dust tails – corresponding to ecliptic longitudes of the rotation axis of 70° and 250° – gradually decreases as the local latitude increases from 40° to 90° (or decreases from −40° to −90°). The residuals between the FWHM of the simulation results and those of the observed dust-tail image are given in Fig. 10. As shown in Fig. 10, we find that the residuals of the FWHM are minimized at the local latitudes of 50° and −53° for ecliptic longitudes of the rotation axis of 70° and 250°, respectively. Therefore, the local latitude of the water-ice sublimation region is most likely to be 50° (for the ecliptic longitude of the rotation axis of 70°) or −53° (for the ecliptic longitude of the rotation axis of 250°).
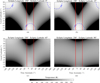 |
Fig. 5 Temperature cloud diagram of the cometary nucleus surface with an ecliptic longitude of 250° in the spin-vector coordinate of the rotation axis. The two solid red lines in the figure are the true anomaly equal to −9° and 46.7°, respectively, and the dashed blue line is the isotherm at a temperature of 208 K. Panels a-d: ecliptic latitude of the spin-vector coordinate of the rotation axis is 0°, 25°, 65°, and 90°, respectively. |
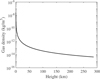 |
Fig. 6 Gas density of sublimated water ice as a function of altitude from the surface of the nucleus of main-belt comet 313P. |
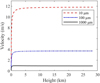 |
Fig. 7 Variation of the velocity of dust particles with different radii as a function of height above the nucleus surface. |
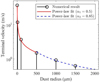 |
Fig. 8 Terminal velocity of dust particles as a function of particle radius, fitted with a broken power law. |
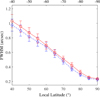 |
Fig. 9 Variation of the FWHM of the dust tail with local latitude. The dashed blue line with diamond markers corresponds to the ecliptic longitude of a rotation axis of 70°, with the local latitude ranging from 40° to 90°. The solid red line with circular markers corresponds to an ecliptic longitude of 250°, with the local latitude ranging from −40° to −90°. The vertical bars indicate the standard deviation of FWHM. |
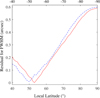 |
Fig. 10 Residual for FWHM of the dust tail between the simulation results and the observational image vs. local latitude. The dashed blue line corresponds to an ecliptic longitude of a rotation axis of 70°, with the local latitude ranging from 40° to 90°. The solid red line corresponds to an ecliptic longitude of 250°, with the local latitude ranging from −40° to −90°. |
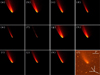 |
Fig. 11 Simulation results and observation image of the dust tail on October 23, 2013. Panels a-f show simulated dust tails with an ecliptic longitude of a rotation axis of 70°, and local latitudes of 40°, 50°, 60°, 70°, 80°, and 90°, respectively. Panels g-k show simulated dust tails with an ecliptic longitude of a rotation axis of 250°, and local latitudes of −40°,−50°,−60°,−70°, and −80°, respectively. Panel 1 is an observational image from the Hubble telescope (program number 13475; Jewitt et al. 2015b). The direction of the antisolar vector (-S), the direction of the anti-velocity vector (-V), the northern direction (N), the eastern direction (E), and the scale bar are marked in panel 1. |
5 Discussion
5.1 Seasonal modulation of main-belt comet activity
On the basis of the seasonal modulation hypothesis, our results indicate that the pole orientation of 313P is located at a low ecliptic latitude. Likewise, the direction of the rotational axis of 133P may also be located at a low ecliptic latitude (Yu et al. 2020; Zhang & Hartzell 2024). However, a low ecliptic latitude may not necessarily be a prerequisite since the occurrence of activity also depends on other factors, such as the location of sublimation areas on the nucleus surface, the thickness of the dust mantle, among others.
Furthermore, as can be seen in Figs. 4 and 5, sublimation activity can also occur around aphelion for 313P, which may be because regions with a high local latitude on the nucleus surface may experience a longer heating time around aphelion. However, to the best of our knowledge, so far no observational data have shown activities around aphelion for main-belt comets.
5.2 The production rate of water ice
Currently, the water sublimation rates for the main-belt comets 238P/Read and 358P/PANSTERRS have been measured, which are approximately 0.3 kg s−1 (Kelley et al. 2023) and 1.5 kg s−1 (Hsieh et al. 2025), respectively. For 313P, adopting the sublimating surface area (≈ 104 m2) estimated by Jewitt et al. (2015b), the resulting water production rate is QH2O ≈ 4.2 × 1024 molecules s−1 (corresponding to 0.13 kg s−1). This value is lower than that of the other two main-belt comets mentioned above, being approximately half of that for 238P and about one order of magnitude lower than that for 358 P. We do not find a clear correlation for water sublimation rates with nucleus sizes and orbital elements of main-belt comets (Table 2), possible reasons for which include differences in the dust mantle thickness and surface dust density for different main-belt comets, uncertainties as to our modeling, among others.
5.3 Impact of nucleus and dust densities
In order to evaluate the impact of the assumed bulk densities for the nucleus and dust particles, we also performed simulations for lower densities that are typical for classical comets (ρnucleus=500 kg m−3 and ρdust=1000 kg m−3). The simulation results show that for the lower-density case, the water production rate is QH2O ≈ 9 × 10¹⁹ molecules m−2 s−1 and the surface temperature is T ≈ 204 K, both of which are lower than those for the higher-density case (QH2O ≈ 4.2 × 10²⁰ molecules m−2 s−1, T ≈ 208 K). This is because, for lower densities of the nucleus and dust particles, dust particles of the same radius require a lower sublimation rate to escape from the nucleus surface. In addition, for the lower-density case, the spin vector consistent with the observed activity is located approximately at an ecliptic longitude of about 70° with an ecliptic latitude in the range of [0°, 30°], or at an ecliptic longitude of about 250° with an ecliptic latitude in the range of [0°, 50°]. The range of the spin-axis orientations for which is broader than that for the high-density case (an ecliptic longitude of 70° with an ecliptic latitude in the range of [0°, 25°], or at an ecliptic longitude of 250° with an ecliptic latitude in the range of [0°, 45°]). Furthermore, variations in dust density do not affect the fitted location of water-ice sublimation.
Orbital elements and nucleus radii of main-belt comets.
5.4 Comparisons with other studies
Yu et al. (2020) and Zhang & Hartzell (2024) investigated the orientation of the spin axis and the location of sublimation of the main-belt comet 133P by using one-dimensional and three-dimensional thermophysical models (by assuming 133P is a homogeneous ellipsoid), respectively. In the future, if the three-dimensional shape model of 313P is obtained, the method of Zhang & Hartzell (2024) can be applied to 313P and compared with our results. On the other hand, the method of fitting the simulated FWHM of the dust tail to the observed data presented in this paper can also provide constraints for the investigation of sublimation locations by Yu et al. (2020) and Zhang & Hartzell (2024). Despite using different methods, these three studies suggest that the pole orientations of both 313P and 133P are located at a low ecliptic latitude.
6 Conclusions
With this work, we have established a thermophysical model for the surface of the main-belt comet 313P/Gibbs nucleus and estimated that the water-ice sublimation rate of 313P is QH2O ≈ 4.2 × 10²⁰ molecules m−2 s−1. We calculated the temperature variation on the surface of the nucleus during the orbital period of 313P for different orientations of the rotation axis. The simulation results indicate that the spin vector of the rotation axis of 313P is located approximately either at an ecliptic longitude of 70° with an ecliptic latitude in the range of [0°, 25°], or at an ecliptic longitude of 250° with an ecliptic latitude in the range of [0°, 45°].
Meanwhile, we have established the dynamical model of dust particles in the coma of 313P and fit the dependence of terminal velocity on particle radius for a specified water-ice sublimation rate. For micron-sized dust particles, 99% of the terminal velocity is reached at distances of about 4−10 nucleus radii from the surface, while for particles with a diameter of 1 mm, this distance is less than one nucleus radius. In this model, the terminal velocity of dust particles is expressed approximately as a broken power law function of particle radius, as follows
 (17)
(17)
On this basis, we simulated the morphology of the dust tail in the water-ice sublimation activity at different local latitudes, and find that the width of the dust tail gradually narrows as the local latitude increases. Moreover, by fitting the FWHM of the simulated dust tails to the observed image, the results show that the water-ice sublimation activity is located at the local latitude of 50° (corresponding to an ecliptic longitude of the rotation axis of 70°) or −53° (corresponding to an ecliptic longitude of the rotation axis of 250°) on the surface of the nucleus.
Acknowledgements
This work was supported by the National Natural Science Foundation of China (Nos. 12472048 and 12311530055), the High-performance Computing Public Platform (Shenzhen Campus) of Sun Yat-Sen University, and the Shenzhen Science and Technology Program (Grant No. ZDSYS20210623091808026).
References
- Britt, D. T., Yeomans, D., Housen, K., & Consolmagno, G., 2002, in Asteroids III, eds. W. F. Bottke, Jr., A. Cellino, P. Paolicchi, & R. P. Binzel (University of Arizona Press), 485 [Google Scholar]
- Burns, J. A., Lamy, P. L., & Soter, S., 1979, Icarus, 40, 1 [Google Scholar]
- Carry, B., 2012, Planet. Space Sci., 73, 98 [CrossRef] [Google Scholar]
- Carry, B., Dumas, C., Kaasalainen, M., et al. 2010, Icarus, 205, 460 [NASA ADS] [CrossRef] [Google Scholar]
- Donn, B., & Rahe, J., 1982, in IAU Colloquium 61: Comet Discoveries, Statistics, and Observational Selection, ed. L. L., Wilkening (University of Arizona Press), 203 [Google Scholar]
- Fanale, F. P., & Salvail, J. R., 1984, Icarus, 60, 476 [NASA ADS] [CrossRef] [Google Scholar]
- Fink, U., Harris, W., Doose, L., et al. 2021, Planet. Sci. J., 2, 154 [NASA ADS] [CrossRef] [Google Scholar]
- Finson, M. L., & Probstein, R. F., 1968, ApJ, 154, 327 [NASA ADS] [CrossRef] [Google Scholar]
- Gibbs, A. R., Prystavski, T., Novichonok, A., et al. 2014, Central Bureau Electron. Telegrams, 3973, 1 [Google Scholar]
- Grun, E., Benkhoff, J., Fechtig, H., et al. 1989, Adv. Space Res., 9, 133 [NASA ADS] [CrossRef] [Google Scholar]
- Gunn, J. E., Siegmund, W. A., Mannery, E. J., et al. 2006, AJ, 131, 2332 [NASA ADS] [CrossRef] [Google Scholar]
- Hsieh, H. H., & Jewitt, D., 2006, Science, 312, 561 [NASA ADS] [CrossRef] [Google Scholar]
- Hsieh, H. H., & Sheppard, S. S., 2015, MNRAS, 454, L81 [CrossRef] [Google Scholar]
- Hsieh, H. H., Jewitt, D. C., & Fernández, Y. R., 2004, AJ, 127, 2997 [NASA ADS] [CrossRef] [Google Scholar]
- Hsieh, H. H., Jewitt, D., Lacerda, P., Lowry, S. C., & Snodgrass, C., 2010, MNRAS, 403, 363 [NASA ADS] [CrossRef] [Google Scholar]
- Hsieh, H. H., Meech, K. J., & Pittichová, J., 2011, ApJ, 736, L18 [NASA ADS] [CrossRef] [Google Scholar]
- Hsieh, H. H., Hainaut, O., Novaković, B., et al. 2015, ApJ, 800, L16 [NASA ADS] [CrossRef] [Google Scholar]
- Hsieh, H. H., Micheli, M., Kelley, M. S. P., et al. 2023, Planet. Sci. J., 4, 43 [NASA ADS] [CrossRef] [Google Scholar]
- Hsieh, H. H., Noonan, J. W., Kelley, M. S. P., et al. 2025, Planet. Sci. J., 6, 3 [Google Scholar]
- Huebner, W. F., Benkhoff, J., Capria, M.-T., et al., eds. 2006, Heat and Gas Diffusion in Comet Nuclei (ESA Publications Division, The Netherlands) [Google Scholar]
- Hui, M.-T., & Jewitt, D., 2015, AJ, 149, 134 [Google Scholar]
- Jewitt, D., & Hsieh, H. H., 2022, arXiv e-prints [arXiv:2203.01397] [Google Scholar]
- Jewitt, D., Agarwal, J., Peixinho, N., et al. 2015a, AJ, 149, 81 [Google Scholar]
- Jewitt, D., Li, J., Agarwal, J., et al. 2015b, AJ, 150, 76 [Google Scholar]
- Jewitt, D., Agarwal, J., Weaver, H., et al. 2016, AJ, 152, 77 [NASA ADS] [CrossRef] [Google Scholar]
- Kelley, M. S. P., Hsieh, H. H., Bodewits, D., et al. 2023, Nature, 619, 720 [NASA ADS] [CrossRef] [Google Scholar]
- Klinger, J., 1980, Science, 209, 271 [Google Scholar]
- Kuehrt, E., & Keller, H. U., 1994, Icarus, 109, 121 [NASA ADS] [CrossRef] [Google Scholar]
- Lebofsky, L. A., 1975, Icarus, 25, 205 [Google Scholar]
- Marschall, R., Su, C. C., Liao, Y., et al. 2016, A&A, 589, A90 [NASA ADS] [CrossRef] [EDP Sciences] [Google Scholar]
- Moreno, F., 2009, ApJS, 183, 33 [Google Scholar]
- Moreno, F., 2025, A&A, 695, A263 [NASA ADS] [CrossRef] [EDP Sciences] [Google Scholar]
- Moreno, F., Goetz, C., Aceituno, F. J., et al. 2025, MNRAS, 539, 949 [Google Scholar]
- Pozuelos, F. J., Cabrera-Lavers, A., Licandro, J., & Moreno, F., 2015, ApJ, 806, 102 [NASA ADS] [CrossRef] [Google Scholar]
- Shi, X., Hu, X., Mottola, S., et al. 2018, Nat. Astron., 2, 562 [NASA ADS] [CrossRef] [Google Scholar]
- Yu, L. L., Hsia, C. H., & Ip, W.-H. 2020, AJ, 159, 66 [NASA ADS] [CrossRef] [Google Scholar]
- Zhang, Y., & Hartzell, C. M., 2024, J. Geophys. Res.: Planets, 129, 2023JE008047 [Google Scholar]
All Tables
Summary of the constant and parameter values in the thermophysical and dynamical models.
All Figures
|
Fig. 1 Minimum water-ice production rate required for dust particle detachment from the nucleus surface as a function of particle radius. Here only the gas drag force and the gravity of the nucleus are considered. |
| In the text | |
|
Fig. 2 Sublimation rate of water ice as a function of the distance from the ice front to the cometary nucleus surface. The solid red curve represents the variation of the water-ice production rate with the distance from the ice front to the surface at the temperature of 208 K. The horizontal dashed black line indicates the water-ice production rate of QH2O ≈ 4.2 × 10²⁰ molecules m−2 s−1, while the vertical dashed black line denotes the depth of 0.646 m, corresponding to two seasonal thermal skin depths below the surface. |
| In the text | |
|
Fig. 3 All possible spin-vector coordinates for 313P found by modeling to produce variations of nucleus surface temperatures consistent with observations of visible sublimation activity. |
| In the text | |
|
Fig. 4 Temperature cloud diagram of the cometary nucleus surface with an ecliptic longitude of 70° in the spin-vector coordinate of the rotation axis. The two solid red lines in the figure are the true anomaly equal to −9° and 46.7°, respectively, and the dashed blue line is the isotherm at the temperature of 208 K. Panels a-d: ecliptic latitude of the spin-vector coordinate of the rotation axis is 0°, 25°, 65°, and 90°, respectively. |
| In the text | |
|
Fig. 5 Temperature cloud diagram of the cometary nucleus surface with an ecliptic longitude of 250° in the spin-vector coordinate of the rotation axis. The two solid red lines in the figure are the true anomaly equal to −9° and 46.7°, respectively, and the dashed blue line is the isotherm at a temperature of 208 K. Panels a-d: ecliptic latitude of the spin-vector coordinate of the rotation axis is 0°, 25°, 65°, and 90°, respectively. |
| In the text | |
|
Fig. 6 Gas density of sublimated water ice as a function of altitude from the surface of the nucleus of main-belt comet 313P. |
| In the text | |
|
Fig. 7 Variation of the velocity of dust particles with different radii as a function of height above the nucleus surface. |
| In the text | |
|
Fig. 8 Terminal velocity of dust particles as a function of particle radius, fitted with a broken power law. |
| In the text | |
|
Fig. 9 Variation of the FWHM of the dust tail with local latitude. The dashed blue line with diamond markers corresponds to the ecliptic longitude of a rotation axis of 70°, with the local latitude ranging from 40° to 90°. The solid red line with circular markers corresponds to an ecliptic longitude of 250°, with the local latitude ranging from −40° to −90°. The vertical bars indicate the standard deviation of FWHM. |
| In the text | |
|
Fig. 10 Residual for FWHM of the dust tail between the simulation results and the observational image vs. local latitude. The dashed blue line corresponds to an ecliptic longitude of a rotation axis of 70°, with the local latitude ranging from 40° to 90°. The solid red line corresponds to an ecliptic longitude of 250°, with the local latitude ranging from −40° to −90°. |
| In the text | |
|
Fig. 11 Simulation results and observation image of the dust tail on October 23, 2013. Panels a-f show simulated dust tails with an ecliptic longitude of a rotation axis of 70°, and local latitudes of 40°, 50°, 60°, 70°, 80°, and 90°, respectively. Panels g-k show simulated dust tails with an ecliptic longitude of a rotation axis of 250°, and local latitudes of −40°,−50°,−60°,−70°, and −80°, respectively. Panel 1 is an observational image from the Hubble telescope (program number 13475; Jewitt et al. 2015b). The direction of the antisolar vector (-S), the direction of the anti-velocity vector (-V), the northern direction (N), the eastern direction (E), and the scale bar are marked in panel 1. |
| In the text | |
Current usage metrics show cumulative count of Article Views (full-text article views including HTML views, PDF and ePub downloads, according to the available data) and Abstracts Views on Vision4Press platform.
Data correspond to usage on the plateform after 2015. The current usage metrics is available 48-96 hours after online publication and is updated daily on week days.
Initial download of the metrics may take a while.