Fig. 2
Download original image
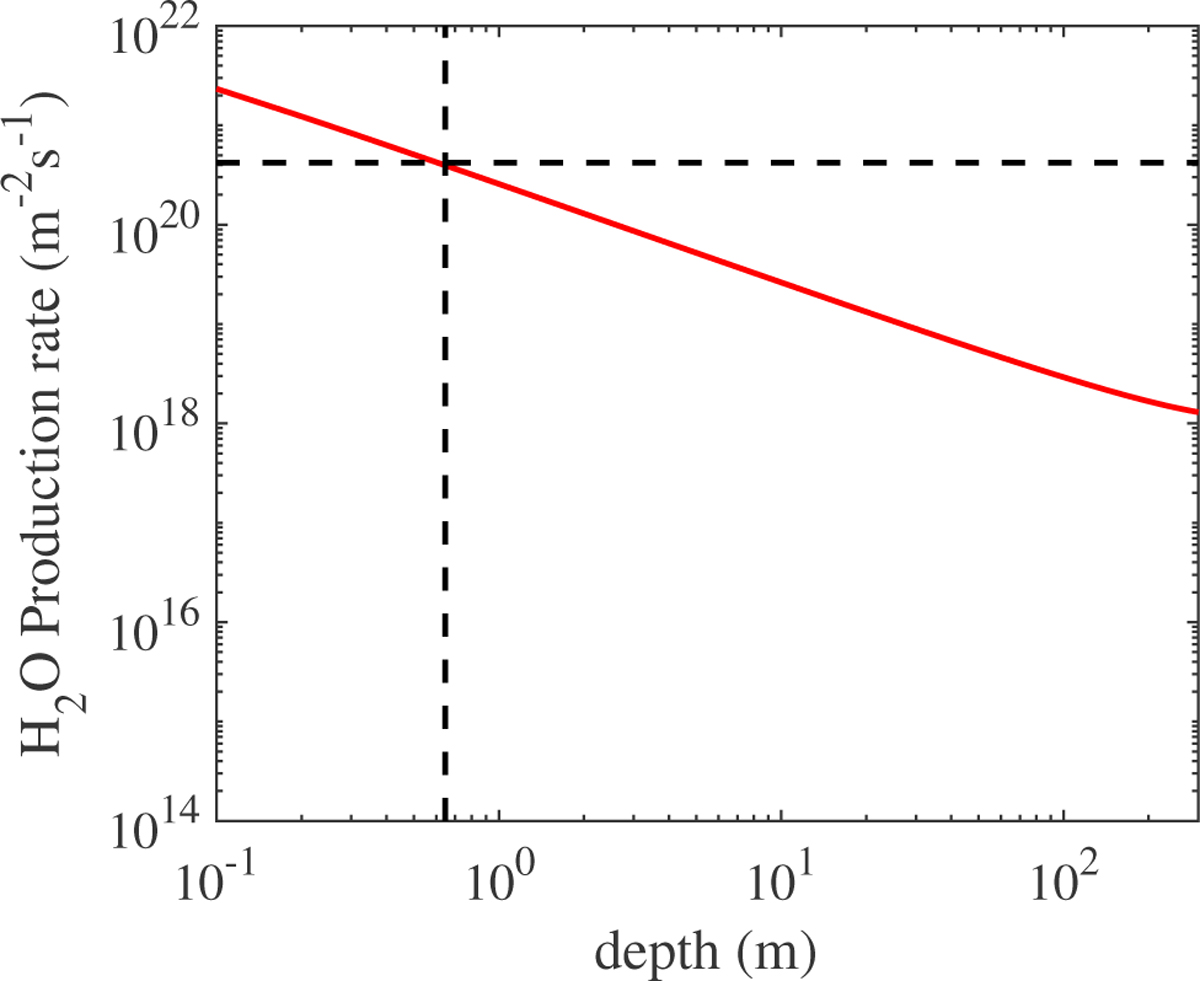
Sublimation rate of water ice as a function of the distance from the ice front to the cometary nucleus surface. The solid red curve represents the variation of the water-ice production rate with the distance from the ice front to the surface at the temperature of 208 K. The horizontal dashed black line indicates the water-ice production rate of QH2O ≈ 4.2 × 10²⁰ molecules m−2 s−1, while the vertical dashed black line denotes the depth of 0.646 m, corresponding to two seasonal thermal skin depths below the surface.
Current usage metrics show cumulative count of Article Views (full-text article views including HTML views, PDF and ePub downloads, according to the available data) and Abstracts Views on Vision4Press platform.
Data correspond to usage on the plateform after 2015. The current usage metrics is available 48-96 hours after online publication and is updated daily on week days.
Initial download of the metrics may take a while.