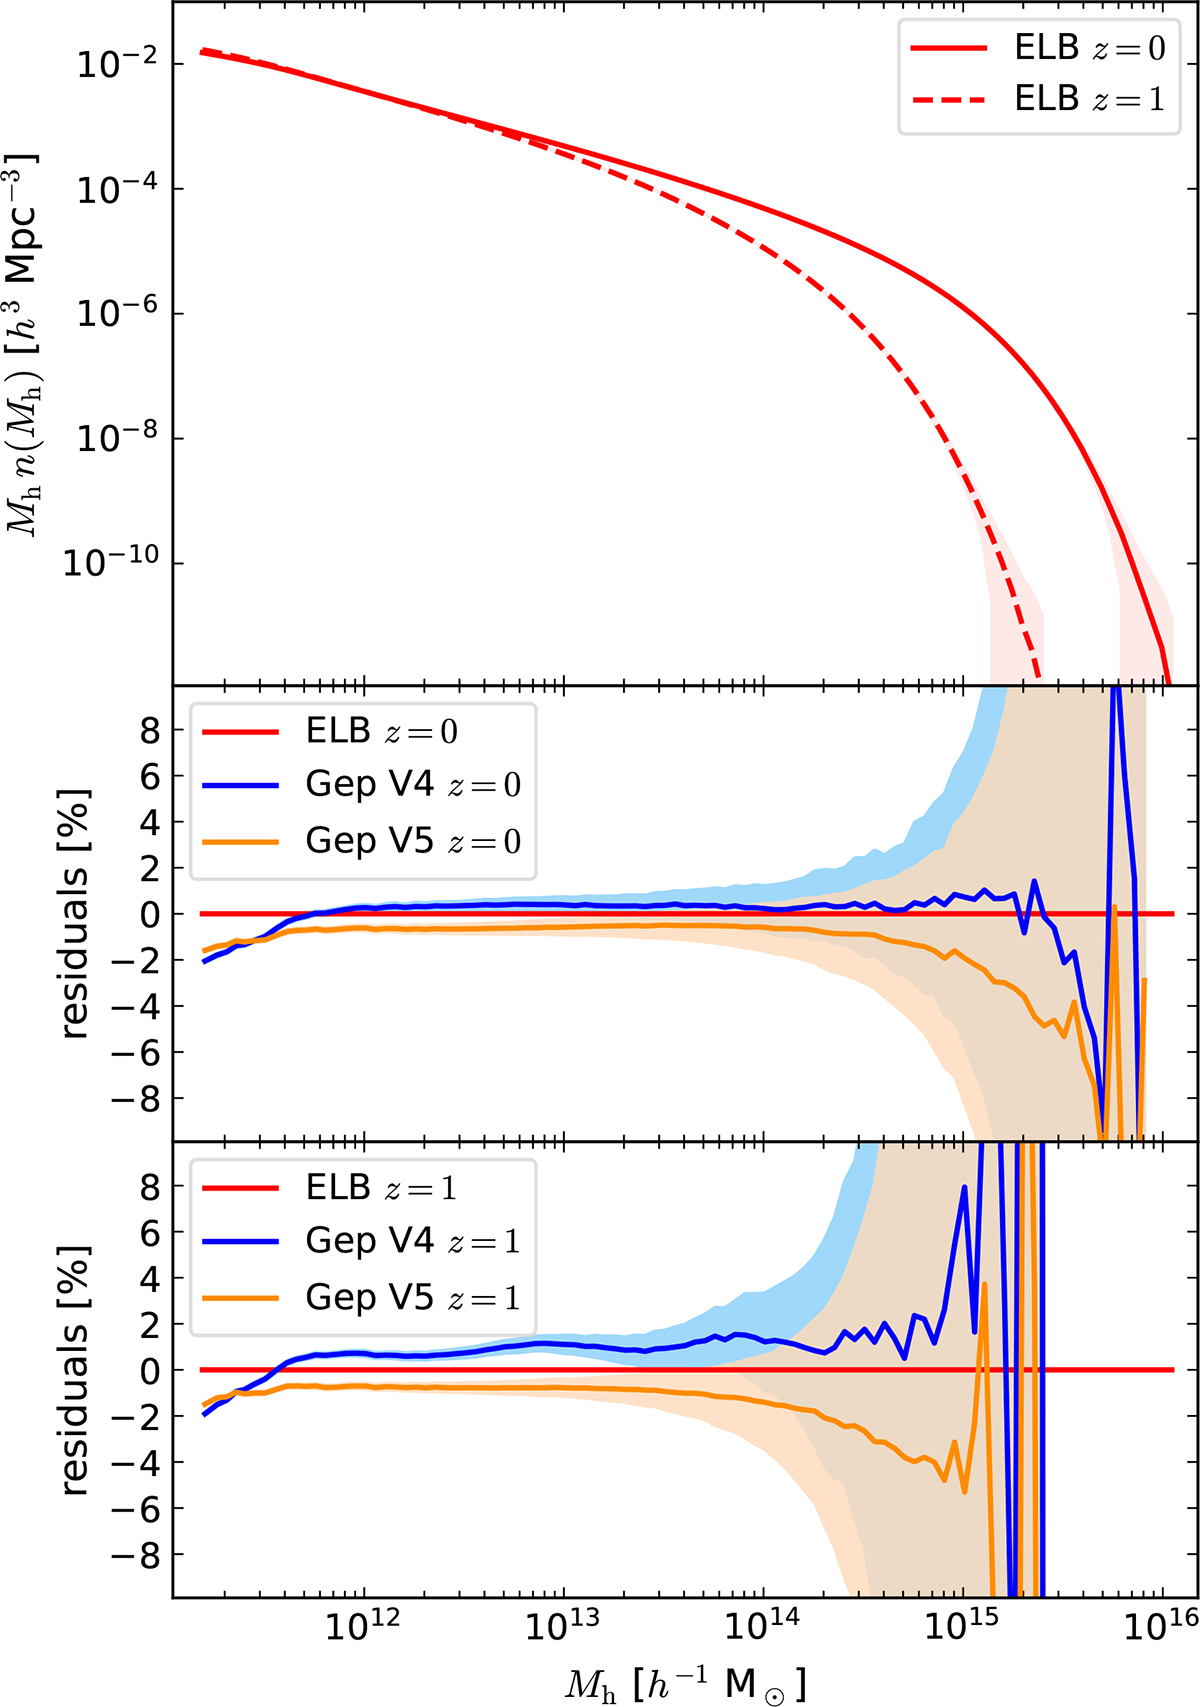
Fig. 2.
Download original image
Halo mass function n(Mh) of the simulated sets. The upper panel only shows the mass function of EuclidLargeBox (ELB) for z = 0 and z = 1, where the line gives the average over the 1000 simulations and the shaded area gives its sample variance. The two lower panels show relative residuals, n/nelb − 1 in percent, of the mass function of the first 600 Geppetto simulations, run with V4 of the code (Gep V4), and the other 2900, run with V5 (Gep V5), with respect to the EuclidLargeBox measurement, respectively at z = 0 (mid panel) and z = 1 (lower panel). Here the reported sample variance is relative only to the Geppetto sets.
Current usage metrics show cumulative count of Article Views (full-text article views including HTML views, PDF and ePub downloads, according to the available data) and Abstracts Views on Vision4Press platform.
Data correspond to usage on the plateform after 2015. The current usage metrics is available 48-96 hours after online publication and is updated daily on week days.
Initial download of the metrics may take a while.