Fig. 6.
Download original image
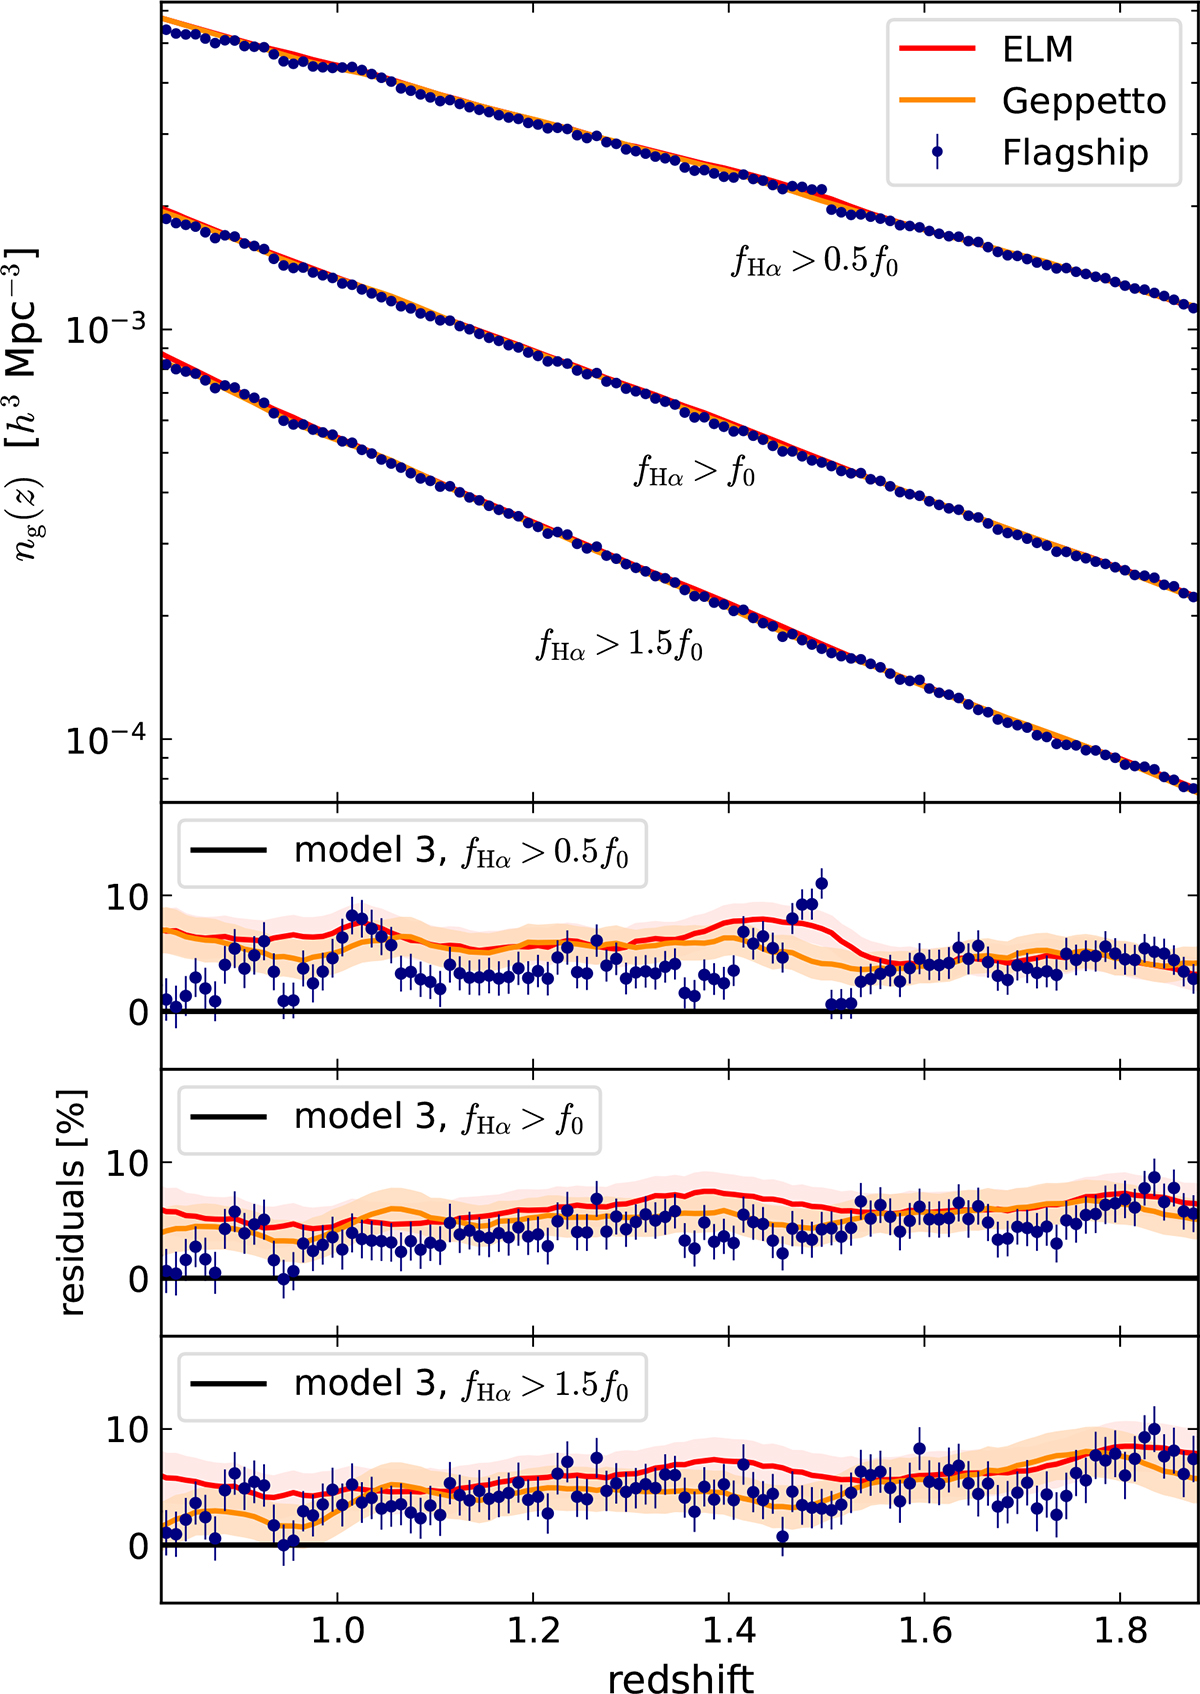
Comoving number density ng in h3 Mpc−3 of galaxies as a function of redshift for the Geppetto (orange) and EuclidLargeMocks (red) catalogues, compared with the Flagship catalogue (dark blue points). For the sets of Pinocchio catalogues we give the average number density as a continuous line and its standard deviation as a shaded area, while Flagship values, reported as circles, are assigned the EuclidLargeMocks variance, reported as an errorbar. We show in the top panel results for three limiting fluxes, fHα > 0.5f0, f0, and 1.5f0. The other panels give, for each limiting flux, the residuals (ng/nmodel 3 − 1) in percent of simulated number densities with respect to model 3 from Pozzetti et al. (2016). The black lines denote the zero value of the residuals.
Current usage metrics show cumulative count of Article Views (full-text article views including HTML views, PDF and ePub downloads, according to the available data) and Abstracts Views on Vision4Press platform.
Data correspond to usage on the plateform after 2015. The current usage metrics is available 48-96 hours after online publication and is updated daily on week days.
Initial download of the metrics may take a while.