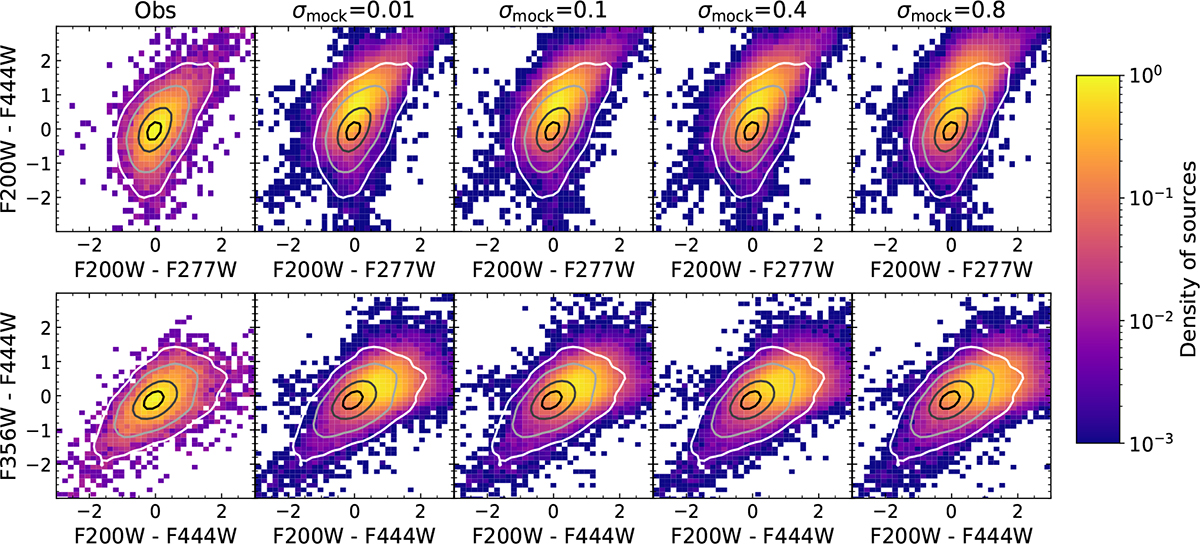
Fig. 2.
Download original image
Color-color diagram using JWST/NIRCam bands from the JADES catalog (left columns) and from the simulated catalogs (from second to last columns). These simulated catalogs are computed assuming, from left to right, σ of 0.01, 0.1, 0.4, and 0.8. The two different rows show the color-color diagram obtained with two different band combinations chosen to take into account redshift and parameter coverage to ease the comparison. The color lines show the contours that enclose the 16th, 50th, 84th, and 90th of the data in the observations. The implemented stochastic SFH can reproduce observed colors at z > 6.
Current usage metrics show cumulative count of Article Views (full-text article views including HTML views, PDF and ePub downloads, according to the available data) and Abstracts Views on Vision4Press platform.
Data correspond to usage on the plateform after 2015. The current usage metrics is available 48-96 hours after online publication and is updated daily on week days.
Initial download of the metrics may take a while.