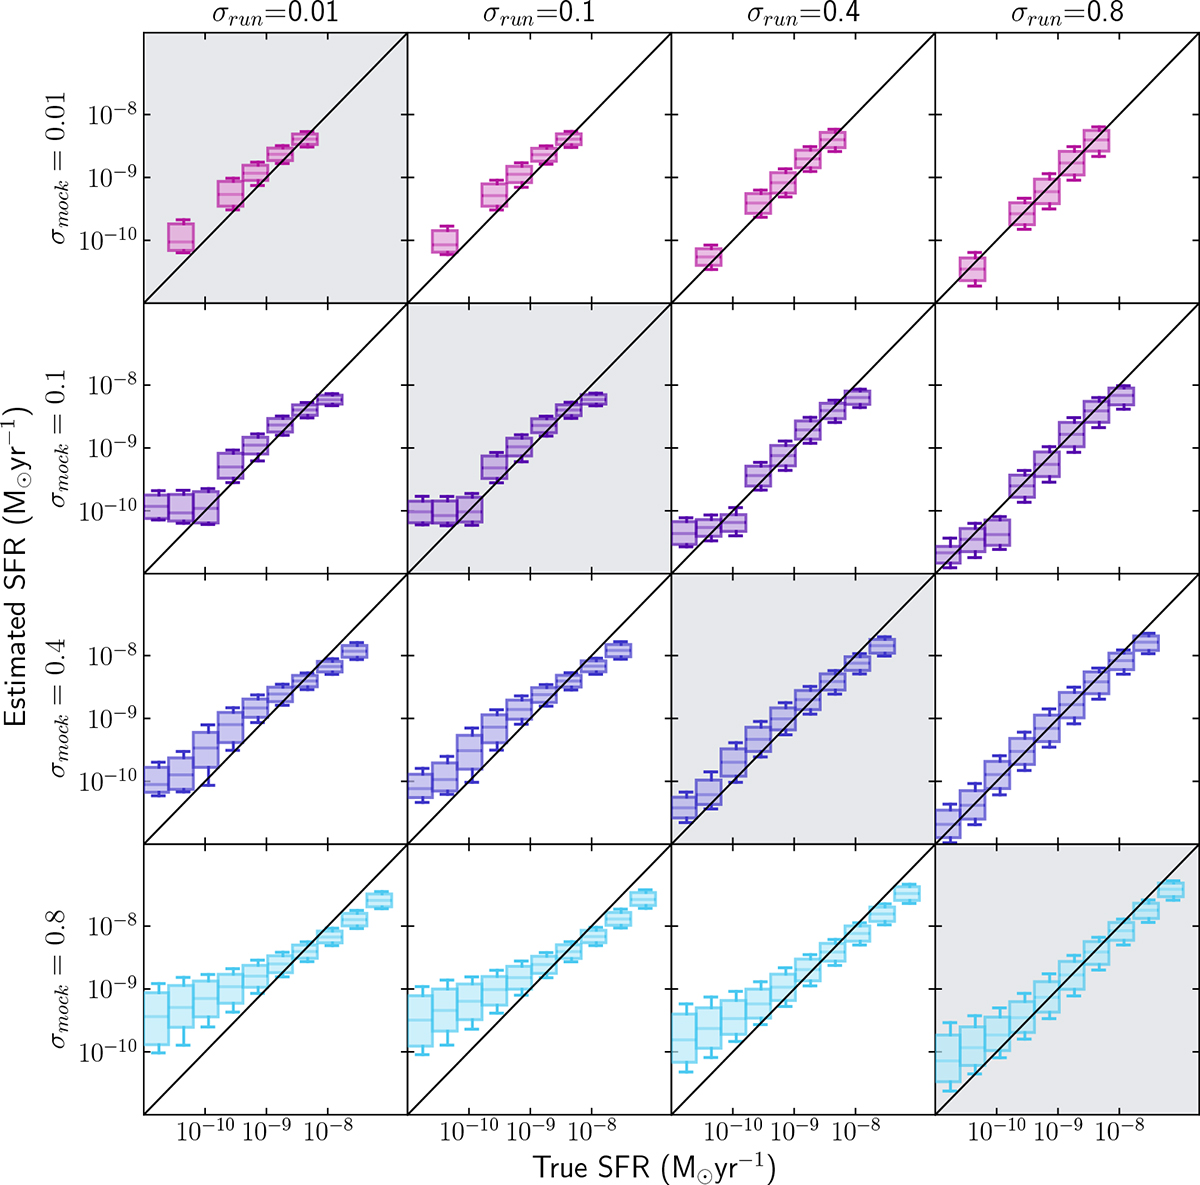
Fig. 4.
Download original image
Comparison between the mock SFR10 (true SFR10) and the SFR10 recovered by CIGALE (estimated SFR10) for all mock catalogs (rows) fitted with the different values of σrun (columns). The boxes span from the first quartile (Q1 = 25%) to the third quartile (Q3 = 75%), with a line indicating the median position, while the error bars extend from the 16th to the 84th percentile of the cumulative distribution. The gray background in the panels highlights when σrun match σmock. The SFH with the highest level of burstiness (σrun = 0.8) provides the best estimate of SFR10.
Current usage metrics show cumulative count of Article Views (full-text article views including HTML views, PDF and ePub downloads, according to the available data) and Abstracts Views on Vision4Press platform.
Data correspond to usage on the plateform after 2015. The current usage metrics is available 48-96 hours after online publication and is updated daily on week days.
Initial download of the metrics may take a while.