Open Access
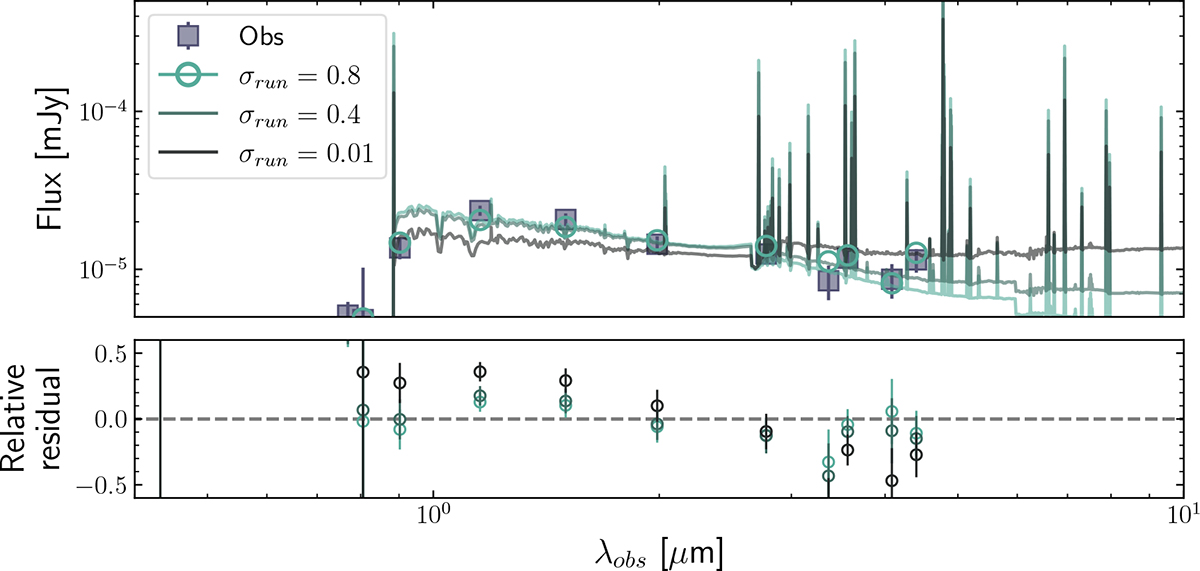
Fig. 6.
Download original image
Example SED of a galaxy at z ∼ 6 (top panel) and residuals (bottom panel). The dark purple squares are the fluxes from HST and JWST. The solid lines are the best-fit models obtained by CIGALE. The open circles indicate the modeled fluxes for the different models (in the top panels only for σrun = 0.8).
Current usage metrics show cumulative count of Article Views (full-text article views including HTML views, PDF and ePub downloads, according to the available data) and Abstracts Views on Vision4Press platform.
Data correspond to usage on the plateform after 2015. The current usage metrics is available 48-96 hours after online publication and is updated daily on week days.
Initial download of the metrics may take a while.