Fig. 9.
Download original image
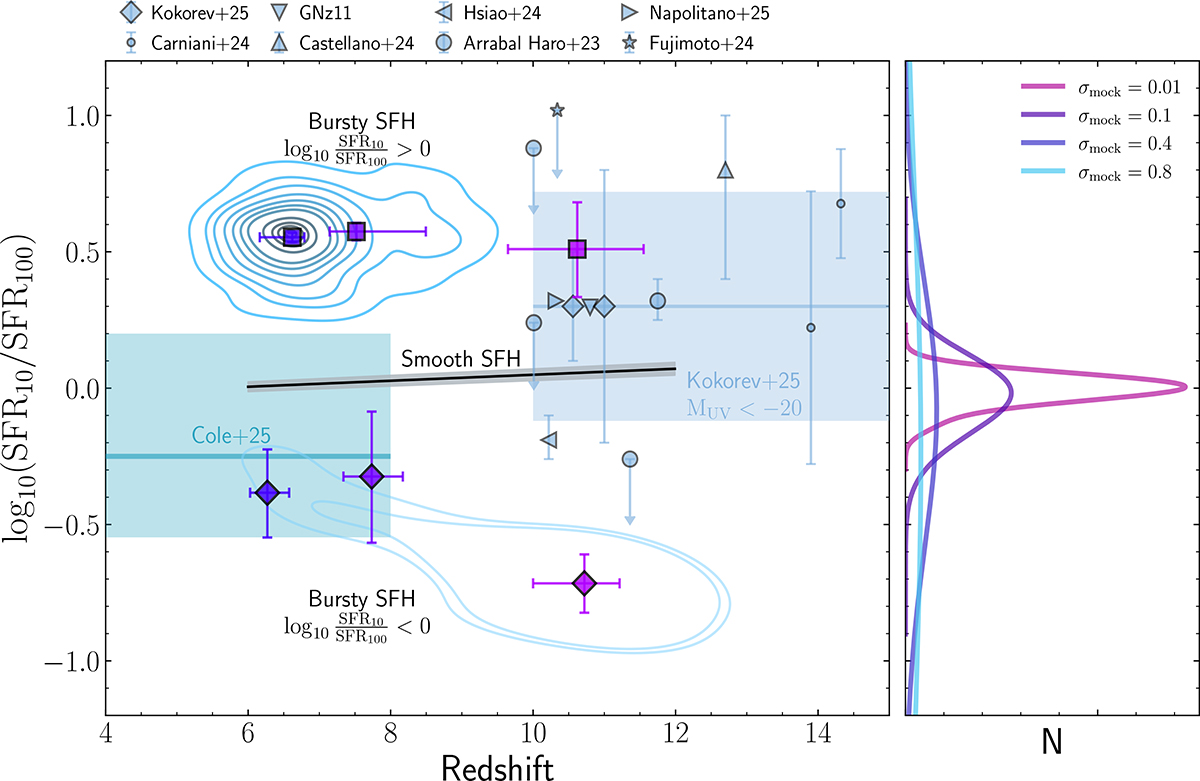
Evolution of the log10(SFR10/SFR100) ratio, used as an indicator of burstiness, as a function of redshift. Blue contours indicate the distribution of the galaxies of our sample classified as having a bursty SFH. The big square and diamonds indicate the median value for each of the three redshift bins considered in this work for bursty galaxies with enhanced SF activity and decreasing activity, respectively. The black solid line is a linear fit to the ratio obtained for galaxies classified as having a smooth SFH. Measurements from the literature are also shown for comparison (Cole et al. 2025; Kokorev et al. 2025; Carniani et al. 2024). The SFR10/SFR100 ratio from Arrabal Haro et al. (2023), Castellano et al. (2024), Hsiao et al. (2024), Bunker et al. (2023), Álvarez-Márquez et al. (2025), Fujimoto et al. (2024), Napolitano et al. (2025) were taken from Kokorev et al. (2025). The light blue shaded regions represent the log10(SFR10/SFR100) distribution within 1-σ for bright galaxies (MUV < −20; Kokorev et al. 2025) and the 16th–84th percentiles from Cole et al. (2025), with the median indicated by the solid line. The right panel shows the distribution of log10(SFR10/SFR100) ratios obtained from the simulated mock catalogs with different burstiness levels presented in Sect. 2.2. The ratio is constant as a function of redshift. Only high ratios of ≳0.2 cannot be reproduced by a smooth SFH.
Current usage metrics show cumulative count of Article Views (full-text article views including HTML views, PDF and ePub downloads, according to the available data) and Abstracts Views on Vision4Press platform.
Data correspond to usage on the plateform after 2015. The current usage metrics is available 48-96 hours after online publication and is updated daily on week days.
Initial download of the metrics may take a while.