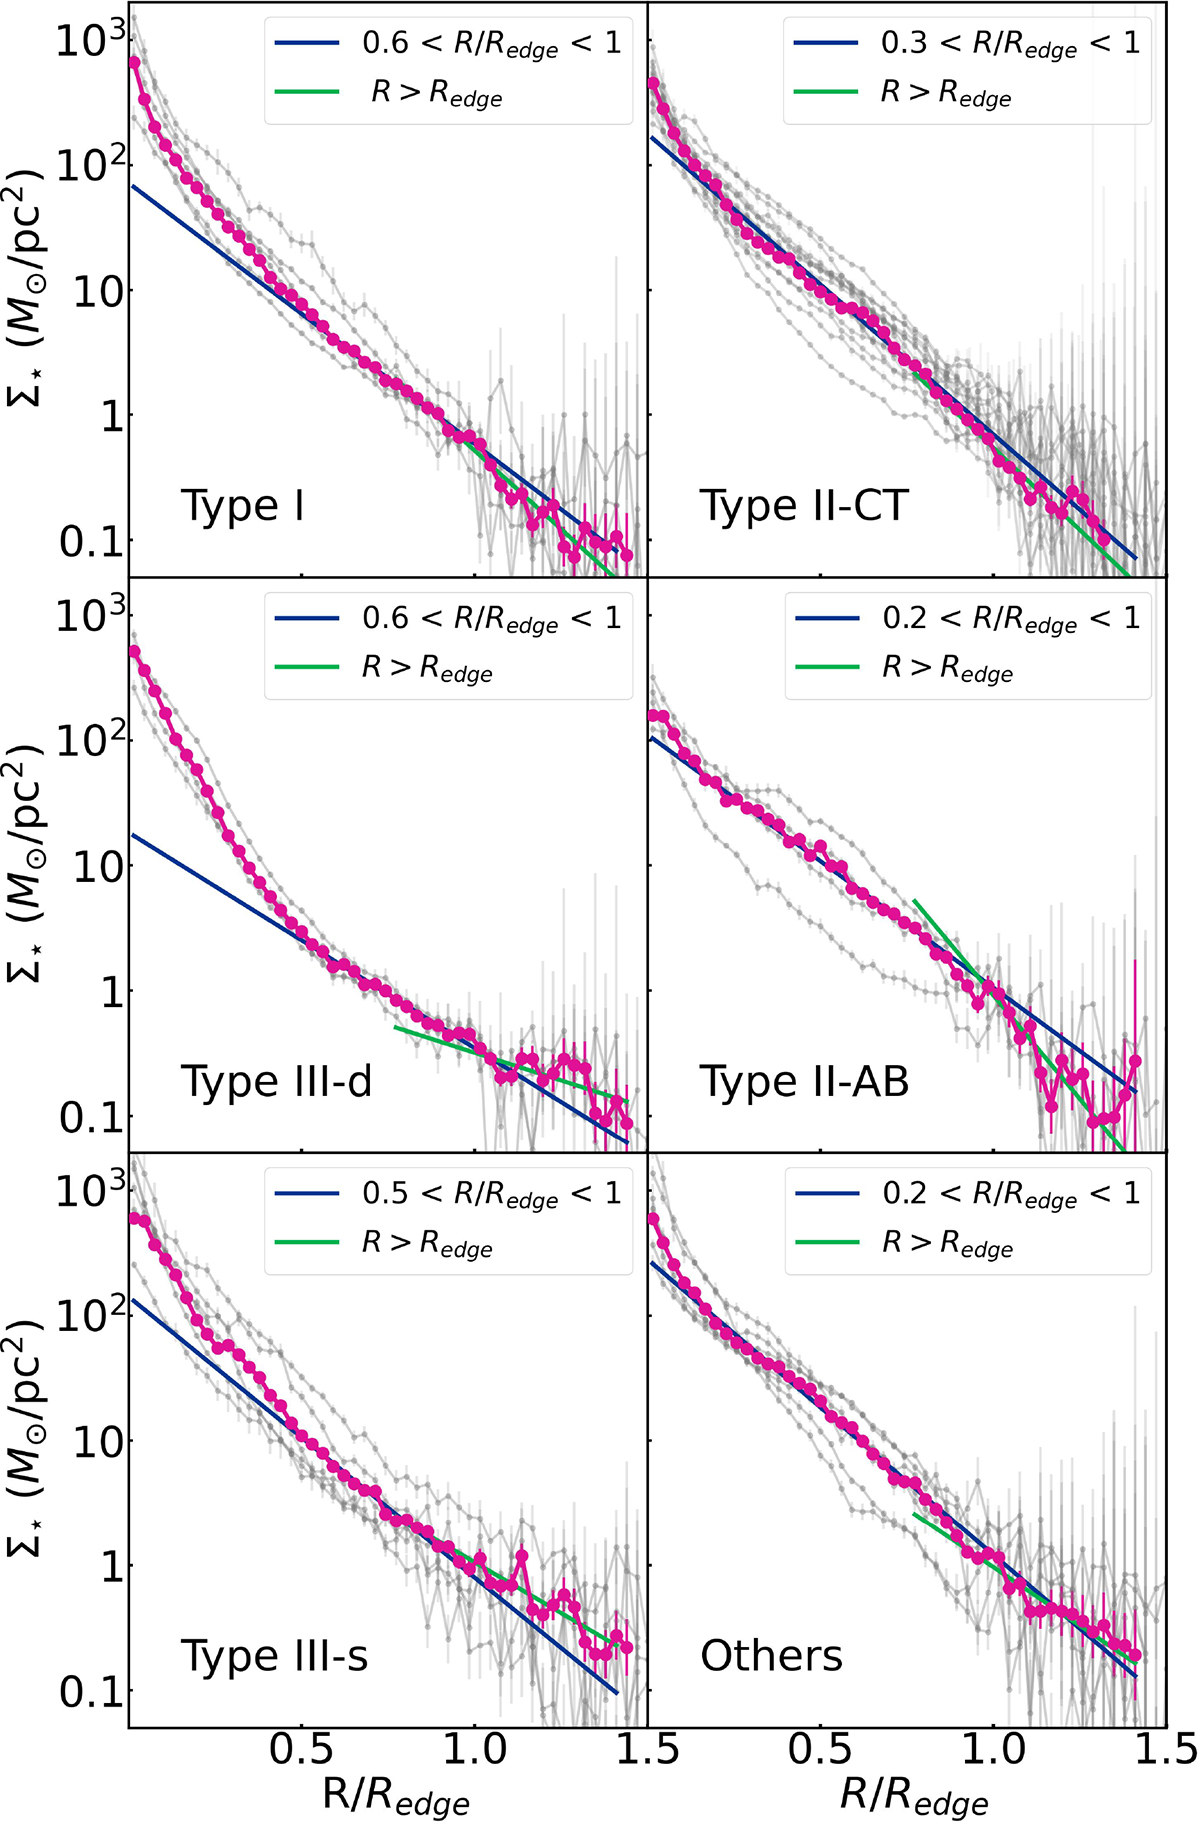
Fig. 1.
Download original image
Stellar surface mass density profiles of the galaxies in our sample (gray lines), split into their different types according to their surface brightness profiles (see Sect. 2.2 for details). The profiles have been normalized in the radial direction to the location of their edges (according to Chamba et al. 2022). In each panel, the average profile is shown in magenta. The blue and green lines correspond to exponential fits to the weighted average profiles inside and outside Redge. The spatial range used to fit the inner exponential is dictated by the excess of stellar mass produced by the bulge region.
Current usage metrics show cumulative count of Article Views (full-text article views including HTML views, PDF and ePub downloads, according to the available data) and Abstracts Views on Vision4Press platform.
Data correspond to usage on the plateform after 2015. The current usage metrics is available 48-96 hours after online publication and is updated daily on week days.
Initial download of the metrics may take a while.