| Issue |
A&A
Volume 704, December 2025
|
|
|---|---|---|
| Article Number | A335 | |
| Number of page(s) | 17 | |
| Section | Extragalactic astronomy | |
| DOI | https://doi.org/10.1051/0004-6361/202556488 | |
| Published online | 18 December 2025 | |
Revisiting the structure of galactic disks with deep imaging★
1
Departamento de Física Teórica, Atómica y Óptica, Universidad de Valladolid, 47011 Valladolid, Spain
2
Laboratory for Disruptive Interdisciplinary Science (LaDIS), Universidad de Valladolid, 47011 Valladolid, Spain
3
Instituto de Astrofísica e Ciéncia do Espaço, Universidad de Lisboa, OAL, Tapada de Ajuda, PT1349-018 Lisbon, Portugal
4
Instituto de Astrofísica de Canarias, c/ Vía Láctea s/n, E38205 La Laguna, Tenerife, Spain
5
Departamento de Astrofísica, Universidad de La Laguna, E-38205 La Laguna, Tenerife, Spain
★★ Corresponding authors: This email address is being protected from spambots. You need JavaScript enabled to view it.
; This email address is being protected from spambots. You need JavaScript enabled to view it.
Received:
18
July
2025
Accepted:
24
October
2025
Abstract
Thanks to new advances in astronomical imaging, we can now routinely explore disk galaxy profiles about two magnitudes deeper than the data available 20 years ago. In this regard, it is an opportune time to reevaluate the past classifications of different surface brightness types. In this paper we explore the stellar mass profiles of a sample of disk galaxies with similar stellar masses (∼1010 M⊙) using IAC Stripe82 Legacy Project data. We find that Type I, II-CT, and III-d galaxies exhibit edges at surface brightnesses, μg(Redge), of ∼26.5 mag/arcsec2 and surface mass densities, Σ(Redge), of ∼0.5–1 M⊙/pc2. These surface brightnesses had been outside the range of typical SDSS images and, therefore, unstudied until now. The present data suggest (although the statistics are inconclusive) that the main difference between the previous profile types is the presence of either a more or a less intense bulge. Half of the Type II-CT galaxies are Sc, whereas half of the Type III-d galaxies are Sb. Finally, Type III-d galaxies have low surface mass density disks (Σ(ΔRexp) of ∼0.5 M⊙/pc2) and are bluer – (g − r)0= 0.32 ± 0.02 – than the other types ((g − r)0= 0.42 ± 0.02 for Types I and II-CT), suggesting that their disks probably formed later in time.
Key words: galaxies: evolution / galaxies: formation / galaxies: fundamental parameters / galaxies: photometry / galaxies: structure
We dedicate this work to the memory of Peter Erwin, a pioneer in the classification of disk galaxy types, who unfortunately left us too soon.
© The Authors 2025
 Open Access article, published by EDP Sciences, under the terms of the Creative Commons Attribution License (https://creativecommons.org/licenses/by/4.0), which permits unrestricted use, distribution, and reproduction in any medium, provided the original work is properly cited.
This article is published in open access under the Subscribe to Open model. This email address is being protected from spambots. You need JavaScript enabled to view it. to support open access publication.
1. Introduction
About 20 years ago, the ability to characterize the surface brightness profiles of around a hundred galaxies using wide field optical surveys such as the Sloan Digital Sky Survey (SDSS; York et al. 2000) allowed disk galaxies to be grouped into three basic types (Erwin et al. 2005; Pohlen & Trujillo 2006): Type I galaxies were considered those with pure exponential profiles with no breaks. Type II galaxies had a downward bending break; their definition was revised from the classification introduced by Freeman (1970) to include the so-called truncation (edge) of the disk discovered by van der Kruit (1979). What was then a completely new class, Type III galaxies were also described by a broken exponential but with an upward bending profile (Erwin et al. 2005).
Over time, the physical interpretation of each profile type (except Type I) has become more settled. From the beginning, Type III profiles have been divided into two subgroups, depending on whether the excess light in the outer part of the galaxy can be attributed to a stellar halo (i.e., Type III-s) or to a stellar disk in the process of formation (i.e., Type III-d). Star formation in the outer regions should produce an excess of light over the internal exponential decay (Erwin et al. 2005). This scenario was further supported by the finding that Type III galaxies have irregularities in the outer part, suggesting that a recent merger event activated star formation in the outermost part of the galaxy (Pohlen & Trujillo 2006; Watkins et al. 2019).
In the case of Type II, the most widely accepted interpretation was given by Roškar et al. (2008). They found that an idealized galaxy formed by the dissipative collapse of gas embedded in a spherical dark matter halo exhibits a broken stellar surface density profile (Type II). In this scenario, the radial position of the edge1 corresponds to the location of a rapid drop in the star formation rate associated with a sudden decrease in the surface density of the cooled gas. The origin of stars beyond the edge results from the outward scattering (i.e., migration) of stars from the inner disk. As a result of this evolutionary process, the radial mean stellar age profile of the galaxy is U-shaped, with the younger ages located at the edge of the star-forming disk (Debattista et al. 2006; Roškar et al. 2008; Martínez-Serrano et al. 2009; Sánchez-Blázquez et al. 2009).
The theoretical U-shape prediction of Roškar et al. (2008) was almost immediately supported by observations. Using the optical color profile of galaxies as a proxy for their age profiles, analyses of the color profiles showed that their form was indeed U-shaped. This was found in disk galaxies both at intermediate redshifts and in the present-day Universe (Azzollini et al. 2008; Bakos et al. 2008; Bakos & Trujillo 2012; Martín-Navarro et al. 2012; Zheng et al. 2015; Watkins et al. 2016; Ruiz-Lara et al. 2016). In support of the scenario presented by Roškar et al. (2008), the position of the minimum of the U-shape was in qualitative agreement with the radial position of the break in the surface brightness profiles. Given the modest depth (μg, lim of ∼26.5 mag/arcsec2) of these initial observations, not much light was visible beyond the break of the galaxy, strengthening (at that time) the interpretation that the minimum of the U-shape corresponded to the visual end of the star-forming disk.
The origin of the purely exponential (i.e., Type I) profiles has remained a mystery since then. Considering that star formation seems to be efficient only above a certain gas density threshold and/or that galaxies undergo accretion processes with other smaller galaxies, there is no obvious physical reason why the surface brightness profile of disk galaxies should continue to decay in this way to fainter and fainter surface brightnesses2. This, together with the fact that this type of profile is in the minority, representing only 10% of cases, suggests that it is only the shallow surface brightness limit of surveys such as the SDSS that has prevented us from finding the galaxy edge in this type of case.
In recent years, there has been a revolution in the depth at which galaxies can be imaged. Today, multiple works are able to obtain images 2–3 mag deeper (i.e., μg, lim ∼ 29–30 mag/arcsec2) than those obtained by the SDSS (see, e.g., Ferrarese et al. 2012; Mihos et al. 2013; Duc et al. 2015; Capaccioli et al. 2015; Fliri & Trujillo 2016; Merritt et al. 2016; Huang et al. 2018; Hood et al. 2018; Rich et al. 2019; Sánchez-Alarcón et al. 2023; Golini et al. 2024). These give us the opportunity to explore the structure of galaxies in regions that were hidden in the past in more detail. Moreover, one of the major differences from the initial work on galaxy profile classification is the increasing use of stellar mass surface density profiles, in addition to or instead of surface brightness profiles. The stellar mass surface density profiles are less susceptible to internal substructures, such as star-forming regions and spiral arms, which are better traced by surface brightness profiles (mainly in the bluer bands). As a result, galaxies with clear breaks in their surface brightness profiles (i.e., Type II) show a very mild (if any) break when explored using the stellar surface mass density (see, e.g., Bakos et al. 2008; Martín-Navarro et al. 2012).
Finally, the increasing depth has opened the possibility of exploring the edges of galaxies, which we understand here as the farthest radial location where there is a significant drop in current or past in situ star formation (Trujillo et al. 2020). This physical phenomenon leaves an imprint in the form of a drop in the stellar mass density profile. These edges have been successfully identified in both nearby (see, e.g., Chamba et al. 2022; Golini et al. 2025) and intermediate-z galaxies (Buitrago & Trujillo 2024). With all this new information, now is an opportune time to return to the classification of disk galaxy profile types from 20 years ago and determine if our interpretation of the origin of the different classes needs updating.
This work revisits the classification of disk galaxy profiles in light of what we have learned over the past two decades through deep imaging and stellar mass surface density profiles. Specifically, we are interested in analyzing whether galaxies with different surface brightness profile types exhibit edges in the mass density profiles and if a unifying framework can be established when exploring the different galaxy types from this new perspective.
To address these questions, we used data from the IAC Stripe82 Legacy Project (Fliri & Trujillo 2016; Román & Trujillo 2018) to analyze the structure of a sample of disk galaxies with stellar masses of around 1010 M⊙ (Trujillo et al. 2020; Chamba et al. 2022). We present evidence that current deep imaging supports the idea that, although they have different surface brightness profiles, Type I and Type II-CT disk galaxies look much the same when explored using their stellar mass surface density profiles. The disks of both types are described by an exponential stellar mass profile, followed by a downward bending profile at their edge. For Type III-d galaxies, there is no obvious edge in their mass profile when using elliptically averaged profiles. However, we demonstrate that this is related to the significant asymmetry of their star-forming disks. When using wedge profiles, Type III-d galaxies also present an edge.
The paper is structured as follows. Section 2 describes the sample used and how the different galaxy profiles were classified. In Sect. 3 we explain how the average stellar mass and color profiles were created and which properties they have. Finally, Sect. 4 analyzes and summarizes the main findings of this work. A standard Λ cold dark matter cosmology with Ωm = 0.3, ΩΛ = 0.7, and H0 = 70 km s−1 Mpc−1 was assumed in this study. Magnitudes are provided in the AB system (Oke & Gunn 1983).
2. Data and sample selection
2.1. Deep Stripe82 imaging
The galaxies analyzed in this paper were obtained from the parent sample described by Trujillo et al. (2020). This sample consists of 1005 galaxies (279 ellipticals, 464 spirals, and 262 dwarfs) with stellar masses between 107 and 1012 M⊙ and redshift 0.01 < z< 0.1. For the purpose of this work, we concentrated only on the spiral galaxies with morphological types between 1 and 7 (i.e., from Sa to Sd). This left a total of 227 objects. The profiles analyzed in this work were obtained using images from the IAC Stripe82 Legacy Project (Fliri & Trujillo 2016; Román & Trujillo 2018). This project is based on a co-added version of the SDSS “Stripe 82” (Jiang et al. 2008; Abazajian et al. 2009) that has been optimized for low surface brightness astronomy. The limiting depths in surface brightness of these images are μg= 29.1 mag/arcsec2 and μr= 28.5 mag/arcsec2, both measured as a 3σ fluctuation with respect to the background of the image in areas equivalent to 10″ × 10″ boxes. The g- and r-band surface brightness and the stellar mass profiles of the galaxies were obtained by Chamba et al. (2022). While Chamba et al. (2022) provides a detailed description of the methodology used to obtain these profiles, here we offer a concise summary. Before extracting the profiles, the neighboring sources are carefully masked using Max Tree Objects (Teeninga et al. 2016; Haigh et al. 2021), and the scattered light produced by the brightest source in the image is removed following the procedure described in Infante-Sainz et al. (2020). The background of the image is calculated using the masked image and is subtracted from the data. The center, axis ratio, and position angle of the ellipses used to extract the galaxy profiles are fixed and correspond to those of isophote 26 mag arcsec−2 in the g band. The uncertainties in the surface brightness profiles are estimated at each radial position as the sum of the uncertainty in the background estimation and the Poissonian error associated with the flux of the isophote at that distance. The surface brightness profiles are corrected for inclination effects, redshift dimming, and Galactic extinction. Chamba et al. (2022) compute the stellar mass density profiles following the prescription given in Roediger & Courteau (2015) and apply the set of equations provided in Bakos et al. (2008). The basis for the stellar mass density profile is the deepest band; in their case, this is the g band.
To have a representative stellar mass sample, we selected only those disk galaxies within a narrow stellar mass range around 1010 M⊙. In particular, we took galaxies with 109.8 to 1010.2 M⊙. This range corresponds to a factor of around 2 in mass, which is similar to the uncertainty in estimating stellar masses based on the stellar population properties (see, e.g., Mendel et al. 2014). Our mass range results in a sample of 44 galaxies (see Table A.1). The selection of the stellar mass around 1010 M⊙ is done for several reasons. First, this stellar mass roughly corresponds to the peak of the stellar mass distribution of the disk galaxies (see, e.g., Kelvin et al. 2014). Therefore, by selecting this mass range, we explored the disk galaxies that are more common. Second, the construction of the original galaxy sample is biased in that lower-mass galaxies are closer in distance than higher-mass galaxies. For example, the average redshift of 1010 M⊙ galaxies is about 0.02, while that of 1010.5 M⊙ galaxies is 0.04. Therefore, the spatial resolution of the surface brightness and stellar mass profiles is better by a factor of 2 for lower-stellar-mass galaxies. Third, the range of morphological T-types selected by disk galaxies in the previous mass interval is between 1 and 6. This fits well with the sample studied by Pohlen & Trujillo (2006), which covers basically the same morphological T-types. Finally, the lower the stellar mass of the galaxies, the less likely the merger activity is to alter the structural properties of the galaxies, allowing a clearer analysis of the disk structure of these objects.
2.2. Galaxy profile classification
We classified the surface brightness profiles of the 44 selected disk galaxies as Type I, II, or III, following the same scheme3 as Pohlen & Trujillo (2006). For this reason, to perform the classification of each surface brightness profile, we looked only at the shape of the profile down to a surface brightness of 26.5 mag/arcsec2 (r band), which is roughly the typical SDSS depth of the surface brightness profiles analyzed in Pohlen & Trujillo (2006). In other words, to be consistent with earlier work, our classification of the surface brightness profiles by eye neglects the shape of the profiles beyond the SDSS surface brightness limit. The description of each galaxy, together with an explanation of the reasons for the choice of profile type, is given in the Sect. 2.3. We show all the surface brightness profiles in g and r bands, together with the radial color and stellar mass profiles, in Appendix A.
2.3. Sample description: Morphological and profile types
We give a brief description of the properties of the galaxies analyzed in this paper. In addition, we give the reasons for the classification of the profile type.
UGC 139, also known as CGCG 382-035, is an Scd galaxy according to Nair & Abraham (2010). The galaxy has a prominent star-forming disk with a very blue color (g − r)0 ∼ 0.2 mag. The position of the break of this galaxy coincides with the position of the edge. Based on the shape of the profile, we classify the galaxy as Type II-CT. A galaxy with a similar surface brightness profile in Pohlen & Trujillo (2006) is UGC 09837.
MCG+00-01-057 has an Sbc morphology according to Nair & Abraham (2010). The profile of the galaxy shows a break at about R/Redge= 0.4. This break seems to be associated with an inner ring-like structure and coincides with the minimum color profile. We classify the profile as Type II.i. A galaxy with a similar surface brightness profile in Pohlen & Trujillo (2006) is UGC 06518.
MCG+00-02-081 is an Sc galaxy (Nair & Abraham 2010). We classify the galaxy profile as II-CT due to the presence of a downward bending break at R/Redge= 0.5. This break coincides with the minimum of the (g − r)0 color profile. This galaxy has similar morphological and profile properties to those of NGC 2684 shown in Pohlen & Trujillo (2006).
MCG+00-02-126 has an Sc morphology (Nair & Abraham 2010). The object has an interaction with a nearby neighbor. This interaction washes out the possibility of identifying a clear edge. Given the asymmetry of the outer part and the presence of a break in the surface brightness profiles at about R/Redge = 0.4, we classified the profile as Type II-AB. The minimum of the color profile lies at the break radius. This galaxy has similar properties to NGC 6155 shown in Pohlen & Trujillo (2006).
UGC466 has an Sc morphology (Nair & Abraham 2010). The galaxy is not symmetric; the northern side is more extended than the southern side. Down to a surface brightness of ∼26.5 mag/arcsec2 (i.e., approximately the SDSS surface brightness limit), the galaxy shows a gently decreasing exponential behavior, and we therefore classify its profile as Type I. A galaxy with similar profile characteristics in Pohlen & Trujillo (2006) is IC 1125.
UGC737 is an Sb galaxy (Nair & Abraham 2010). We classify the surface brightness profile of this galaxy as Type III-d. This galaxy has a distinctly blue (g − r)0= 0.35 disk where the reddening begins beyond the Redge. A galaxy with a similar surface brightness profile is UGC 09741 in Pohlen & Trujillo (2006).
MGC+00-04-086 is a red compact disk galaxy with a stellar halo-like structure surrounding it, probably indicating an ongoing minor merger. It has the morphology of an Scd (Nair & Abraham 2010). The profile shows an up-bending in the outer region. We classify the profile as Type III-s. A similar surface brightness profile can be found in the study of Pohlen & Trujillo (2006) for the galaxy UGC 10721.
MGC+00-04-126 has a morphology of an Sc (Nair & Abraham 2010). Its profile shows a break at about half the location of Redge. The minimum of the color profile is at the same location as the break. Beyond the break the color starts to get redder. We classify this profile as Type II-CT. A galaxy with a similar profile in Pohlen & Trujillo (2006) is NGC 3589.
MCG+00-04-132 is an Sbc galaxy according to Nair & Abraham (2010). The galaxy has an up-bending profile. The excess of light in the outer part is associated with the presence of recent star formation in the outer part. Around Redge, the profile of the galaxy becomes redder, indicating a possible end of in situ star formation of the object. We classify the profile as Type III-d. A galaxy in Pohlen & Trujillo (2006) with a similar surface brightness profile is UGC 10721.
LEDA1137500 has an Sa morphology (Nair & Abraham 2010). The excess of light in the outer part of the galaxy is probably related to the presence of a stellar halo, although we cannot exclude the possibility that it could be explained by the effect of scattered light from the (inclined) galaxy itself. We classify the profile as Type III-s. A galaxy with a similar profile in Pohlen & Trujillo (2006) is NGC 1084.
IC138 is an Sbc galaxy (Nair & Abraham 2010). The surface brightness profile has a break at R/Redge= 0.75. Beyond this location, there is an increasing reddening of the color profile. We classify this profile as Type II-CT. A galaxy in Pohlen & Trujillo (2006) with a similar surface brightness profile is NGC 7437.
MGC+00-05-013 is an Sab galaxy according to Nair & Abraham (2010). The galaxy shows the presence of a bar and an elongated ring-like structure surrounding it. This causes an excess of light in the profile of the galaxy at R/Redge= 0.35. This ring is bluer than the rest of the galaxy. We classify the profile as II.o-OLR. A galaxy with a similar surface brightness profile in Pohlen & Trujillo (2006) is NGC 5850.
MGC+00-05-045 has an Sc morphology according to Nair & Abraham (2010). There are two possible locations for the break in the galaxy. One at R/Redge= 0.4 and another at 0.8. This radial range also coincides with the bluer part of the galaxy. We classify the profile as Type II-CT. A galaxy with a similar surface brightness profile in Pohlen & Trujillo (2006) is NGC 3589.
UGC1603 has been classified as Sc by Nair & Abraham (2010). The galaxy has a surface brightness profile with an exponential decrease compatible with a Type I. The color of the galaxy is red in the center and blue from R/Redge = 0.3 to the end of the observable disk. A galaxy with a similar surface brightness profile in Pohlen & Trujillo (2006) is NGC 5668.
2MASXJ02135431+0026533 has an Sa morphology (Nair & Abraham 2010). The galaxy has a ring-like structure. The profile of the galaxy shows a notable color change from red to blue at about R/Redge= 0.5. This coincides with the end of the ring-like structure and reinforces the idea that the outer part of the galaxy is probably affected by the resonance produced by the inner ring, causing an increase in star formation outside. We classify its profile as Type II.o-OLR. A galaxy in Pohlen & Trujillo (2006) with a similar surface brightness profile is NGC 1068.
MCG+00-07-031 is a low-inclination galaxy with an Sb morphology (Nair & Abraham 2010) and profile Type III-d. We made this profile classification based on the outer region of the galaxy, which has a spiral structure with blue colors. A galaxy in Pohlen & Trujillo (2006) with a similar surface brightness profile is NGC 2967.
UGC2019 has an Sc morphology according to Nair & Abraham (2010) and we classify its profile as Type II-CT. The break of the galaxy is at R/Redge= 0.5. A galaxy in Pohlen & Trujillo (2006) with a similar profile is NGC3586. The galaxy has a nonsymmetric outer region that obscures a clear identification of the edge.
LEDA175542 is an Sb galaxy (Nair & Abraham 2010) with a ring-like structure surrounding the bulge region. For this reason, we classify its profile as Type II-OLR. The color profile has its minimum at R/Redge= 0.3. A galaxy with a similar surface brightness profile in Pohlen & Trujillo (2006) is NGC 5376.
LEDA11066 is an Sb galaxy (Nair & Abraham 2010) that has a ring-like structure surrounding its bulge. We classify its surface brightness profile as Type II-OLR. A galaxy with a similar surface brightness profile in Pohlen & Trujillo (2006) is NGC5376. The outermost region of this galaxy is not very symmetric, perhaps indicating recent merging activity. The edge of the galaxy is probably washed out by this interaction.
KUV02558+0026 is a galaxy with a nonsymmetric outer part, classified as Sc by Nair & Abraham (2010). We classify the surface brightness profile as Type III-s, since the excess of light in the outer part may be related to a recent interaction. A galaxy in Pohlen & Trujillo (2006) with a similar surface brightness profile is NGC 5624.
LEDA1133341 is an asymmetric galaxy with an Sc morphological type according to Nair & Abraham (2010). Due to the break in the surface brightness profile and the asymmetry of the galaxy, we classify the surface brightness profile of this galaxy as Type II-AB. The break of the galaxy is located at about R/Redge= 0.5 and coincides with the end of the bluer part of the object. The possible recent merger activity of this galaxy has washed out the possibility of detecting a clear edge. A galaxy with a similar surface brightness profile in Pohlen & Trujillo (2006) is NGC 3246.
LEDA145248 is a galaxy with an Sbc morphology (Nair & Abraham 2010). Down to a surface brightness of about 26.5 mag/arcsec2 (i.e., approximately the SDSS surface brightness limit), the galaxy has an exponentially decreasing profile. Therefore, we classify the galaxy profile as Type I. A galaxy with a similar surface brightness profile in Pohlen & Trujillo (2006) is NGC 2776.
LEDA1145667 has an Sab morphology according to Nair & Abraham (2010). The profile shows a subtle break at about R/Redge= 0.8. However, up to the SDSS surface brightness limit, the surface brightness profile would have been classified as Type I. We therefore classified it as such. A galaxy in Pohlen & Trujillo (2006) with a similar profile is NGC 2776.
Z390-4 is a galaxy whose nonsymmetric outskirts suggest that it is undergoing a minor merger. The morphology of the galaxy is Sab according to Nair & Abraham (2010). The surface brightness profile shows a break at R/Redge= 0.4, which is also associated with a transition in the color profile. The profile has an excess of light in the outer part, which is most likely related to the merging activity, and therefore, we classify the galaxy profile as Type III-s. A galaxy with a similar surface brightness profile in Pohlen & Trujillo (2006) is NGC 0853.
Z390-17 is a low-inclination disk galaxy of morphological type Sab according to Nair & Abraham (2010). The profile of the galaxy shows a break at about R/Redge= 0.8. At this radius, the color profile becomes redder. We classify the profile as Type II-CT. A galaxy in Pohlen & Trujillo (2006) with a similar surface brightness profile is NGC 5660.
KUG0315+007 is an Scd galaxy according to Nair & Abraham (2010). The galaxy has an asymmetric edge. The profile shows a break at about R/Redge= 0.5, which coincides with a minimum in the color profile. Due to the asymmetry of the galaxy, we classify the profile as Type II-AB. The edge of the galaxy is not very well defined in the profile due to the irregular outer region of the galaxy. An object in Pohlen & Trujillo (2006) with a similar surface brightness profile is NGC 6155.
Z390-79 is a low-inclination galaxy of the morphological type Scd (Nair & Abraham 2010). The surface brightness profile shows a break at about R/Redge= 0.6. The color profile remains blue up to the edge, where it starts to become redder. We classify this profile as Type II-CT. A galaxy with a similar surface brightness profile in Pohlen & Trujillo (2006) is NGC 4545.
LEDA176187 is a barred galaxy classified as Sb in Nair & Abraham (2010). The outer region of the galaxy suggests a merger in progress. In addition, the profile of the galaxy has an up-bending profile, and we classify the object as Type III (most likely Type III-s). The profile also shows a bump at about R/Redge = 0.4, which is likely related to the bar structure. A galaxy in Pohlen & Trujillo (2006) with a similar profile is NGC 1299.
LEDA176224 is of morphological type Sb (Nair & Abraham 2010). The galaxy profile shows a break at about R/Redge= 0.5. The break occurs at a relatively bright surface brightness, and the minimum in the color profile is at R/Redge= 0.3. For this reason, we classify the profile as an inner break, i.e., type II.i. The edge of the galaxy has been washed out due to the presence of strong Galactic cirrus in the field of this object. A galaxy in the work of Pohlen & Trujillo (2006) with a similar surface brightness profile is UGC 06518.
Z391-7 it has an Sc morphology following Nair & Abraham (2010). The surface brightness profile shows a break at about R/Redge= 0.6, where the minimum of the color profile is also located. We classify the profile of the galaxy as Type II-CT. A galaxy with a similar surface brightness profile in Pohlen & Trujillo (2006) is NGC 3589.
LEDA1129114 is an Sb galaxy according to Nair & Abraham (2010). The presence of a near compact object complicates a clean analysis of the outer part. The profile has two bumps, one associated with an inner compact disk-like structure and then an arm-like structure at about R/Redge= 0.8. The formation of these structures could be related to a dynamical resonance, and therefore, we classify the profile as Type II.o-OLR. In Pohlen & Trujillo (2006), a galaxy with a similar profile is NGC 5430.
Z374-27 is an Sc galaxy according to Nair & Abraham (2010). The roundish outer region of the galaxy suggests an ongoing merger, although there are some compact objects surrounding the galaxy that make this analysis difficult. Due to the up-bending of the profile, we classify this galaxy as Type III-s. A galaxy in Pohlen & Trujillo (2006) with a similar surface brightness is NGC 5624.
Z375-11 is an Scd galaxy (Nair & Abraham 2010). The profile is compatible with an exponentially decreasing surface brightness down to the SDSS limit (i.e,. about 26.5 mag/arcsec2). For this reason, this object is classified as Type I. We note, however, that there is some evidence of an excess of light beyond Redge. The presence of a nearby star (although masked) may be responsible for such an excess, while at the same time washing out a clear detection of the edge of the galaxy in the profile. A galaxy with a similar profile type in Pohlen & Trujillo (2006) is NGC 2776.
Z375-24 has an Sb morphological classification (Nair & Abraham 2010). The profile is well described with an exponential decrease down to Redge, and for this reason, we classify the galaxy as Type I. A galaxy with a similar profile type in Pohlen & Trujillo (2006) is NGC 2776.
MCG+00-54-023 has a morphological type of Sc according to Nair & Abraham (2010). The galaxy shows a clear break at about R/Redge= 0.6, which coincides with the minimum in the color profile. For this reason, we classify the profile of the galaxy as Type II-CT. A galaxy in Pohlen & Trujillo (2006) with a similar surface brightness is NGC 3589.
Z375-48 is a low-inclination galaxy of morphological type Sc (Nair & Abraham 2010). The break of the galaxy is located at R/Redge= 0.85 and coincides with the color minimum. We classify the profile of the galaxy as Type II-CT. A galaxy with a similar surface brightness profile is NGC 5660 (Pohlen & Trujillo 2006).
LEDA1128634 has been morphologically classified as Sc by Nair & Abraham (2010). The profile shows a break at about R/Redge= 0.75 and the characteristic U-shape for the color profile. We classify its profile as Type II-CT. The galaxy NGC 12709 in Pohlen & Trujillo (2006) has a profile with similar properties.
SDSSJ221223.75-004745.3 is an Sc galaxy Nair & Abraham (2010). It has a break in the profile at about R/Redge = 0.75. This break coincides with the minimum color of the g − r profile. We classify the profile of the galaxy as Type II-CT. A galaxy with a similar surface brightness profile in Pohlen & Trujillo (2006) is UGC 09837.
UGC12446 is a low-inclination Sc galaxy according to Nair & Abraham (2010). Although the innermost disk of the galaxy looks quite symmetrical, the outermost region is not. This may indicate an ongoing minor merger. This is also supported by the structure of the surface brightness profile, which shows a break at R/Redge = 0.75 and an up-bending at Redge. For this reason, we classify the galaxy as Type II-CT + III. A galaxy with a similar surface brightness profile in Pohlen & Trujillo (2006) is NGC 5667.
2MASXJ23154453+0027383 has an Scd morphology according to Nair & Abraham (2010). The outer region shows an excess of light associated with an active star-forming disk. For this reason, we classify the profile of the galaxy as Type III-d. A galaxy in Pohlen & Trujillo (2006) with a similar surface brightness profile is NGC 2967.
UGC12635 is a low-inclination galaxy with an Sb morphology (Nair & Abraham 2010). The surface brightness profile has a break at about R/Redge = 0.75. For this reason, we classify the profile of the galaxy as Type II-CT. IC 1158 is a galaxy with a similar surface brightness profile in Pohlen & Trujillo (2006).
LEDA135904 is a low-inclination galaxy with an Scd morphology (Nair & Abraham 2010). The surface brightness profile has a break at about R/Redge = 0.75. We classify the profile of the galaxy as Type II-CT. A galaxy with a similar surface brightness profile in Pohlen & Trujillo (2006) is IC 1158.
MCG+00-60-032 is of morphological type Scd according to Nair & Abraham (2010). The surface brightness profile has a break at about R/Redge = 0.65. We classify the profile of the galaxy as Type II-CT. In this case, however, the minimum of the color profile does not coincide with the location of the break. The galaxy UGC 08658 in Pohlen & Trujillo (2006) has a similar surface brightness.
Z382-5 is a nonsymmetric disk with a morphological class of Sbc (Nair & Abraham 2010). The surface brightness profile has a break at about R/Redge = 0.65. We classify the profile of the galaxy as Type II-AB. A galaxy with a similar surface brightness profile in Pohlen & Trujillo (2006) is NGC 6155.
We find the following number of types: 6 Type I (13 ± 5%), 28 Type II (64 ± 12%), and 10 Type III (23 ± 7%). These numbers are within the errors in nice agreement with those given in Pohlen & Trujillo (2006). The Type II galaxies are subclassified (again following the scheme by Pohlen & Trujillo 2006) in 17 Type II-CT, 2 Type II.i, 4 Type AB, and 5 Type II.o-OLR. In the case of Type III, we have the following subclassification: 4 Type III-d and 6 Type III-s.
3. Analysis
After analyzing and classifying the surface brightness profiles of the galaxies into different types, we used the surface brightness, stellar mass density, and g − r color profiles to see what using deeper data adds to the classification scheme proposed 20 years ago.
We grouped the stellar surface mass density and color profiles of all galaxies into their different families. This is shown in Figs. 1 and 2. The radial range of the profiles has been normalized by the Redge of the galaxy found in Chamba et al. (2022). To build the average profiles at each radial distance, the uncertainties of the individual profiles were considered. Those with smaller error bars are given more weight than those with larger ones. Thus, the average profiles are the weighted mean of the individual galaxies. Explicitly, we applied the following equation:
 (1)
(1)
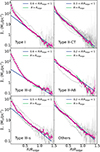 |
Fig. 1. Stellar surface mass density profiles of the galaxies in our sample (gray lines), split into their different types according to their surface brightness profiles (see Sect. 2.2 for details). The profiles have been normalized in the radial direction to the location of their edges (according to Chamba et al. 2022). In each panel, the average profile is shown in magenta. The blue and green lines correspond to exponential fits to the weighted average profiles inside and outside Redge. The spatial range used to fit the inner exponential is dictated by the excess of stellar mass produced by the bulge region. |
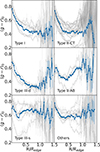 |
Fig. 2. Similar to Fig. 1 but showing the radial (g − r)0 extinction-corrected color profiles of the different galaxy types and their weighted average. |
where wi(R) = (σmin(R)/σi(R))2. σmin(R) is the lower error bar of the profiles combined at given R. The new error bar at a given R of the weighted mean profiles is given by
 (2)
(2)
The same weighted scheme applies to the radial color profiles shown in Fig. 2.
As mentioned in the introduction, we used the stellar mass surface density to explore the presence of edges in galaxies because they are less susceptible to internal substructures, such as star-forming regions or spiral arms. The fact that we are averaging over a number of profiles also contributes to the smoothness of the average profiles shown in Fig. 1. This facilitates the identification of an edge, if present. In our work, the most outward change in the slope of the stellar mass profiles is what we identify as the edge of the galaxy (see an in-depth discussion in Golini et al. 2025). In all the cases, the average g-band surface brightness at which Redge is located is around 2–3 magnitudes brighter than the limiting surface brightness of the data (Chamba et al. 2022).
To quantify the potential presence of an edge, we performed an exponential fit on the stellar mass profile, both inside and outside the Redge location provided in the catalog by Chamba et al. (2022). The use of an exponential shape beyond the edge of the galaxy to characterize the outer disk is supported by findings from other spiral galaxies using ultra deep data, for both low (see, e.g., Trujillo et al. 2021; Golini et al. 2025; Junais et al. 2025) and high inclinations (see, e.g., Trujillo & Fliri 2016; Martínez-Lombilla et al. 2019). We defined an exponential function in Python and fit it to the data using the curve_fit from the scipy.optimize package to extract the best-fit parameters. The exponential fits are parameterized as follows:
 (3)
(3)
An edge in the stellar mass profile is suggested when the ratio of the inner scale length, hin, to the outer scale length, hout, is greater than one. The radial range used in the innermost fitting is shown on the panels of Fig. 1 and was chosen depending on the influence of the excess of light in the central part of the galaxy. For Type I, II-CT, and II-AB profiles, we can see hints of a downward slope bend when the radial distance reaches Redge. This visual impression aligns with the hin and hout values provided in Table 1. The scale lengths are given in units of Redge. We observe the opposite behavior in the other profile types. The outer slope of the average stellar mass profile is greater than the inner slope.
Scale-length values (in units of Redge) for the exponential fits inside (hin) and outside (hout) the Redge.
The way we combined the profiles above implicitly assumes that all stellar mass profiles within a given profile type are different realizations of the same type of object. While this is a reasonable assumption, given that we are using objects of each type with similar total stellar masses and similar individual and radial color profiles, it is certainly an oversimplification of reality. Therefore, to test the robustness of our scale length and axis ratio measurements, we computed these quantities for each profile, then calculated the resulting average values, i.e., ⟨hin⟩, ⟨hout⟩, and ⟨hin/hout⟩. The results are shown in Table 1.
The comparison between the two methods shows that the average inner scale length is well determined with low uncertainty, as this part of the galaxies has a higher signal-to-noise ratio. As expected, the scale length beyond the edge of the galaxy is more uncertain. Nonetheless, the estimation of this quantity agrees within the error bars for all profile types among the two methodologies. Finally, the ratios of the two scale lengths are also in agreement (within the error bars) between the two methods. Overall, this test shows that the results presented here are robust to the analysis used to estimate them. The method using individual profiles has larger uncertainties in the outermost region, but these uncertainties are probably more realistic than those using an average profile because they take into account the intrinsic variability of all galaxies within a given type.
For all profile types, we find that the inner scale length is approximately five times smaller than Redge. This result is in good agreement with that found by Chamba et al. (2022) when comparing with the global effective radius for Milky Way-like galaxies (i.e., Redge/Re ∼ 3.2). Given that, for exponential profiles, Re/h ∼ 1.7, we can expect Redge/hin ∼ 5.
While the absence of a measurable edge in the stellar mass profile of galaxies of Types III-s and “Others”, which is a combination in this work of Types II.o-OLR, and II.i is expected, the lack of an edge in Type III-d is surprising. In the case of Type III-s, the excess stellar mass beyond the in situ star formation region of the galaxy can be easily explained by ongoing stellar mass accretion. In the case of the “Others” category, it is also easy to see that we are dealing with a mixture of different profiles, which is why there is no clear edge. However, it is not obvious why there is no definite edge in Type III-d. The surprise is even greater when we take a detailed look at the color profiles given in Fig. 2. Types I and II share a reddening after the edge together with Type III-d. This is a typical feature associated with the end of the in situ star formation region. For these reasons, we decided to explore the four galaxies in our sample with III-d profiles in more detail.
The figures in Appendix A show images and surface brightness, (g − r)0 color, and stellar mass density radial profiles (using ellipses) of the galaxies in our sample. Type III-d galaxies have larger disk asymmetries than the other galaxies in the sample. MCG+00-07-031 and 2MASXJ23154453+0027383 are the most obvious cases, visually looking at them. In these cases, using an elliptical average to obtain the surface brightness profiles can obscure the objects’ features. In particular, finding the edge location is very sensitive to asymmetries in the outer disks using this approach (see, e.g., Junais et al. 2025). To overcome this difficulty, we obtained the surface brightness profiles of these objects at specific angular directions using astscript-radial-profile as described in Infante-Sainz et al. (2024). This wedge strategy is illustrated in Fig. 3. The direction of the wedges were selected based on minimizing background contamination and ensuring representativeness of relatively symmetric areas of the galaxy.
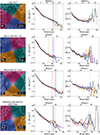 |
Fig. 3. Color image and radial profiles of Type III-d galaxies using wedges (as indicated in the colored region). Left column: Composite color image of the galaxy using the g, r, and i Sloan bands. Middle: Stellar mass profiles along the different wedges. The vertical dashed lines indicate the location of the edge along each wedge direction. The black profile is the elliptically averaged stellar mass density profile. Right: Galactic extinction-corrected color wedge profiles of the galaxy together with the elliptically averaged one (black line). |
When doing the above analysis, we find that the elliptically averaged profile makes the finding of the edges more difficult than in the case of the individual profiles following the wedge directions. We repeated the analysis of Type III-d galaxies, combining all the stellar mass and color profiles extracted using the wedge technique. This is shown in Fig. 4. Contrary to what we observe using the elliptically averaged profiles, the wedge technique shows a very clear edge for the Type III-d galaxies. In fact, we get ratio hin/hout = 2.74 ± 0.45 with hin = 0.326 ± 0.06 and hout = 0.13 ± 0.006.
 |
Fig. 4. Similar to Figs. 1 and 2 but showing the stellar mass density and (g − r)0 color profiles of the Type III-d galaxies using wedges. |
After this analysis, we conclude that Type III-d galaxies do have a well-defined edge when viewed from a specific direction. This confirms that the reason we cannot see the edge using ellipses is due to the asymmetry of these galaxies’ disks. In short, there is strong evidence that Types I, II-CT, and III-d galaxies exhibit edges in their stellar mass profiles, despite their varying surface brightness profiles.
4. Discussion and conclusions
The discovery that disk galaxy surface brightness profiles can be categorized into three types naturally raises the question of why this variety emerged. To shed light on this issue, we examined a carefully selected group of disk galaxies using deep images obtained from the IAC Stripe82 Legacy Project (Fliri & Trujillo 2016; Román & Trujillo 2018). Having deeper images than those used in seminal works helped us explore the outermost regions of galaxies and obtain stellar mass profiles through their color distributions, which are more reliable due to the increased signal-to-noise ratio.
The first finding of our study, based on the analysis of stellar mass density profiles, is that Type I, II-CT, and III-d disk galaxies exhibit an edge. These edges are found at surface brightness levels (μg(Redge) of ∼26.5 mag/arcsec2) that are very close to the limiting surface brightness of typical images with depth, such as those from the SDSS 20 years ago. For this reason, they were practically invisible to the authors of those seminal studies. In all galaxy types, the edge seems to indicate the end of in situ star formation in the disk. This is because, in addition to having similar surface brightnesses, they have similar average stellar surface densities at the edge (Σ(Redge) of ∼0.5–1 M⊙/pc2) across the different categories. The stellar populations beyond the edge are redder, reinforcing the idea that in situ star formation ends at the edge. While this could support the hypothesis that stars beyond the edge of galaxies result from stellar migration, other plausible scenarios, such as gas depletion and/or disk flaring due to interactions, could also play an important role.
Although this point is not discussed in detail in this paper, our findings from studying the edges of Type I, II-CT, and III-d galaxies suggest that the next generation of images (see, e.g., Ivezić et al. 2019; Trujillo et al. 2021; Zaritsky et al. 2024), which will be deeper than those analyzed in this paper, will require us to change the traditional notation of types that we have used until now. In the future, deeper surface brightness profiles of the previous classifications of galaxies will show a break in the outer part of the profiles, corresponding to the edge feature. Thus, the different types will probably be classified as I+II, II+II, or III-d+II, with the final II indicating the presence of the galaxy’s edge.
Another important aspect to discuss is the following: We are studying disk galaxies with very similar stellar masses, and all of the Type I, II-CT, and III-d galaxies have edges in their mass profiles with similar properties (i.e., similar radial locations and stellar mass surface densities; see, e.g., Fig. 5 in Chamba et al. 2022). Why, then, do their surface brightness profiles show differences in their internal structure? In short, what is the ultimate physical reason for the disparity in their surface brightness profiles? The answer seems to be related to the galaxies’ morphological type. This result was previously suggested by Pohlen & Trujillo (2006). In that study, Type II-CT galaxies were more prevalent among later types, while Type III-d galaxies were more abundant among earlier types4. The shape of our galaxies’ stellar mass profiles reinforces this idea. For instance, Type II-CT galaxies have less prominent bulge regions compared to their disk (exponential) parts. The opposite is true for Type III-d galaxies. This is also evident in the color stacked profiles, where the flat region with the bluest color is larger in Type II-CT (0.3 < R/Redge < 1) galaxies than in Type III-d (0.5 < R/Redge < 1). In addition to the differing extensions of the exponential region among the different types, the color of the disk region is also a bit different. Type I and II-CT galaxies have similar blue colors around (g − r)0 ∼ 0.4, while the colors of Type III-d galaxies reach values of around 0.3 mag. This, together with the fact that the exponential region (ΔRexp) of Type III-d galaxies has a very low stellar mass density (Σ(ΔRexp) ∼ 0.5 M⊙/pc2), leads us to propose that Type III-d galaxies have the newest disk structures. Future studies with a larger sample of galaxies, particularly Type III-d galaxies, will conclusively determine whether the differences between Types II-CT and III-d identified here are robust or the result of statistical fluctuations.
Finally, the differences between Types I and II-CT are subtle and may relate to the bulge’s significance compared to the disk. Type I galaxies have larger central regions (0 < R/Redge < 0.25) than Type II-CT galaxies (0 < R/Redge < 0.1). Could this be connected to the presence of a break in the surface brightness profile of Type II-CT galaxies? Does a more prominent bulge prevent the disk from resonating, thereby enhancing star formation at the location of the galaxy’s break? Answering these questions is beyond the scope of this work, and only simulations built specifically to address them will be able to provide solutions.
Roškar et al. (2008) used the term “break” to describe what we now call an “edge”. Currently, “break” refers to a change in surface brightness profiles, while “edge” refers to a drop in stellar surface mass density. In some galaxies, the two features coincide, but in many, breaks are only seen in surface brightness profiles at radial distances closer to the center of the galaxy than the edges (Martín-Navarro et al. 2012).
A similar argument applies to Type III-d galaxies. If their outer excess of light corresponds to a young star-forming disk, we would expect that sufficiently deep imaging would reveal the edge of the galaxy.
Pohlen & Trujillo (2006) subclassified Types II and III into several classes. We followed that classification scheme here as well. Type II-CT refers to “classical truncations”, i.e., those compatible with the location of truncations found in edge-on galaxies (van der Kruit 1979). Type II-AB refers to a break that can be associated with galaxies that have an Apparent or Asymmetric Break generated by the galaxy’s different extensions in different directions. Type OLR is used when the galaxy has a bar and the break is connected to an Outer Lindblad Resonance (i.e., located at twice the bar radius). When a bar is present, Type II.i and Type II.o refer to breaks inside and outside the bar extension, respectively. For Type III, the addition of “d” or “s” refers to the origin of the excess light beyond the edge, which is produced by either a disk-like or stellar-halo-like structure. Finally, the “Others” category contains profiles that cannot be associated with the previous categories due to their mixed shapes. In this work, for simplicity, we also included in the category “Others” the Types II.o-OLR and II.i.
We found that nine out of sixteen of our Type II-CT galaxies have a morphological type of T = 5 (i.e., Sc). There is no obvious clustering among Type III-d galaxies; however, two out of four of these galaxies have a morphological type of T = 3 (i.e., Sb). Nevertheless, the numbers (particularly in the case of Type III-d galaxies) are admittedly small, and after running a KS test, we cannot reject the null hypothesis that the two samples belong to the same parent sample (p-value = 0.21).
Acknowledgments
We thank the anonymous referee for carefully reading the manuscript and providing suggestions that helped improve its clarity and strength. SR and FB acknowledge support from the GEELSBE2 project with reference PID2023-150393NB-I00 funded by MCIU/AEI/10.13039/501100011033 and the FSE+, and also the Consolidación Investigadora IGADLE project with reference CNS2024-154572. SR and FB also acknowledge support from the project PID2020-116188GA-I00, funded by MICIU/AEI/10.13039/501100011033. SR and FB gratefully acknowledge financial support of the Department of Education, Junta de Castilla y León, and FEDER Funds (Reference: CLU-2023-1-05). IT acknowledges support from the State Research Agency (AEI-MCINN) of the Spanish Ministry of Science and Innovation under the grant PID2022-140869NB-I00 and IAC project P/302302, financed by the Ministry of Science and Innovation, through the State Budget and by the Canary Islands Department of Economy, Knowledge, and Employment, through the Regional Budget of the Autonomous Community. This research also acknowledges support from the European Union through the following grants: “UNDARK” and “Excellence in Galaxies – Twinning the IAC” of the EU Horizon Europe Widening Actions programs (project numbers 101159929 and 101158446). Funding for this work/research was provided by the European Union (MSCA EDUCADO, GA 101119830). Views and opinions expressed are however those of the author(s) only and do not necessarily reflect those of the European Union or European Research Executive Agency (REA). Neither the European Union nor the granting authority can be held responsible for them. GG and IRC acknowledge support from the PID2022-140869NB-I00 grant from the Spanish Ministry of Science and Innovation.
References
- Abazajian, K. N., Adelman-McCarthy, J. K., Agüeros, M. A., et al. 2009, ApJS, 182, 543 [Google Scholar]
- Akhlaghi, M., & Ichikawa, T. 2015, ApJS, 220, 1 [Google Scholar]
- Azzollini, R., Trujillo, I., & Beckman, J. E. 2008, ApJ, 679, L69 [NASA ADS] [CrossRef] [Google Scholar]
- Bakos, J., & Trujillo, I. 2012, ApJ, submitted [arXiv:1204.3082] [Google Scholar]
- Bakos, J., Trujillo, I., & Pohlen, M. 2008, ApJ, 683, L103 [NASA ADS] [CrossRef] [Google Scholar]
- Buitrago, F., & Trujillo, I. 2024, A&A, 682, A110 [NASA ADS] [CrossRef] [EDP Sciences] [Google Scholar]
- Capaccioli, M., Spavone, M., Grado, A., et al. 2015, A&A, 581, A10 [NASA ADS] [CrossRef] [EDP Sciences] [Google Scholar]
- Chamba, N., Trujillo, I., & Knapen, J. H. 2022, A&A, 667, A87 [NASA ADS] [CrossRef] [EDP Sciences] [Google Scholar]
- Debattista, V. P., Mayer, L., Carollo, C. M., et al. 2006, ApJ, 645, 209 [Google Scholar]
- Duc, P.-A., Cuillandre, J.-C., Karabal, E., et al. 2015, MNRAS, 446, 120 [Google Scholar]
- Erwin, P., Beckman, J. E., & Pohlen, M. 2005, ApJ, 626, L81 [Google Scholar]
- Ferrarese, L., Côté, P., Cuillandre, J.-C., et al. 2012, ApJS, 200, 4 [Google Scholar]
- Fliri, J., & Trujillo, I. 2016, MNRAS, 456, 1359 [Google Scholar]
- Freeman, K. C. 1970, ApJ, 160, 811 [Google Scholar]
- Golini, G., Montes, M., Carrasco, E. R., Román, J., & Trujillo, I. 2024, A&A, 684, A99 [NASA ADS] [CrossRef] [EDP Sciences] [Google Scholar]
- Golini, G., Trujillo, I., Zaritsky, D., et al. 2025, A&A, 700, A91 [NASA ADS] [CrossRef] [EDP Sciences] [Google Scholar]
- Haigh, C., Chamba, N., Venhola, A., et al. 2021, A&A, 645, A107 [NASA ADS] [CrossRef] [EDP Sciences] [Google Scholar]
- Hood, C. E., Kannappan, S. J., Stark, D. V., et al. 2018, ApJ, 857, 144 [NASA ADS] [CrossRef] [Google Scholar]
- Huang, S., Leauthaud, A., Greene, J., et al. 2018, MNRAS, 480, 521 [Google Scholar]
- Infante-Sainz, R., & Akhlaghi, M. 2024, Res. Notes Am. Astron. Soc., 8, 10 [Google Scholar]
- Infante-Sainz, R., Trujillo, I., & Román, J. 2020, MNRAS, 491, 5317 [Google Scholar]
- Infante-Sainz, R., Akhlaghi, M., & Eskandarlou, S. 2024, Res. Notes Am. Astron. Soc., 8, 22 [Google Scholar]
- Ivezić, Ž., Kahn, S. M., Tyson, J. A., et al. 2019, ApJ, 873, 111 [Google Scholar]
- Jiang, L., Fan, X., Annis, J., et al. 2008, AJ, 135, 1057 [NASA ADS] [CrossRef] [Google Scholar]
- Junais, Ruiz Cejudo, I., Guerra Arencibia, S., et al. 2025, A&A, 702, A136 [NASA ADS] [CrossRef] [EDP Sciences] [Google Scholar]
- Kelvin, L. S., Driver, S. P., Robotham, A. S. G., et al. 2014, MNRAS, 444, 1647 [Google Scholar]
- Martínez-Lombilla, C., Trujillo, I., & Knapen, J. H. 2019, MNRAS, 483, 664 [CrossRef] [Google Scholar]
- Martínez-Serrano, F. J., Serna, A., Doménech-Moral, M., & Domínguez-Tenreiro, R. 2009, ApJ, 705, L133 [CrossRef] [Google Scholar]
- Martín-Navarro, I., Bakos, J., Trujillo, I., et al. 2012, MNRAS, 427, 1102 [Google Scholar]
- Mendel, J. T., Simard, L., Palmer, M., Ellison, S. L., & Patton, D. R. 2014, ApJS, 210, 3 [Google Scholar]
- Merritt, A., van Dokkum, P., Abraham, R., & Zhang, J. 2016, ApJ, 830, 62 [Google Scholar]
- Mihos, J. C., Harding, P., Spengler, C. E., Rudick, C. S., & Feldmeier, J. J. 2013, ApJ, 762, 82 [NASA ADS] [CrossRef] [Google Scholar]
- Nair, P. B., & Abraham, R. G. 2010, ApJS, 186, 427 [Google Scholar]
- Oke, J., & Gunn, J. 1983, ApJ, 266, 713 [NASA ADS] [CrossRef] [Google Scholar]
- Pohlen, M., & Trujillo, I. 2006, A&A, 454, 759 [NASA ADS] [CrossRef] [EDP Sciences] [Google Scholar]
- Rich, R. M., Mosenkov, A., Lee-Saunders, H., et al. 2019, MNRAS, 490, 1539 [Google Scholar]
- Roediger, J. C., & Courteau, S. 2015, MNRAS, 452, 3209 [NASA ADS] [CrossRef] [Google Scholar]
- Román, J., & Trujillo, I. 2018, Res. Notes Am. Astron. Soc., 2, 144 [Google Scholar]
- Roškar, R., Debattista, V. P., Stinson, G. S., et al. 2008, ApJ, 675, L65 [Google Scholar]
- Ruiz-Lara, T., Pérez, I., Florido, E., et al. 2016, MNRAS, 456, L35 [NASA ADS] [CrossRef] [Google Scholar]
- Sánchez-Alarcón, P. M., Román, J., Knapen, J. H., et al. 2023, A&A, 677, A117 [NASA ADS] [CrossRef] [EDP Sciences] [Google Scholar]
- Sánchez-Blázquez, P., Courty, S., Gibson, B. K., & Brook, C. B. 2009, MNRAS, 398, 591 [CrossRef] [Google Scholar]
- Teeninga, P., Moschini, U., Trager, S. C., & Wilkinson, M. H. F. 2016, Math. Morphol. Theory Appl., 1, 25 [Google Scholar]
- Trujillo, I., & Fliri, J. 2016, ApJ, 823, 123 [Google Scholar]
- Trujillo, I., Chamba, N., & Knapen, J. H. 2020, MNRAS, 493, 87 [NASA ADS] [CrossRef] [Google Scholar]
- Trujillo, I., D’Onofrio, M., Zaritsky, D., et al. 2021, A&A, 654, A40 [NASA ADS] [CrossRef] [EDP Sciences] [Google Scholar]
- van der Kruit, P. C. 1979, A&AS, 38, 15 [NASA ADS] [Google Scholar]
- Watkins, A. E., Mihos, J. C., & Harding, P. 2016, ApJ, 826, 59 [Google Scholar]
- Watkins, A. E., Laine, J., Comerón, S., Janz, J., & Salo, H. 2019, A&A, 625, A36 [NASA ADS] [CrossRef] [EDP Sciences] [Google Scholar]
- York, D. G., Adelman, J., Anderson, J. E., Jr., et al. 2000, AJ, 120, 1579 [NASA ADS] [CrossRef] [Google Scholar]
- Zaritsky, D., Golini, G., Donnerstein, R., et al. 2024, AJ, 168, 69 [Google Scholar]
- Zheng, Z., Thilker, D. A., Heckman, T. M., et al. 2015, ApJ, 800, 120 [NASA ADS] [CrossRef] [Google Scholar]
Appendix A: The profiles of selected galaxies
In this appendix we show the color images of the galaxies in the sample together with the surface brightness profiles of the objects in the g and r Sloan bands. The color images were created using the astscript-radial-profile (Infante-Sainz & Akhlaghi 2024), which is part of the Gnuastro program Akhlaghi & Ichikawa (2015), using the g, r, and i Sloan filters. The code uses the average of the 3 filters for the gray background pixels. The stellar mass profiles are also shown along with the color profiles. All these profiles (which include Galactic extinction, galaxy inclination, and cosmological dimming correction) are taken directly from the work of Chamba et al. (2022). In addition, this appendix presents the table summarizing the main properties of the galaxies included in the sample.
 |
Fig. A.1. Galaxy color image and radial profiles. Left column: Composite color image of the galaxy using the g, r, and i Sloan bands. The background is shown in black and white to better visualize the low surface brightness features. The name of the object, its morphological type, and a 10 kpc length bar for reference are superimposed. Middle: Surface brightness profiles of the galaxies in the g and r bands. These profiles were obtained using elliptical apertures with an axis ratio and position angle as indicated by the dashed red ellipse in the galaxy image (left column). The semimajor axis of the dashed red ellipse corresponds to Redge (Chamba et al. 2022). The surface brightness profiles are corrected for Galactic extinction, galaxy inclination, and cosmological dimming. The surface stellar mass profile is also added. The exponential fittings to the disk inside the edge (black line) and to the region beyond the edge of the galaxy (orange line) are included. Right: Galactic extinction-corrected color profile of the galaxy. |
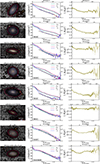 |
Fig. A.1. continued. |
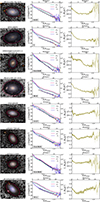 |
Fig. A.1. continued. |
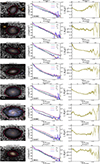 |
Fig. A.1. continued. |
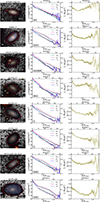 |
Fig. A.1. continued. |
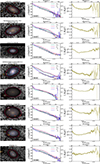 |
Fig. A.1. continued. |
Characteristics of the galaxies studied in this work.
All Tables
Scale-length values (in units of Redge) for the exponential fits inside (hin) and outside (hout) the Redge.
All Figures
|
Fig. 1. Stellar surface mass density profiles of the galaxies in our sample (gray lines), split into their different types according to their surface brightness profiles (see Sect. 2.2 for details). The profiles have been normalized in the radial direction to the location of their edges (according to Chamba et al. 2022). In each panel, the average profile is shown in magenta. The blue and green lines correspond to exponential fits to the weighted average profiles inside and outside Redge. The spatial range used to fit the inner exponential is dictated by the excess of stellar mass produced by the bulge region. |
| In the text | |
|
Fig. 2. Similar to Fig. 1 but showing the radial (g − r)0 extinction-corrected color profiles of the different galaxy types and their weighted average. |
| In the text | |
|
Fig. 3. Color image and radial profiles of Type III-d galaxies using wedges (as indicated in the colored region). Left column: Composite color image of the galaxy using the g, r, and i Sloan bands. Middle: Stellar mass profiles along the different wedges. The vertical dashed lines indicate the location of the edge along each wedge direction. The black profile is the elliptically averaged stellar mass density profile. Right: Galactic extinction-corrected color wedge profiles of the galaxy together with the elliptically averaged one (black line). |
| In the text | |
|
Fig. 4. Similar to Figs. 1 and 2 but showing the stellar mass density and (g − r)0 color profiles of the Type III-d galaxies using wedges. |
| In the text | |
|
Fig. A.1. Galaxy color image and radial profiles. Left column: Composite color image of the galaxy using the g, r, and i Sloan bands. The background is shown in black and white to better visualize the low surface brightness features. The name of the object, its morphological type, and a 10 kpc length bar for reference are superimposed. Middle: Surface brightness profiles of the galaxies in the g and r bands. These profiles were obtained using elliptical apertures with an axis ratio and position angle as indicated by the dashed red ellipse in the galaxy image (left column). The semimajor axis of the dashed red ellipse corresponds to Redge (Chamba et al. 2022). The surface brightness profiles are corrected for Galactic extinction, galaxy inclination, and cosmological dimming. The surface stellar mass profile is also added. The exponential fittings to the disk inside the edge (black line) and to the region beyond the edge of the galaxy (orange line) are included. Right: Galactic extinction-corrected color profile of the galaxy. |
| In the text | |
|
Fig. A.1. continued. |
| In the text | |
|
Fig. A.1. continued. |
| In the text | |
|
Fig. A.1. continued. |
| In the text | |
|
Fig. A.1. continued. |
| In the text | |
|
Fig. A.1. continued. |
| In the text | |
Current usage metrics show cumulative count of Article Views (full-text article views including HTML views, PDF and ePub downloads, according to the available data) and Abstracts Views on Vision4Press platform.
Data correspond to usage on the plateform after 2015. The current usage metrics is available 48-96 hours after online publication and is updated daily on week days.
Initial download of the metrics may take a while.