| Issue |
A&A
Volume 704, December 2025
|
|
|---|---|---|
| Article Number | A86 | |
| Number of page(s) | 13 | |
| Section | Astronomical instrumentation | |
| DOI | https://doi.org/10.1051/0004-6361/202556497 | |
| Published online | 03 December 2025 | |
The NOEMA phasing system
A beamformer for (sub)millimeter very long baseline interferometry
1
Institut de Radioastronomie Millimétrique (IRAM),
300 rue de la Piscine,
38400
Saint-Martin-d’Hères,
France
2
Max-Planck-Institut für Radioastronomie (MPIfR),
Auf dem Hügel 69,
53121
Bonn,
Germany
★ Corresponding author.
Received:
18
July
2025
Accepted:
26
September
2025
Abstract
Aims. With its large collecting area, the NOrthern Extended Millimeter Array (NOEMA) is a prime candidate for a highly sensitive very long baseline interferometry (VLBI) station in the millimeter range. In this work, we describe the phasing system used for coherently adding the 12 antennas of the array.
Methods. We developed and installed VLBI dedicated hardware and a new correlator firmware mode to achieve this goal. We also developed an active phasing software to compensate in real time for tropospheric phase variations across the array.
Results. This phasing system enabled the NOEMA array to achieve a level of sensitivity equivalent to a ∼50 m single dish antenna. Since 2021, phased NOEMA has been participating regularly in VLBI observations as part of the existing millimeter VLBI networks: the Global Millimeter VLBI Array (GMVA) and the Event Horizon Telescope (EHT).
Key words: instrumentation: interferometers / techniques: interferometric
© The Authors 2025
 Open Access article, published by EDP Sciences, under the terms of the Creative Commons Attribution License (https://creativecommons.org/licenses/by/4.0), which permits unrestricted use, distribution, and reproduction in any medium, provided the original work is properly cited.
This article is published in open access under the Subscribe to Open model. This email address is being protected from spambots. You need JavaScript enabled to view it. to support open access publication.
1 Introduction
Very long baseline interferometry (VLBI) offers a unique view of the most compact and luminous objects in the Universe. The foundations of this technique were developed in the 1960s and we refer to Kellermann & Moran (2001) and Galt (1988) for a review of the exciting early days of this field. A fast evolution to higher frequencies followed. The IRAM observatories were ideal candidates for millimeter-VLBI experiments. Successful campaigns were run at 86 GHz and 215 GHz, first in single dish mode at the Plateau de Bure (Greve et al. 1995; Krichbaum et al. 1998) and, from 2002, in phased array mode with the correlator in operation at that time1.
Phased array VLBI stations offer the benefit of having the collecting surface of their individual antennas combined, and only one VLBI recording unit is needed for the summed-up signal. This makes the operations at the VLBI correlators easier and improves the sensitivity for self-calibration. One disadvantage is that phasing reduces the field of view to the synthesized beam; however, in VLBI, the imaged field of view is much smaller that the NOEMA synthesized beam; thus, it is not an issue in practice.
With the arrival of the PolyFiX backend, the old correlator was retired in 2017. VLBI observations in 2018 and 2019 were limited to single dish mode again and the first light of the new phased array system was in December 2020 during a test observation between NOEMA, the Yebes 40 m, and the IRAM 30 m telescopes. A series of improvements followed the first test correlations, and NOEMA participated successfully in the Event Horizon Telescope (EHT) session at 230 and 345 GHz in April 2021. The new phased array mode allows us to phase the entire local observing bandwidth (7.744 GHz × 2 polarizations ×2 sidebands). The station code was updated to Nn (for N times NOEMA) to mark the change.
Here, we describe the NOEMA phasing system and its operational details and performance in the Global Millimeter VLBI array (GMVA) at 86 GHz (3.5 mm) and the Event Horizon Telescope (EHT) at 230 GHz (1.3 mm) and 345 GHz (0.8 mm).
2 The NOEMA phasing system
The NOEMA observatory is located on the Plateau de Bure in the French Alps (05:54:26.6 East, 44:38:02.0 North), at an altitude of 2552 meters. NOEMA is composed of 12 antennas of 15 m diameter.
The purpose of the NOEMA phasing system is to form a coherent sum of the voltage from N antennas in the array and to format it for direct recording on disk-based recorders. The signal-to-noise ratio (S/N) of a VLBI baseline including phased NOEMA as a station is increased by a maximum factor of  , as compared to a single NOEMA antenna.
2.1 Overview
The design of the NOEMA phasing system builds on previous versions developed for the Plateau de Bure Interferometer and on similar efforts at the Submillimeter Array (SMA) and the Atacama Large Millimeter Array (ALMA). More details are given in the literature (Young et al. 2016; Matthews et al. 2018). The NOEMA phasing system uses a dedicated correlator firmware mode that processes data locally as an interferometer, and also computes and sends the phased sum to the recorders. To measure the efficiency of the system in forming a coherent output, the local correlator is designed to compute the cross-spectrum pairs for all antennas in the array plus the summed output. The phasing efficiency measurement uses a comparison antenna that is not part of the summed output. The system uses a reference antenna to which (local) phases and delays are measured. The system also ensures that no phase or delay corrections are applied to the reference antenna, ensuring phase stability of the summed signal. The phasing of the antennas with respect to the reference antenna is done by observations of compact (as seen by the NOEMA array) and sufficiently bright celestial sources (see Sect. 4.3 for details). This phasing can be performed either directly on the astronomical source of interest, if it is sufficiently bright, which is known as active phasing, or by using brighter calibration sources that are close to the source of interest, which is known as passive phasing.
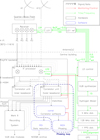 |
Fig. 1 Schematic architecture of the NOEMA phasing system. Frequencies are in MHz. For clarity, the phasing is shown only for the outer baseband, but the system enables the phasing of any baseband. |
2.2 Architecture
Figure 1 presents an overview of the NOEMA phasing system. The 12 NOEMA antennas have a surface accuracy better than 40 µm r.m.s. and a pointing accuracy of 2–3′′r.m.s. Dual polarization sideband separating receivers (Chenu et al. 2016) are located at the Cassegrain focus of each antenna and cover 72–118 GHz (NOEMA Band 1, 3 mm), 127–182 GHz (Band 2, 2 mm), 200–276 GHz (Band 3, 1 mm), and 275–375 GHz (Band 4, 0.8 mm, installed on a limited number of antennas as of this writing).
The polarizations are split by a wire grid, while the sidebands are separated by the combination of a hybrid coupler before the first frequency down-conversion and another hybrid coupler after the frequency down-conversion. The four (i.e., two polarizations times two sidebands) intermediate frequency signals (IF) are transported via analog optical links to the central building (HL: horizontal lower sideband; HU: horizontal upper sideband; VL: vertical lower sideband; VU: vertical upper sideband). A second down-conversion is done in an IF processor where the IF range (3.872–11.616 GHz) is halved and down-converted into two base-bands through mixing with a second local oscillator (LO2) at a fixed frequency of 7.744 GHz. The baseband converting from the [3.872–7.744 GHz] range is called the inner baseband (identified with letter I), while the [7.744–11.616 GHz] range is the outer baseband (identified with letter O). Hence, four IF processor units feed eight PolyFiX baseband units (HLO, HLI, HUI, HUO, VLO, VLI, VUI, and VUO), each processing a single polarization baseband signal of ∼4 GHz width. Figure 3 gives an overview of the frequency coverage of NOEMA.
Each PolyFiX baseband unit measures the phase and delay difference between the antenna signals by calculating the cross-correlation pairs, applies phase and delay corrections to align (“phase up”) them, and performs a coherent sum of these antenna signals. The phased-sum data are then formatted before being transmitted to the Mark 6 recorders via up to four 4 Gbps optical fibers (1.024 GHz bandwidth each). At the Mark 6 recorders, these phased-sum data are stored on hard disks.
The phasing loop is closed by the software programs correl (which handles all the monitoring, control, and data processing of the correlator) and INCA (which computes the phasing corrections and the phasing efficiency). The RDI software does the real-time data reduction (pointing, focus, atmospheric corrections, etc) and writes the local visibilities in the NOEMA archive. More details on NOEMA can be found in Schuster et al. (in prep.).
2.3 Hardware
2.3.1 Polarization
Since antennas at different locations on Earth see a given source with a different parallactic angle, it is customary for VLBI to observe in a circular polarization basis. This is not strictly necessary as shown by EHT observations which were made with ALMA in a linear polarization basis (Event Horizon Telescope Collaboration 2019a), but it requires an extra processing step (Martí-Vidal et al. 2016, polconvert). NOEMA receivers are sensitive to linear polarization, so the NOEMA phasing system is equipped to move quarter-wave plates with its calibration carousel into the beam path in VLBI mode.
Grooved dielectric quarter-wave plates are available for the 3 mm, 1 mm, and 0.8 mm receiver bands. They are optimized for frequencies of 86, 221, and 343 GHz, respectively. These quarter-wave plates are oriented with their fast axis at 45 degrees clockwise from up when looking towards the sky. Following the International Astronomical Union (IAU) convention, left circular polarized (LCP) light is defined in such a way that the observer looking at the sky sees the electric vector of an approaching wave rotating clockwise (with the opposite case for right circular polarized, RCP, light). With four reflections up to the quarter-wave plate, the NOEMA phasing system maps LCP to the vertical linear polarization and RCP to the horizontal linear polarization.
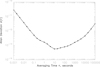 |
Fig. 2 Allan deviation of the hydrogen maser at NOEMA measured against a Rakon HSO14 5 MHz OCXO crystal. The rise after 10 seconds is due to the crystal oscillator, not the maser itself. |
2.3.2 Time and frequency references
VLBI requires stable clocks so that a posteriori cross-correlations remain tractable. NOEMA uses the active EFOS-38 hydrogen maser from T4Science, Switzerland, whose stability is better than 10−14. Figure 2 shows the Allan deviation measured using an oven controlled crystal oscillator (OCXO). The rise after ten seconds is due to the crystal oscillator, not the maser itself.
All time and frequency references and their distribution derive from the active hydrogen maser providing an ultra-stable 5 MHz reference from which all other observatory frequencies are derived. A 128 MHz signal serves to generate the LO2 frequency and to clock the PolyFiX correlator units. A one pulse per second signal (1 PPS) allows us to synchronize the various hardware and software tasks.
The maser 10 MHz output drives a synthesizer dedicated to VLBI located in the same thermally insulated rack. The LO1 reference frequency from the VLBI synthesizer (Fsynt = 1.6 to 2.1 GHz) is multiplexed by the LO control unit with two other signals: one at 100 MHz which carries phase corrections and one at 500 kHz for measuring the cable electrical length. These signals are demultiplexed by the LO1 ref box in the antenna and the LO1 frequency is generated by harmonic mixing (Mattiocco et al. 2016) according to the following equation,
 (1)
where M = 1 for 3 mm, M = 3 for 1 mm and 0.8 mm, and N is the harmonic number of the mixer (5, 6, or 7 depending on the actual LO1 frequency).
(1)
where M = 1 for 3 mm, M = 3 for 1 mm and 0.8 mm, and N is the harmonic number of the mixer (5, 6, or 7 depending on the actual LO1 frequency).
The observatory 1 PPS signal, generated from the 5 MHz reference signal can be aligned to the 1 PPS signals coming from either the maser rack or from our Global Positioning System (GPS) receiver unit. This Microchip SyncServer S650 receiver also has a time interval counter used to monitor the difference between the observatory 1 PPS and the GPS generated 1 PPS (8 ns resolution). Any drift between the two references (over a 20 day window) is corrected by adjusting the maser clock rate. By doing so, we can reach a stability of 0.1 ns/day, or about 10−15, and keep the offset between the observatory 1 PPS and the GPS time to below 10 ns at any time.
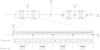 |
Fig. 3 NOEMA frequency coverage (all frequencies are in MHz). Top: receiver frequency coverage. Four IF (2 sidebands ×2 polarizations) are selected by the receiver. The IF processor uses a LO2 at 7744 MHz to split each IF in two basebands (Inner and Outer). Bottom: each baseband is split in 64 sub-bands that are 64 MHz wide after discarding the overlapped sub-band flanks. Four sub-bands (256 MHz) form a VDIF thread (see Sect. 2.4.3) and four threads are multiplexed on a stream to the recorder. |
2.3.3 The NOEMA correlator
The NOEMA correlator, named PolyFiX (Polyphase filter bank and FX correlator), is based on 8.192 giga-sample-per-second (GSps) 5-bit analog-to-digital converters (ADCs) from Tele-dyne e2v (EV5AS210 prototype chip) and high-end field programmable gate arrays (FPGAs) from Altera, Arria V GX family (part number 5AGXFB7K4F40C4N).
Each PolyFiX digital baseband unit processes a baseband of ∼4 GHz width (from 0 to 4064 MHz) for 12 antennas, in single polarization. Each unit is composed of 12 antenna/digitizer boards (one per antenna), 8 baseline/adder boards, a read-out board, a VLBI formatter board, and a passive midplane for data transmission and power supply distribution.
The main components of the antenna board are an 8.192 GSps 5-bit resolution ADC and an Arria V GX FPGA device. This ADC is a prototype chip, which has never been industrialized. It is a four-core interleaved ADC, specified to work up to 20 GSps, with an input bandwidth of 8 GHz (García et al. 2012). However, only two of the four cores are actually used for PolyFiX, due to a degraded performance of the other two cores, giving an equivalent sampling frequency of 8.192 GSps.
There are ten 4.096 Gbps differential lines between the ADC and the FPGA device. Within the antenna FPGA, data are processed through several signal processing modules (described in Sect. 2.4), before being distributed to all the eight baseline boards via the full-mesh midplane.
Each baseline board contains two Arria V GX FPGAs, with the same part number as the FPGA on the antenna board. Each baseline FPGA processes four sub-bands of 64 MHz, to cover the entire 4 GHz baseband bandwidth with a total of 16 baseband FPGAs per PolyFiX unit.
Data are sent from each antenna FPGA to each baseline FPGA via two high-speed serial links: one operating at 6 Gbps and the other at 3 Gbps. Each serial link is routed as a differential line in the midplane board. Due to constraints in the transceiver architecture of the selected FPGA device, it is not possible to implement a single 9 Gbps high-speed serial link. Thus, there are a total of 192 links (12 antenna FPGAs times 16 baseline FPGAs) running at 6 Gbps and 192 links at 3 Gbps, all routed in the midplane, resulting in an aggregate bit rate of around 1.7 Tbps.
The VLBI formatter board, which was specially developed for the NOEMA phasing system, receives the result of the coherent sum from the 16 baseline FPGAs, in 64 sub-bands of 64 MHz width (2-bit real-valued samples). There is a 1 Gbps serial link from each baseline FPGA, to transfer the corresponding four 64 MHz sub-bands. This VLBI formatter board, which is based on an Altera Arria 10 FPGA, sends the formatted data using four 10 gigabit Ethernet (10GbE) interfaces, equipped with SFP+ (enhanced small form-factor pluggable) transceivers, and connected to the VLBI recorders via four optical fibers, each one operating at a net data-rate of 4 Gbps.
2.3.4 Recorders
The NOEMA phasing system uses Mark 6 recorders, developed jointly by the MIT Haystack Observatory, Conduant Corporation and the NASA/GSFC High-End Network Computing Group (Whitney et al. 2013). Each Mark 6 recorder today can record at a data rate of 16 Gbps.
At the time of writing, NOEMA is equipped with 4 recorders, so can record up to 64 Gbps (8 GHz bandwidth, 2 polarizations, 2 bits, Nyquist sampling). Going to 128 Gbps would only require a doubling of the present number of recorders (and the associated media), an upgrade of the recorders to twice the data rate, or a temporary storage for a 128 Gbps scan and writing at a “trickle rate” of 64 Gbps during calibration gaps in the schedule. Other stations would have to provide a similar frequency plan (see, e.g., Tilanus et al. 2013, for a discussion).
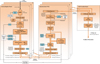 |
Fig. 4 Digital signal processing pipeline for a PolyFiX baseband unit in VLBI phased array mode. |
2.4 VLBI digital signal processing
The digital signal processing (DSP) pipeline is implemented in the firmware of the high-end FPGAs located in the PolyFiX antenna and baseline boards. These FPGAs can be configured using up to eight different configuration binary files, known as bitstreams, which are stored in 2-Mbit parallel flash memory chips included in the antenna and baseline boards (one memory chip per Arria V FPGA).
A specialized firmware mode was developed for VLBI observations, consisting of a set of source code files written in hardware description languages (HDL), such as VHDL or Ver-ilog. Two different configuration bitstreams, one for the antenna FPGAs and another for the baseline FPGAs, were generated by the Altera Quartus compiler and then stored in one of the eight pages of the corresponding 2-Mbit parallel flash memory chips. Figure 4 shows a block diagram of the PolyFiX digital signal processing pipeline in VLBI (phased-array) mode. Details on the different processing modules are given below.
2.4.1 Antenna processing
For each of the 8 PolyFiX baseband units, the 12 analog base-band signals (4 GHz wide, one signal per antenna) are digitized at a rate of 8.192 GSps (5-bit resolution) in the 12 antenna boards (one board per NOEMA antenna). For each antenna, the digitized data from the ADC are received by the antenna FPGA via ten high-speed differential serial lines at 4.096 Gbps. At the output of the FPGA transceivers, these digitized data are demultiplexed by a factor of 32, since the frequency of the internal clock of the FPGA is 128 MHz (for an equivalent demultiplexing factor of 64 with respect to the sampling rate). This 128 MHz clock is derived from the 5 MHz maser clock, and is distributed to all the PolyFiX baseband units via coaxial cables and, within each baseband unit, to the different boards via the midplane board.
Following data demultiplexing, a delay correction module is used to compensate for geometrical and instrumental differential delays between the antennas. This consists of a submodule for bulk delay correction, followed by a finer delay correction submodule. The bulk delay correction, based on RAM memory blocks, compensates for delays at a coarse resolution of 64 samples, or 7.8125 ns, with a delay depth of ±8 µs, required to cover the maximum geometrical delay for the NOEMA interferometer, whose longest baseline is currently 1664 m in length. The fine delay submodule, based on a barrel shifter circuit, allows for a delay resolution of one sample, or ∼122 ps = 1/(8192 MHz).
The delay-corrected 4 GHz baseband signal is then divided into 64 sub-bands of 128 MHz width, by an overlapping polyphase filter bank (OvPFB). A 50% overlapping structure is used, as a continuous spectral response was a requirement for the local NOEMA correlator. As described in Section 2.4.2, the overlapped sub-band flanks are later filtered out in the baseline FPGA processing, keeping only the central useful 64 MHz range for each sub-band. One special case is the first sub-band, which is centered at 0 Hz, and due to spectrum symmetry, only the range from 0 Hz to 32 MHz is usable for correlation (the first ∼10 MHz are degraded by the analog response of the Poly-FiX IF processor). As the last overlapping sub-band is centered at 4032 MHz, the maximum processed frequency is 4064 MHz (the last 32 MHz of the digitized bandwidth, 4096 MHz for a sampling rate of 8192 MSps, are discarded), as shown in Fig. 3, bottom diagram.
The output sub-bands of the filter bank are then connected to an array of phase rotators. Thus, each sub-band signal is multiplied by a complex exponential function whose phase is controlled by software. For VLBI, a phase offset is applied for each sub-band to cancel the residual phase offsets generated by the delay correction module, in steps of π/256 radians, for a 9-bit resolution.
The 64 sub-bands are distributed to the 16 baseline FPGAs, in groups of four sub-bands, following an incremental order of sub-band index by default. Thus, the first four sub-bands, indexes 0 to 3 are transmitted to the first baseline FPGA (thread 0), sub-bands 4 to 7 to the second FPGA (thread 1), and so on, up to sub-bands 60 to 63, which are transmitted to the last baseline FPGA (thread 15).
A sub-band selector module, located upstream of the data transmitters, allows for any input sub-band to be redirected to any output position (sub-band duplication is permitted) and, therefore, to change the default increasing index order for sub-band transmission and later processing by the baseline FPGAs. This selector is implemented as an array of sixty-four 64-to-1 logic multiplexers. It was developed for testing purposes, but has been used for EHT observations since 2022: for half of the PolyFiX units, 8 sub-bands are rerouted for better alignment to the EHT standard correlation frequency ranges (see Sects. 3.1.3 and 3.1.4).
Each group of four sub-bands is transmitted from each antenna FPGA to each baseline FPGA via two high-speed serial links: one at 3 Gbps carrying the first sub-band and the other at 6 Gbps carrying the other three sub-bands. Due to transmission overheads, the maximum available net data rate is 2048 Mbps (128 MHz × 16 bits) for a 3 Gbps link and 4096 Mbps (128 MHz × 32 bits) for a 6 Gbps link. As the data bit-width grows through the processing pipeline, each time-domain complex-valued sub-band is rounded to 2×5 bits, for a net transmission data rate of 1280 Mbps per sub-band (128 MHz × 2×5 bits).
2.4.2 Baseline processing
For each of the 16 baseline FPGAs (8 baseline boards with two FPGAs each), the same four sub-bands are received from the 12 antenna FPGAs via the 6 Gbps and 3 Gbps serial links. As there is a differential latency between the two different types of serial links, a sub-band aligner module is placed after the receivers and used to realign the 4 sub-bands. This allows us to obtain a continuous phase response versus frequency across the sub-bands from each PolyFiX unit when correlating the data with other VLBI stations.
To align these sub-bands, a 32 PPS synchronization pulse is transmitted along with the data from each of the 12 antenna FPGAs, via the high-speed serial links. This 32 PPS pulse is inserted at the transmitters of each antenna FPGA, after the sub-band selector module.
Upon reception, at each baseline FPGA, the sub-band delay aligner detects the 32 PPS from the different sub-bands and corrects the delay difference using FIFO-based delay lines. It should be noted that all the boards in a PolyFiX unit receive a common 32 PPS signal, which is generated from the 128 MHz system clock and aligned to the system 1 PPS, both derived from the maser 5 MHz reference clock.
Then, a Walsh π demodulator module is used to remove the π phase switching applied to the first LO (LO1) of the receivers. This phase switching, based on orthogonal Walsh functions, is necessary for the local correlator to reduce electrical crosstalk between antenna signals. However, this phase switching must be demodulated before the addition of the antenna signals, by applying (or not) a change of sign (i.e., a phase shift of π radians).
For each of the four sub-bands, a parallel adder is used to sum the phased signals from the 12 antennas. This 12-input adder is implemented using a 4-stage binary adder tree with a total of eleven 2-input full-precision complex-valued adders. A phased antenna mask allows us to select a subset of antennas to be summed. At the output of the adder, an amplitude scale factor, inversely proportional to the number of active antennas, is applied to maintain a constant amplitude level for the downstream modules.
In parallel to the addition, the 12 antenna signals feed a local FX correlator (one module per sub-band), which is used to measure the phase and delay difference between the reference antenna and each of the other antenna. The result of the sum is connected to an extra 13th correlator input, and its visibilities used to compute the phasing efficiency (see Sect. 4.2.1). This local correlator computes the auto and cross-spectra for 12+1 antennas (78 baselines) with 2 MHz of channel spacing. The cross-spectra are also used for antenna pointing and focus; and the auto-spectra for system temperature (Tsys) calibration.
For each of the four 128 MHz overlapping sub-bands, a half-band filter selects the useful non-overlapped central part of the sub-band spectrum, corresponding to the frequency range from –32 MHz to +32 MHz. This half-band filter is a high order, low-pass FIR filter with 255 coefficients, which is implemented using an efficient structure since every other coefficient is zero and the non-zero coefficients are symmetrical with respect to the center of the impulse response.
As data are recorded in 2-bit real-valued samples for millimeter VLBI observations, the output signals of the half-band filters are converted from complex-valued to real-valued samples, and then requantized to two bits, before being transmitted to the VLBI formatter board. For an optimal 2-bit requantization, that maximizes the later correlation efficiency (maximum of 0.88 for 2 bits), the requantization thresholds are regularly adjusted by software. To do so, a set of samples from the requan-tizer input (8-bit depth) is sent to the PolyFiX computer for amplitude measurement. After the 2-bit requantization, the four 64 MHz sub-bands are transmitted from each baseline FPGA to the VLBI formatter board via a 1 Gbps serial link, routed in the midplane board.
The same 32 PPS pulse received from the antenna FPGAs and used for sub-band delay alignment at the input of each baseline FPGA, is then retransmitted via each 1 Gbps link to the VLBI formatter board, along with the four phased sub-bands. At the FPGA of the VLBI formatter board, this 32 PPS is received and used to time-stamp the phased-sum data, which are later sent to the recorder. This is thus equivalent to time-stamping the data at the output of the antenna FPGAs.
2.4.3 VDIF formatting
Prior to recording, the phased NOEMA data must be formatted using the standard data format known as VLBI data interchange format (VDIF, Whitney et al. 2009), to enable the subsequent VLBI correlation. The phased sum data are received by the FPGA on the VLBI formatter board from the 16 baseline FPGAs, via sixteen 1 Gbps serial links (four 64 MHz sub-bands per baseline FPGA). Data from each group of four sub-bands, processed by the same baseline FPGA, are integrated in one VDIF thread and formatted in VDIF data frames, whose header includes the timestamp for the data, along with other information that is critical for VLBI correlation.
Each four consecutive VDIF threads are then multiplexed into a VDIF data stream (4 Gbps net), which is packaged into user datagram protocol (UDP) packets and transmitted to the recorder via a 10 GbE interface (see Fig. 4). Thus, there are a total of four 10 GbE interfaces, each of which can be connected to a recorder 10 GbE interface via an optical fiber and SFP+ transceivers at both ends.
Causality delay budget.
2.5 Causality delay
The reference position of the array is the intersection of the azimuth and elevation axis of the reference antenna. However, as noted in Sect. 2.4.2, the data are time-stamped at the output of the antenna FPGAs in the PolyFiX correlator, after the delay correction. As a consequence, there is a causality delay between these two places, which we estimate in Table 1.
RF transport corresponds to the extra optical path of the reflexions (primary, secondary, and relay optics), estimated to be of the order of 15 m. IF transport corresponds to the propagation delay in the optical fibers carrying the analog signals from the antennas to the correlator room. Lengths range from 130 m to 1530 m for the shortest and longest fibers. Since in VLBI mode, delays are adjusted so that the reference antenna is in the middle of the digital delay line (of a total length of 16 microseconds), there is a constant extra delay of 8000 nanoseconds.
2.6 Software
The NOEMA phasing system uses all the software components of the regular observing mode, with the addition of a phase solving software called INCA. The correlator software, correl, broadcasts a spectrum-averaged visibility every second for every correlator unit. The internal data processing in correl takes 3 seconds, so that data are available only 3 seconds after they are acquired. In addition, correl monitors and controls all VLBI-related parameters of the correlator firmware (small delay correction, phasing antenna mask, requantification threshold level). In addition, correl also sends phase corrections to the correlator firmware.
The phase corrections are computed by INCA. The visibilities from correl are averaged over a user-defined integration period, then the following linear system is solved for amplitudes and phases,
 (2)
(2)
 (3)
(3)
 (4)
where ϕij and Aij are the phase and amplitude of the visibility, Vij, while ψi and Ai are the phase and amplitude of antenna i. For the time being, the phasing system assumes a point-source model (no source structure is considered for the intra-NOEMA baselines).
(4)
where ϕij and Aij are the phase and amplitude of the visibility, Vij, while ψi and Ai are the phase and amplitude of antenna i. For the time being, the phasing system assumes a point-source model (no source structure is considered for the intra-NOEMA baselines).
The phasing efficiency (see Sect. 4.2.1 for a definition) is computed on the averaged visibilities and INCA sets a logical new_phase to true in a shared memory. When they are available, correl applies these phase corrections, then sets new_phase to false when the corrections reach the broadcasted data, which triggers the next INCA integration. Figure 5 shows some details of the software phasing loop. One advantage is that the phasing loop period can be set independently of the regular acquisitions; hence, can easily be adjusted during an observing run.
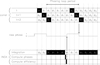 |
Fig. 5 Phasing loop between correlator software correl and phasing software INCA. Black squares in the top rows (correl) indicate the dump with new phase corrections. In the bottom rows (INCA), they indicate the dumps which are used for phasing correction integration. This example shows a 4 s integration (which corresponds to a 7 s phasing loop period). INCA computations have been stretched for clarity. |
3 VLBI operations
3.1 VLBI bands
The NOEMA phasing system can operate in any of the NOEMA bands (3 mm, 2 mm, 1 mm, and 0.8 mm). At the time of writing, NOEMA participates regularly in the Global Millimeter VLBI Array (GMVA, 3 mm band) and the Event Horizon Telescope (EHT, 1.3 mm and 0.8 mm bands) observations. Phased NOEMA station code is Nn (for N times NOEMA). The operational characteristics differ slightly between bands; we will describe the different technical setups in the following. Please note that those setups correspond to the time of writing and may evolve in the future.
3.1.1 NOEMA frequency setup
Figure 3 shows a sketch of the NOEMA IF frequency coverage. The receivers and the correlator are able to support 128 Gbps recording, but with four Mark 6 recorders installed at the observatory, only 64 Gbps is supported at this time (see Sect. 2.3.4).
Setups observing in single sideband (a recorded band smaller than the receiver bandwidth) offer some flexibility with respect to the tuning, as a shift in the receiver frequency can be compensated by a equal shift in the selected IF. Dual-sideband tunings are constrained to the common IF range of participating stations.
3.1.2 GMVA at 3 mm
GMVA records 512 MHz in a single sideband, dual polarization, for a total of 4 Gbps. To avoid recabling when switching to the EHT at 1.3 mm, recorder 2 is used; PolyFiX unit 6 (VLI, LCP, threads 4–7) SFP+1 is connected to eth3, PolyFiX unit 2 (HLI, RCP, threads 4–7) SFP+1 is connected to eth4.
3.1.3 EHT at 1.3 mm
EHT at 1.3 mm records 4 GHz in two sidebands, dual polarization, for a total data rate of 64 Gbps. The IF range is 5 to 9 GHz; the LO1 frequency is set at 221.1 GHz (Event Horizon Telescope Collaboration 2019a). The NOEMA phasing system records three data streams from the inner baseband (4.704 to 7.744 GHz) and one data stream from the outer baseband (7.744 to 8.736 GHz). This is split into two recorders 4.704 to 6.752 GHz, and 6.752 to 8.736 GHz, each one corresponding to an EHT band (LSB: b1 and b2, USB: b3 and b4).
However, the two EHT bands of a sideband go to different correlation centers (one to MIT Haystack and the other to MPIfR Bonn) and since the EHT bands cover 5 to 7 GHz and 7 to 9 GHz, part of NOEMA data (the 6.752 to 7.000 GHz range) would end up in the wrong correlation center2. This issue is due to the fact that the NOEMA LO2 is fixed at 7.744 GHz and not 8 GHz as for the other EHT stations. The NOEMA phasing system alleviates this problem by using the sub-band selector feature (see Sect. 2.4) to swap sub-bands 12 to 15 with sub-bands 44 to 47 for the inner PolyFiX basebands (IF ranges 6.752 to 7.008 GHz and 4.704 to 4.960 GHz).
3.1.4 EHT at 0.8 mm
NOEMA presently has only six antennas equipped with 0.8 mm receivers. In addition, most receivers (only one antenna is equipped with a 2SB receiver) are single-sideband (SSB), with a 4 to 8 GHz IF, so recording is done at 32 Gbps. As NOEMA is single-sideband, there is some leeway in the receiver tuning but to keep with the recommended EHT setting, phased NOEMA uses a LO frequency of 342.6 GHz and records the lower sideband (EHT bands b1 and b2). For better alignment to the standard frequency range of the EHT bands, the sub-band selector is used to swap sub-bands 28 to 31 with sub-bands 60 to 63 for the inner basebands (IF ranges 5.728 to 5.984 GHz and 3.680 to 3.936 GHz, respectively).
3.2 VLBI observing mode
Before starting a VLBI session, the VLBI synthesizer is connected to the appropriate LO control rack (A for 3 mm, B for 1.3 mm and 0.8 mm). Optical fibers from the PolyFiX units to the Mark 6 recorders are connected according to the setup for the observing band (see Sect. 3.1). In VLBI mode, LO1 phase and rate are nullified for the reference antenna by subtracting corrections for the reference antenna from all antennas. The reference antenna delay correction is set to be at half the delay line length and the same principle is applied to delays. In VLBI mode, the Walsh π/2 modulation is unused, so the image and signal sidebands are not separated (but the image sideband is attenuated by >13 dB by the sideband separating receiver).
3.3 Observing
The interferometer is controlled by the OBS software that defines the desired receiver and backend configuration, loads astronomical targets, and performs pointing, focus, calibrations and observations. Due to the complexity of the instrument, telescope operators and astronomers use well-established command sequences in macro language, in addition to interactive commands. The VLBI observations are assisted by a special AUTO_VLBI.obs macro that includes VLBI-specific commands with added timekeeping to respect the tight schedule of VLBI scans that must be observed synchronously across all participating observatories. OBS interacts with multiple tasks that run in the background and communicate over shared computer memory with correl for the control of the correlation, with RDI for the real-time data reduction, and with many other tasks that control the receivers, signal transport, and antenna movement of the interferometer array.
3.4 Monitoring
Local NOEMA data are stored in IPB files (the NOEMA interferometer file format) and can be read and analyzed with the CLIC software, which is part of the freely available GILDAS3 package. For each baseband, the data include: time dumps (one complex value, corresponding to the frequency averaged visibility) every second and spectral dumps (2032 complex channels, corresponding to the time averaged visibility) every integration period (from 5 s to 80 s), along with all the associated metadata.
VLBI-related parameters are stored in a specific VLBI section of the NOEMA data format. This includes the antenna mask, the reference and the comparison antennas. Phasing efficiencies are stored every second (even if it updated less frequently; see Sect. 2.6). For EHT observations, a number of metadata (notably weather, system temperature, phasing efficiency) are uploaded to the vlbi-monitor webserver together with that of other stations for central operation monitoring.
3.5 VLBI correlation
Because of the various frequency setups used in a single VLBI experiment (including the singular NOEMA recording scheme), correlations have to be done independently for each common IF range within which the data coming from all stations are mutually consistent.
For both GMVA and EHT observations, the DiFX software correlator (Deller et al. 2011) is used for data correlation. From version 2.5 onward, DiFX offers “zoom bands,” which is precisely the functionality needed, as it identifies ranges of IF frequency that are common between all stations and performs correlation between stations in those restricted frequency ranges. However, the standard VLBI data formats, FITS-IDI and HOPS/Mk4, do not support handling such a collection of zoom bands. Another revision of DiFX (version 2.7) now offers the “outputbands” feature with some additional processing that concatenates zoom bands and produces a coherent spectral setup (Wagner 2020). For the EHT, correlations are split between the correlator at the Max-Planck-Institut für Radioastronomie (MPIfR) in Bonn, Germany and the MIT Haystack Observatory correlator in Westford, Massachusetts, USA (see also Sect. 3.1.3). For the GMVA, all correlations are done at the MPIfR.
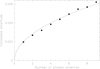 |
Fig. 6 Correlated amplitude of the baseline between the summed signal and the comparison antenna as a function of the number of antennas in the summed signal. The solid line shows a fit to the data |

4 Performance
4.1 Adding
Figure 6 shows the correlated amplitude of the visibility, |Vcs|, between the phased sum signal and the comparison antenna (not included in the sum) as a function of the number of antennas in the summed signal. Observations were done on 3C 345 at 3 mm. We found the amplitude scaled as the square root of the number of antennas in the phased sum.
4.2 Phasing efficiency
4.2.1 Definition
For NOEMA, the phasing efficiency, ηϕ, is defined as
 (5)
where Vcs is the complex visibility between the summed output and the comparison antenna, Vci the complex visibility between antenna i and the comparison antenna. The sum in the denominator is done over all the antennas that are added together (i.e. those selected via the phasing antenna mask).
(5)
where Vcs is the complex visibility between the summed output and the comparison antenna, Vci the complex visibility between antenna i and the comparison antenna. The sum in the denominator is done over all the antennas that are added together (i.e. those selected via the phasing antenna mask).
4.2.2 Performance
Figure 7 shows the phasing efficiency performance of a typical GMVA observation (at 3 mm). The phasing efficiency is excellent, apart from the first points of a scan when the phasing loop locks again after the interruption between scans. For that reason, the local VLBI scans are started (a few seconds) before the actual recording to ensure that the phasing loop is settled when the recording starts. We can notice the influence of the wind since the first two scans have a slightly lower phasing efficiency than the rest of the track, despite being observed at higher elevation with lower system temperature.
Figure 8 shows the performance during an EHT observation (at 1.3 mm). The sources are at lower elevations than the ones in Fig. 7 and the system temperature considerably higher (see also Table 2). We can once again see the influence of the wind on the atmospheric phase fluctuations with a lower phasing efficiency in the first scans, even though they are observed at higher elevations with lower system temperature. Although the Galactic center source Sgr A* is at low elevation (culminating at 16◦ elevation from NOEMA), the phasing loop is able to operate with decent phasing efficiency (>80%).
Typical system equivalent flux density and minimum flux density for phasing.
4.3 System equivalent flux density
Table 2 shows the typical system temperature, Tsys, and system equivalent flux density (SEFD) computed using Eqs. (3) and (10) of Event Horizon Telescope Collaboration (2019b) for the winter and summer semester at 3 mm and 1 mm.
The actual numbers will obviously depend on the water vapor content of the atmosphere, the number of antennas added, and the phasing efficiency of the system, but this gives an order of magnitude of the values to be expected, which can be used for planning an experiment. The minimal source flux density that allows the NOEMA phasing system to be phased up also depends on the atmospheric conditions. It is important to get a sufficient S/N on the antenna phase correction within an integration period for each baseband.
When observing a source of flux density, Sν, with N antennas and a baseline sensitivity, σb, the antenna gain sensitivity σa is
 (6)
(6)
Thus, if Sν = σb, we have a noise on the phase of  radians or 17 degrees, which is sufficient for phasing up the array. We therefore use the baseline sensitivity as a proxy for the minimal flux density required for phasing. Using a 4 s integration period and 4 GHz bandwidth with the Tsys values from Table 2, we obtain the baseline sensitivity values that are reported in Table 2.
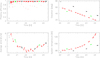 |
Fig. 7 Example of phasing efficiency performance for a GMVA observation at 3 mm. Top-left: phasing efficiency. Top-right: source elevation. Bottom-left: average wind speed. Bottom-right: system temperature. |
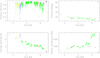 |
Fig. 8 Example of phasing efficiency performance for an EHT observation at 1.3 mm. Top-left: phasing efficiency. Top-right: source elevation. Bottom-left: average wind speed. Bottom-right: system temperature. |
4.4 Detections and S/N
The first fringe detections of phased NOEMA were obtained during a 3 mm test observation in December 2020, on baselines with the Yebes 40 m (03:05:13 West, 40:31:28 North) and IRAM 30 m (03:23:56 West, 37:04:06 North) telescopes. Figure 9 shows the fringe plot for the baseline between IRAM 30 m and NOEMA. The S/N is excellent and matches expectation given the NOEMA and IRAM 30 m SEFD and the source correlated flux on this 320 Mλ baseline (Nair et al. 2019).
Kim et al. (2023) reported GMVA observations of BL Lac, including phased NOEMA. They find that fringes on baselines including NOEMA have the highest S/N values (see their Fig. 2) and the inclusion of NOEMA in the array improves the sensitivity by a factor of 2.5, testifying to the performance of the NOEMA phasing system.
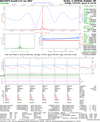 |
Fig. 9 Fourfit plot of the first 3 mm fringes (source 3C 454.3) between phased NOEMA and the IRAM 30 m telescope on December 2, 2020. |
5 Conclusions and perspectives
The NOEMA phasing system has been shown to provide the expected gain in sensitivity (over a single antenna), making the phased NOEMA array as sensitive as a ∼50 m single-dish (of high aperture efficiency). NOEMA has been participating in regular VLBI observations since 2021, both for the GMVA at 3 mm and the EHT at 1.3 mm and 0.8 mm.
Future developments or directions of developments include:
upgrading the NOEMA reference frequency synthesizers (to devices offering better phase stability) in order to avoid using the current dedicated VLBI synthesizer, which requires recabling before and after each VLBI observation. This would ease “turn-key” VLBI;
using the water-vapor radiometers for phasing the interferometer, which would enable phasing for weak sources for which active phasing is not possible;
achieving the possibility to do active phasing on bright spectral lines, such as masers;
using the dual-band capabilities of NOEMA to phase up and record data from the 3 mm and 1 mm receivers simultaneously. The optical setup of the dual-band receivers precludes the use of quarter-wave plates for both bands, so at least one band will have to be observed in a linear polarization basis. This will enable a phase transfer that uses the lower frequency band to steer the phases of the higher frequency band;
installing new 0.8 mm receivers in all antennas;
developing more complex phasing loops.
Acknowledgements
We thank the IRAM 30 m telescope, the Yebes Observatory and the Greenland telescope (GLT) staff for their help with test observations. We thank the Max-Planck-Institut für Radioastronomie (MPIfR, Bonn) for performing the correlation and analysis of our test data. We acknowledge very useful discussions with the members of the Event Horizon Telescope NOEMA phasing system qualification review panel (Jonathan Weintroub, Geoff Crew, Lynn Matthews, Helge Rottman and Jan Wagner) and the EHT System Engineer André Young. André Young and Jason SooHoo helped with the first NOEMA VLBI observations. We thank Sebastiano D. von Fellenberg for identifying the phase jumps in the NOEMA passband, and for the fruitful discussions that helped us to correct this issue in the PolyFiX firmware. We thank Alan Roy (MPIfR) for a useful internal review of the manuscript. We thank the NOEMA operators (Jonathan Ballot, Claire Castellazzi, Patrick Chaudet, Kevin Combe, Maya Houamed, Sophie Leonardon, Lilian Masnada, André Rambaud and Emmanuel Salgado) for their help. IRAM is supported by INSU/CNRS (France), MPG (Germany) and IGN (Spain). The NOEMA phasing system project received funding from the ERC synergy grant “BlackHoleCam: Imaging the Event Horizon of Black Holes” (Grant No. 610058).
References
- Chenu, J.-Y., Navarrini, A., Bortolotti, Y., et al. 2016, IEEE Trans. Terahertz Sci. Technol., 6, 223 [CrossRef] [Google Scholar]
- Deller, A. T., Brisken, W. F., Phillips, C. J., et al. 2011, PASP, 123, 275 [Google Scholar]
- Event Horizon Telescope Collaboration (Akiyama, K., et al.) 2019a, ApJ, 875, L2 [Google Scholar]
- Event Horizon Telescope Collaboration (Akiyama, K., et al.) 2019b, ApJ, 875, L3 [Google Scholar]
- Galt, J. 1988, JRASC, 82, 242 [Google Scholar]
- García, R. G., Gentaz, O., Baldino, M., & Torres, M. 2012, SPIE Conf. Ser., 8452, 84522T [Google Scholar]
- Greve, A., Torres, M., Wink, J. E., et al. 1995, A&A, 299, L33 [Google Scholar]
- Janssen, M., Goddi, C., van Bemmel, I. M., et al. 2019, A&A, 626, A75 [NASA ADS] [CrossRef] [EDP Sciences] [Google Scholar]
- Kellermann, K. I., & Moran, J. M. 2001, ARA&A, 39, 457 [Google Scholar]
- Kim, D.-W., Janssen, M., Krichbaum, T. P., et al. 2023, A&A, 680, L3 [NASA ADS] [CrossRef] [EDP Sciences] [Google Scholar]
- Krichbaum, T. P., Graham, D. A., Witzel, A., et al. 1998, A&A, 335, L106 [NASA ADS] [Google Scholar]
- Martí-Vidal, I., Roy, A., Conway, J., & Zensus, A. J. 2016, A&A, 587, A143 [NASA ADS] [CrossRef] [EDP Sciences] [Google Scholar]
- Matthews, L. D., Crew, G. B., Doeleman, S. S., et al. 2018, PASP, 130, 015002 [Google Scholar]
- Mattiocco, F., Garnier, O., Maier, D., Navarrini, A., & Serres, P. 2016, IEEE Trans. Terahertz Sci. Technol., 6, 212 [Google Scholar]
- Nair, D. G., Lobanov, A. P., Krichbaum, T. P., et al. 2019, A&A, 622, A92 [NASA ADS] [CrossRef] [EDP Sciences] [Google Scholar]
- Tilanus, R. P., Marrone, D. P., Fish, V. L., et al. 2013, Future EHT VLBI System Configuration, Tech. Rep. 2013-ETWG-01, EHT memo series [Google Scholar]
- von Fellenberg, S. D., García, R., Janssen, M., et al. 2025, RNAAS, 9, 134 [Google Scholar]
- Wagner, J. 2020, DiFX Outputbands, Tech. rep. [Google Scholar]
- Whitney, A., Kettenis, M., Phillips, C., & Sekido, M. 2009, in 8th International e-VLBI Workshop, 42 [Google Scholar]
- Whitney, A. R., Beaudoin, C. J., Cappallo, R. J., et al. 2013, PASP, 125, 196 [Google Scholar]
- Young, A., Primiani, R., Weintroub, J., et al. 2016, in 2016 IEEE International Symposium on Phased Array Systems and Technology (PAST), 1 [Google Scholar]
This was the case for the EHT 2021 observations. The sub-band selector was first used for the EHT 2022 observations.
Appendix A Phase jumps in the NOEMA passband
Phase jumps in the NOEMA passband were identified in 2023 by the EHT calibration team in the data collected during the EHT 2021 observing campaign, the first campaign with the participation of NOEMA. Analysis of the NOEMA visibilities revealed phase offsets of multiples of 90◦ at the edges of the PolyFiX 64 MHz sub-bands. While it is constant most of the time, the value of the phase jumps can change if a PolyFiX baseband unit is reset during observations.
These phase jumps were not detectable locally with PolyFiX, since the local cross-correlations are computed for each pair of NOEMA antennas, but for the same sub-band. Thus, the phase difference between sub-bands is not measured.
A dedicated software calibration procedure was developed, within the rPICARD pipeline (Janssen et al. 2019), to correct the phase jumps in the NOEMA data from the 2021, 2022 and 2023 EHT campaigns. In parallel, we identified the causes for the phase jumps in the signal processing pipeline of PolyFiX in VLBI mode, and implemented firmware modifications to remove them.
The new firmware version for the antenna and the baseline FPGAs of PolyFiX was installed at the NOEMA observatory in January 2024. The analysis of data from the GMVA session of April 2024, showed a continuous phase response for the NOEMA passband, without any phase offsets between sub-bands. The previous firmware version, presenting phase jumps, was used for VLBI observations between April 2021 and the end of 2023. As a result, the post-processing phase calibration of the NOEMA visibilities will not be necessary for data collected during EHT campaigns from 2024 onward.
von Fellenberg et al. (2025) provide a detailed description of the dedicated phase calibration strategy, and the firmware update implemented to remove the phase jumps in the NOEMA passband.
All Tables
All Figures
|
Fig. 1 Schematic architecture of the NOEMA phasing system. Frequencies are in MHz. For clarity, the phasing is shown only for the outer baseband, but the system enables the phasing of any baseband. |
| In the text | |
|
Fig. 2 Allan deviation of the hydrogen maser at NOEMA measured against a Rakon HSO14 5 MHz OCXO crystal. The rise after 10 seconds is due to the crystal oscillator, not the maser itself. |
| In the text | |
|
Fig. 3 NOEMA frequency coverage (all frequencies are in MHz). Top: receiver frequency coverage. Four IF (2 sidebands ×2 polarizations) are selected by the receiver. The IF processor uses a LO2 at 7744 MHz to split each IF in two basebands (Inner and Outer). Bottom: each baseband is split in 64 sub-bands that are 64 MHz wide after discarding the overlapped sub-band flanks. Four sub-bands (256 MHz) form a VDIF thread (see Sect. 2.4.3) and four threads are multiplexed on a stream to the recorder. |
| In the text | |
|
Fig. 4 Digital signal processing pipeline for a PolyFiX baseband unit in VLBI phased array mode. |
| In the text | |
|
Fig. 5 Phasing loop between correlator software correl and phasing software INCA. Black squares in the top rows (correl) indicate the dump with new phase corrections. In the bottom rows (INCA), they indicate the dumps which are used for phasing correction integration. This example shows a 4 s integration (which corresponds to a 7 s phasing loop period). INCA computations have been stretched for clarity. |
| In the text | |
|
Fig. 6 Correlated amplitude of the baseline between the summed signal and the comparison antenna as a function of the number of antennas in the summed signal. The solid line shows a fit to the data |
| In the text | |
|
Fig. 7 Example of phasing efficiency performance for a GMVA observation at 3 mm. Top-left: phasing efficiency. Top-right: source elevation. Bottom-left: average wind speed. Bottom-right: system temperature. |
| In the text | |
|
Fig. 8 Example of phasing efficiency performance for an EHT observation at 1.3 mm. Top-left: phasing efficiency. Top-right: source elevation. Bottom-left: average wind speed. Bottom-right: system temperature. |
| In the text | |
|
Fig. 9 Fourfit plot of the first 3 mm fringes (source 3C 454.3) between phased NOEMA and the IRAM 30 m telescope on December 2, 2020. |
| In the text | |
Current usage metrics show cumulative count of Article Views (full-text article views including HTML views, PDF and ePub downloads, according to the available data) and Abstracts Views on Vision4Press platform.
Data correspond to usage on the plateform after 2015. The current usage metrics is available 48-96 hours after online publication and is updated daily on week days.
Initial download of the metrics may take a while.