Fig. 1
Download original image
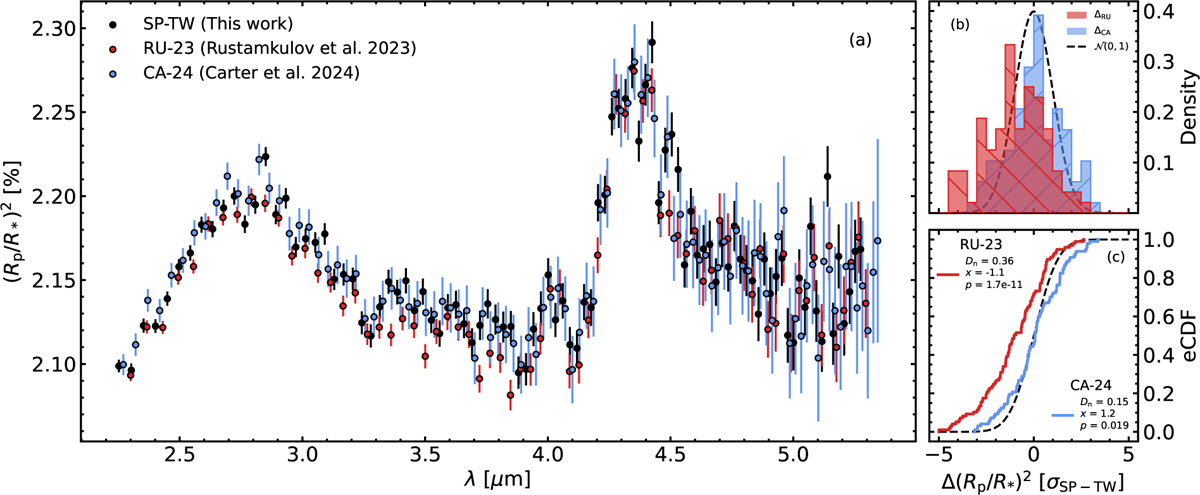
Comparison of transmission spectra used in this work. Data associated with the spectrum produced in this work (SP-TW) are shown in black, while data associated with Rustamkulov et al. (2023) (RU-23) and Carter & May et al. (2024) (CA-24) are shown in red and blue, respectively. (a) Transmission spectra, showing wavelength (in μm) on the x-axis and transit depth (in %) on the y-axis. (b) Residual distribution of RU-23 and CA-24, normalised to the transit depth uncertainty of SP-TW. For display purposes, the residuals are binned in steps of 0.5 σsp-TW. (c) Empirical cumulative distribution functions (eCDF) for the residuals of RU-23 and CA-24. The values of a one-sample K-S test for a standard normal distribution are given in the legend of the figure. In (b) and (c), the black dashed line represents the PDF and CDF of N(0,1), respectively.
Current usage metrics show cumulative count of Article Views (full-text article views including HTML views, PDF and ePub downloads, according to the available data) and Abstracts Views on Vision4Press platform.
Data correspond to usage on the plateform after 2015. The current usage metrics is available 48-96 hours after online publication and is updated daily on week days.
Initial download of the metrics may take a while.